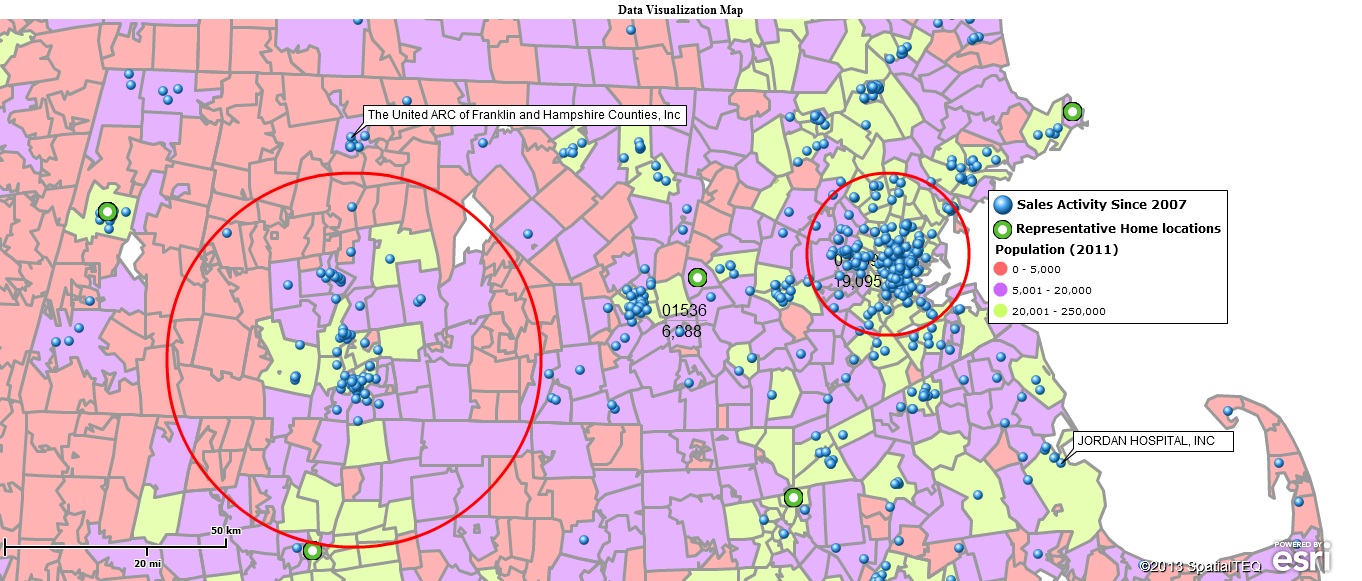
Business Data Visualization – A Picture of Your Enterprise
Any competent sales organization uses a variety of sales software tools to organize and grow their business. Sales software offerings can focus on contact management, strategic planning, market analysis or a variety of search engine optimization platforms. I would like to suggest to you that sales mapping software and its ability to provide geographic data visualizations of your business might be the most powerful aide to organizing and growing your business – regardless of the business type or size.
Data Visualization - What does it mean?
Sales data falls into three major categories: Customers, Prospects, and Competitors. There are many more categories you could consider, like store locations, sales rep homes, and reseller locations, but let's focus on the top three. Visualization means actually seeing where, on the face of the Earth, those top three sets of data points are located. Data visualization is a process within most business mapping software programs that allows you to see where your customers are located, where your prospects live, or where your competitors have presence.
The first time you import a spreadsheet of customers and visualize them against a map you notice where most of them are gathered or clumped together. This confirms what you probably already know, where your main operations are located. But as you gaze further at your first customer mapping exercise you begin to harvest other nuggets of information. You notice outlying customer locations, and where your largest customer is located with respect to other customers and to your home base. You may also notice areas where you have no sales activity at all. These visualizations help to generate questions. Like, "Where are my future sales coming from?" and "Where are my competitors focusing their efforts?"

Thus your next mapping exercise for your sales mapping software may be to visualize prospect lists and competitor locations. This sales map view can quickly inform a sales manager about obvious next steps in growing the business. Look for prospects clumps with few competitors nearby, or perhaps look at where your competitors are located and you are not. How do these map views fit into your current strategic plan? Perhaps there are more location-based datasets in your business that can make the view even more valuable. And maybe it's time to adjust the objectives of a few sales people.
A Variety of Business Views
Business map data visualizations are used to support a variety of sales processes. The above analysis informed a sales plan, but the same customer mapping scenario could be used to improve communications among a nationwide sales team, or to manage a lead referral processes in a busy call center. Marketing departments utilize business map data visualizations in a similar fashion to geographically segment prospect lists into smaller, more manageable lists for outbound calling or email campaigns.
Data visualizations are the stepping stones to more advanced uses of business mapping software like territory mapping, work process maps, and the concept of cost reductions through process improvements such as fuel reductions through optimized routing.
If a picture is worth a thousand words, I wonder how many thousands of dollars your maps might be worth. Especially if your competitors are be using business mapping software already.
Contact us to see how you can get started today!
PDF Sponsor: www.mapbusinessonline.com
Author: Geoffrey Ives
Contact: geoffives@spatialteq.com (800) 425-9035


