Conduct Strategic Planning with Business Mapping

At Castle Devices, Strategic Planning can be a painful process. This is not unusual in business. Managers feel threatened as their approach to business processes are openly critiqued. Sales managers especially can get the heebie-jeebies, after all sales efforts are usually the number one initiative supporting revenue growth and are thus subjected to intense scrutiny.

Castle Devices, a nationwide organization with emphasis in the Northeast USA, requires upper level management and key managers to share all the information they can possible gather while conducting a strategic planning project. This planning process assures the company can adjust its overall direction to accommodate current opportunities and avoid future bumps in the road.

Planning in good times can feel just plain wrong. Why fix what’s not broken? But, a leader with clear vision knows good times are always followed by tough times. And it’s that leader’s job to see the company through those bad times, minimizing revenue loss and lowering employment attrition.

Problem: Identify the top three new market opportunities and rearrange legacy sales account relationships and territories to best leverage these new industry opportunities.

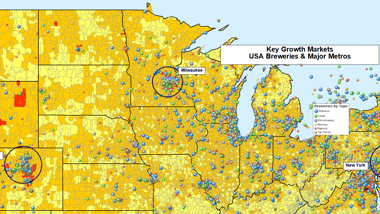
Castle devices has always sold a majority of their controls into the paper mill industry. Even as paper production has tapered off and moved overseas, their sales held steady because their control devices tended to require updating regularly and they benefited from constant paper production machine changes. But now sales are tanking in their primary market. Meanwhile new markets are ascending – local breweries, biotech, and alternative energy markets, to name a few. The company must interrupt its sales patterns and refocus the sales team on new markets.

Solution: Create several business maps that define current customers, sales territories and sales associate patterns. Overlay new business opportunities and design sensible strategies to develop those new industry opportunities using the existing sales force.

Planning Tools

A successful strategic plan utilizes a variety of tools that combine to identify challenges and suggest solutions. A SWOT analysis is one such tool – a study of internal company Strengths and Weaknesses and a look at external Opportunities and Threats. Other tools might include the technology plan from the IT department, a five years Sales Plan from the sales group, a thorough market analysis, and perhaps a long-term product plan from manufacturing.

Business mapping software as an analysis and planning tool was implemented this year at Castle Devices. Location awareness has not been a primary driver in Castle’s decision making process. But this year, the recently hired Strategy Director had some ideas she wanted explored via a business mapping tool.

How to Conduct Strategic Planning Using Business Mapping Software

  1. The Strategy Director requested location based spreadsheets from each department. This meant separate columns for Address, City, State and ZIP code or two latitude and longitude columns in addition to all other pertinent data columns:
    1. Sales provided an existing account spreadsheet with sales dollars over three years and a code for market identification and an indicator if the account was a Legacy Paper account. They also provided home address locations for all sales reps in the field
    2. Marketing provided a spreadsheet showing marketing expenses over three years by Metropolitan Statistical Area
    3. Manufacturing provided a list of all warehouses and shipping facilities with data showing the primary markets supported based on product availability
  2. An admin spent a few hours importing these data sets into the business mapping software:
    1. Sales accounts were symbolized to represent industry type, and color coded and sized to expose legacy accounts. Sales value were posted in labels
    2. Sales representative home locations were symbolized by a car icon. Sales territories were defined by county groupings across state lines as typically displayed in the sales territory map template
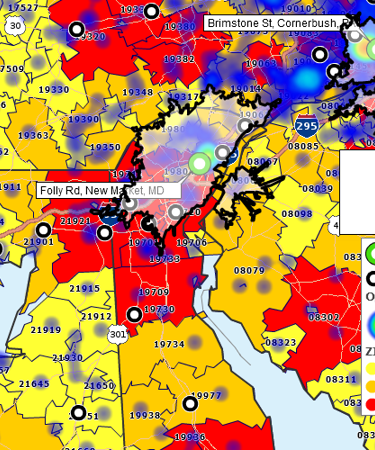
    3. Marketing investments were color coded by MSA to show where the most money is allocated
    4. Warehouse facilities were designated by black triangles and color coded to reflect the percentage of material dedicated to paper, breweries and biotech and other industries
  3. A meeting was called with key decision makers. The map application was shared using a conference room projector and an internet screen sharing application for remote attendees.

Visualizations of the current sales situation quickly established the sales associates who were married to legacy accounts, in danger of tanking over the next six months. Breweries, biotech and alternative energy accounts showed strong growth over three years and were popping up in sales territories around the country. Two sales associates had spent most their time growing these new industries.

Both marketing advertising spend and warehouse inventory investments were weighted in favor of paper accounts where business was dropping off. Turn and earn ratios applied to inventory “A” items, bore this out.

The New Strategy: Pivot to New Markets Over the Next 6 Months

For the next year, the new Strategy Manager would have overall control over sales, marketing and warehousing as the Castle Devices moves to service new markets. Once sales results show a shift to new markets, control will be returned to sales management. In addition to new sales goals and objectives, the key elements in the plan are:

Sales Tactics – work collaboratively with all departments to achieve goals

  • No sales associates can spend more than 30% of their time calling or servicing legacy paper accounts unless a significant contract is in the offing
  • At each monthly sales meeting, an appropriate sales associate will share their knowledge about one of the new Castle Device markets explaining:
    • New product requirements and vendor relationships
    • New industry customer manufacturing and service requirements
    • Key questions to ask new a market opportunity client
    • Pitfalls and problems reps have run into while catering to new markets and ways to avoid them

Marketing tactics – work collaboratively with all departments to achieve goals

  • Conduct a thorough marketing review of new industry targets and adjust messaging to reflect the shift
  • Determine the most viable marketing channels to reach new market decision makers and exploit as required
  • Research all new market keyword phrases and post industry web pages that support new targets
  • If you can’t change the people – change the people

Warehousing Tactics – work collaboratively with all departments to achieve goals

  • Adjust inventory replenishment levels to reflect the focus on new industries
  • Work with vendors to return inventory overages and bring the turn & earn ratios in line with standard targets
  • Consider closing redundant warehouses and shifting the investment to new locations where inventory presence could help drive sales

While none of the strategic shifts reviewed by Castle Devices were rocket science, the plan may have saved the company from failure over the next two years – depending upon economic conditions. An economy can go south quickly.

Business mapping tools were instrumental to the visualization of the problem and the development of a strategic plan.

Learn How Our Customers are Succeeding with MapBusinessOnline

One of many international companies left hanging by Microsoft’s cancelation of MapPoint and turning to MapBusinessOnline for a MapPoint replacement. Multiple departments across the enterprise utilize business mapping for a variety of applications including claims management analysis, insurance related operational planning, and market analysis. An extremely detailed procurement and security review lead to a contract for MapBusinessOnline services. Corporate accounts use MBO for sales territory mapping, collaborative Team editing, and communicating with maps.

Top Ten Property & Casualty Insurer

"Unleashing Growth: How MapBusinessOnline added value to our Franchise Business"

"Since our franchise businesses began utilizing MapBusinessOnline seven years ago, we have experienced a remarkable added value in our operations and growth. MapBusinessOnline has provided us with an innovative, user-friendly, and powerful tool to manage and expand our franchise territory landscape. With its comprehensive mapping and data visualization capabilities, we have been able to make strategic decisions based on the data insights and effectively plan our expansion strategies. The interface and seamless integration with our existing systems have made the transition to MapBusinessOnline a smooth and enjoyable experience.

One of the most significant benefits we have experienced with MapBusinessOnline is the ability to analyze a variety of markets quickly. This has allowed us to identify new opportunities and target areas for growth, ultimately leading to increased revenue and a stronger brand presence. The customer support provided by the MapBusinessOnline team have been exceptional, ensuring that our team is well-equipped to make the most of the platform's features. We wholeheartedly recommend MapBusinessOnline to any franchise business."

Marty Flanagan
VP of Brand Growth
Franchiczar ( Code Ninjas – Valhallan Esports – Iron24 Fitness+Recovery and Pinots Palette )

"We use MapBusinessOnline to prepare for sales meetings. The program’s territory mapping enables color-coded sales territories by zip-code helping to define sales responsibilities and keeping our focus on selling."

Christie Shedd
Operations Manager
AFTCO Bluewater

Popular MapBusinessOnline features

Build fast map visualizations of your business data

Map business data from various sources by street address, city name, ZIP code, or latitude and longitude. Plot 250,000 or more locations on a map at once. All you need to start is a spreadsheet with business data.

Visualize business data on map with various symbols

Assign specific symbols, colors, and sizes to your data points on map. Choose from a wide variety of symbols or create your own. Visually define customers and prospects across multiple locations using symbols color coding.

Design and visualize sales territories

Use our sales territory mapping software to create sales territories by ZIP code, county, or state. Aggregate demographics and sales data by territory. Search business data inside sales territories. Highlight territory overlap.

Emphasize customers density with heat maps

Highlight market areas that generate more business. Visually compare map areas for business potential. Select from a variety of heat map colors and options.

Share business maps

Create interactive maps and share with friends, colleagues, dealers, customers, prospects or vendors. Share territory maps. Email saved JPEG and PNG files or embed map files in PowerPoint presentations. Includes PDF export for larger print formats.