Create Fast & Captivating Heat Maps
Build Your First Business Heat Map
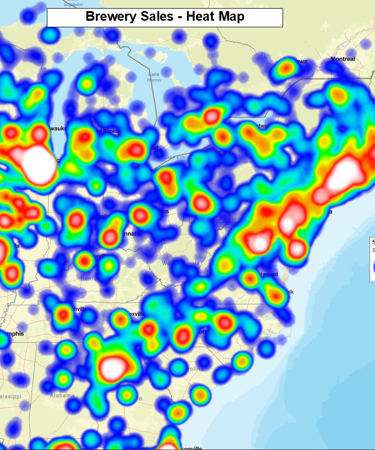
A heat map is a map-based visualization of numeric data that highlights the relative intensity of the selected data through color shadings. Heat maps are like weather maps, they provide an instant visualization of risk, opportunity, and stagnation for the map viewer. MapBusinessOnline makes it easy to create heat maps online from imported point data or as colored data themes applied to ZIP codes, counties, states, Census Tracts and other geographies.
Point-Based Business Heat Maps are Applied to a Variety of Industries:
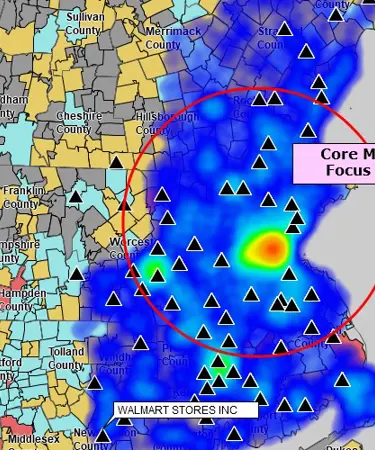
- Sales Organizations use heat maps to show increasing or decreasing intensities in location data. Sales activity can be reflected by heat mapping. Sales managers can easily share information about where sales are occurring; where business is growing or declining by displaying the data as a heat map.
- Law Enforcement agency heat maps access crime statistics for presentation as a heat map. Law enforcement maps often show statistical crime data in the form of a heat map intensities to define where illegal activity is concentrated. Heat maps transform relatively boring numeric data into colorful maps inspiring audiences into action.
- Healthcare Analysts portray disease epidemics as heat maps. These medical maps are used to track the progress of an outbreak and the effectiveness of mitigation efforts. Medical heat maps provide instant visualizations of areas at the highest risk of disease spread.
Creating Heat Maps from User Data
With MapBusinessOnline, heat maps are created from user data. Imported CSV files or Excel spreadsheets will contain separate columns for address information, and a specific column for heat mapping. The Heat Map button lets you choose your data and heat map column, as well as color intensity and shade.
| Address | City | State | Zip Code | Sales Activity Q1 |
| 101 School St | Morganton | IL | 47301 | $24,989 |
| 56 Bourbon St | Borlynn | OH | 34789 | $55,300 |
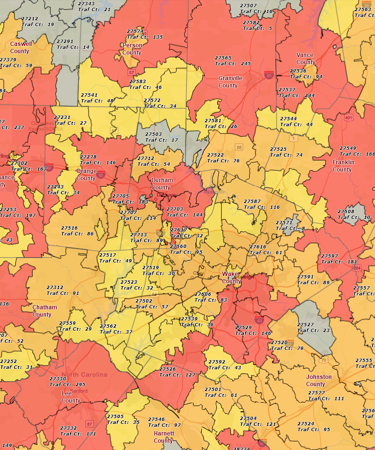
Another type of heat mapping is color-shading (color-coding) geographic districts like ZIP codes or counties. In MapBusinessOnline imported point data or demographic data can be used to color-code administrative districts. Color gradations for geographic districts can be based on imported address-based data or demographic data available within the mapping software.
Heat Mapping by Geographic Area (Color-Shading) Has Many Business Applications:
- New Retail Store Location Planning - Retail market analysts often color-shade a list of ZIP codes by Census Bureau population statistics. More populated areas or areas with higher income levels can be color-shaded with deeper shades. The most cost-effective construction locations can then be overlaid.
- Insurance Underwriters import claims data by address and compile ZIP code heat maps based on risk assessments. Higher risk ZIP codes can be color-coded in progressively brighter colors.
- Real Estate Developers use heat maps to delineate address-based housing assets by value against a background of Census tract or ZIP code neighborhoods color-coded by income levels. For good or for bad, house flipping plans are generally designed around these heat map views of both point data and administrative district geographies.
See MapBusinessOnline in Action
Request a demo
Learn How Our Customers are Succeeding with MapBusinessOnline

"This software is a game changer for me in the workplace. Easy to use tools and a fast system to do the job efficiently and effectively every time. I’ve been able to build more territories with confidence, bringing my team more growth opportunities for 2019"
Daina C.
Franchise Development Manager
Amada Franchise, Inc.


"MapBusinessOnline is an amazing tool that I use every week. When you are creating zip code footprints and trying to determine what zip codes fall within a range of a business, this tool couldn't be any easier to use. There's actually so many functions that are great but specifically I use MapBusinessOnline to create either a mile radius or a drive time radius from a business location. I then use that radius to determine which zip codes fall within the radius. Why is this important? Because I then export the zip codes and use another software that gets me exact counts of how many people fall within that radius in those zip codes. It's Amazing!
I highly recommend this software!"
Chris Farcher
Account Manager
The Mailworks

"This software has been tremendously helpful in mapping out my company’s sales territories map. I have researched many other products, but no one came close to the ease of use of data customization options MapBusinessOnline provides. Also, their maps are extremely accurate and pleasing to the eye. Sales projections and territory expansions can be easily mapped out with this software. Most importantly, they provide free training and a vast number of video guides that have been extremely helpful. It is apparent that this company cares about their product and their customers. Really happy with it."
KC Cooley
Credit Manager
Crediauto Financial

Popular MapBusinessOnline features
Emphasize customers density with heat maps

Highlight market areas that generate more business. Visually compare map areas for business potential. Select from a variety of heat map colors and options.
Color code maps by ZIP code, county, or state

Import business data by ZIP code to show it geographically. Create colorful maps for business analysis that connect real Census data to locations on the ground.
Display business data against demographic maps

Categorize geographic areas by population or household income. Explore new markets, business patterns, or social trends against color coded Census maps for business and competitor analysis.
Build fast map visualizations of your business data

Map business data from various sources by street address, city name, ZIP code, or latitude and longitude. Plot 250,000 or more locations on a map at once. All you need to start is a spreadsheet with business data.
Illustrate business data on map with charts

Graphically depict your business data on a map using pie or bar charts. Use charts to show sales by product, invoices due vs. paid, products ordered vs. shipped, and sales by customer demographics.
Visualize business data on map with various symbols

Assign specific symbols, colors, and sizes to your data points on map. Choose from a wide variety of symbols or create your own. Visually define customers and prospects across multiple locations using symbols color coding.
Add a variety of layers and data to map

Includes ZIP codes, Counties, States, Metropolitan Statistical Areas (MSA), Census Tracts, City Limits, ZIP3 codes, US cities, Highways, and other map layers.
Print large format map views

Print large maps to use in presentations and project plans. Save maps as PDF files to print as large as 60” x 60” customer maps. Supports multiple pages option to use your home or office printer for large wall maps.
Share business maps

Create interactive maps and share with friends, colleagues, dealers, customers, prospects or vendors. Share territory maps. Email saved JPEG and PNG files or embed map files in PowerPoint presentations. Includes PDF export for larger print formats.


