Getting started
Is MapBusinessOnline (MBO) brand new to you? Please check these simple instructions on getting started.
MapBusinessOnline is a cloud-based application that natively runs on desktop, laptop, and tablet computers operated by Windows or macOS. Start by downloading MapBusinessOnline App’s setup program.
Logging In
Use your email address (for example bob@gmail.com) to log into MBO. There’s the Set new password link on the login page in case you forget or need to change your password.
Your First Map
Upon opening MapBusinessOnline for the first time you get a map of the United States or Canada, depending on your version. You can Zoom way in or out using the Zoom control in the upper right corner of the map. Notice you can also click the USA flag button to zoom to a full USA view or click the Magnifying glass button to draw a zoom rectangle on the map. Click the Magnifying glass again to turn off the zoom tool.

As a business map user, you probably want to place business locations on the map. You can input an address in the Search box in the upper left-hand corner of the map. Click the Binoculars button when you’re finished entering: Address, City, State or just a ZIP code.

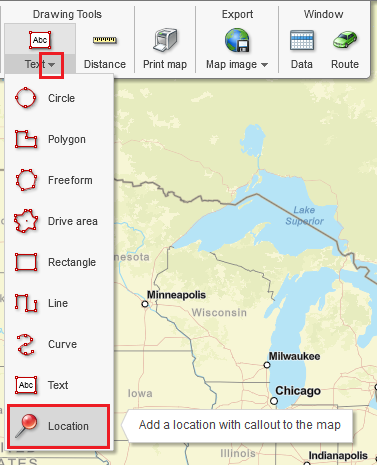
Another way to enter a location on the map is to drop down the Drawing tools and pick the Red pushpin tool. Now click the map where you want a point placed.

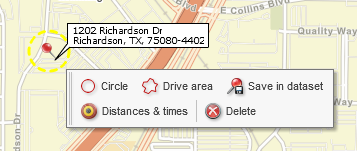
With either address input or pushpin placement a point is placed on the map and a little toolbar shows near that point. That toolbar lets you create a Circle or Drive area drawing, save the point in a dataset, or delete the point.

Import a Spreadsheet of Locations
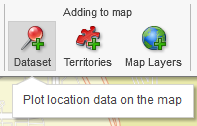
To place multiple points on the map, create a spreadsheet and import it into MBO using the Dataset button – Red pushpin with the Plus sign on the main toolbar.

Make sure your spreadsheet is location based with Address split into Street Address, City, State and ZIP code columns, like this (Learn more):
| Name | Address | City | State | ZIP code | Other |
| Frank Francis | 17 Norwood Ave | Rockport | MA | 01966 | Mow lawn |
| Bill Clinton | 10 Main St | Harlem | NY | 10027 | Find emails |
If your data has nicely named columns like the above example, importing data should be a breeze. After you’ve browsed to your data, you’ll just click Plot button to have MBO do the rest of the magic.
Symbolize & Color Code
After you plot your data the Data Window appears, so you can see your spreadsheet in the app. If you like you can color code and symbolize your data at that time. But you don’t have to if you want to focus on other things.
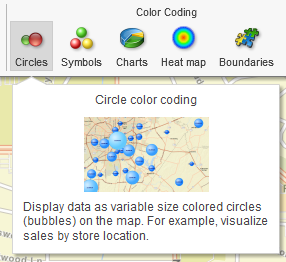
To color-code choose one of the several symbolization buttons on the toolbar starting from Green and Red bubble buttons. Pick your data, choose which column in your data to color code by and select symbols, colors, and sizes.

You Are Ready to Go
You are now officially a user of MapBusinessOnline. Use the Help button available on the main toolbar and in various views to learn about more or go to our YouTube site for video tutorials.


