MapBusinessOnline – Mapping Software for Business Intelligence


The MapBusinessOnline’s suite of business mapping software provides location-based services for three stages of map use for business:

Beginner – Basic map visualization for businesspeople new to business mapping or with very basic mapping requirements – MapBusinessOnline Starter – $250 with USA Map Data.

Business Manager – Large location dataset imports; territory creation, editing, and sharing; routing and logistics; demographic and business analysis – MapBusinessOnline Standard – $500 with USA Map Data.

Advanced Analysis – Very large dataset import; intensive territory creation and franchise mapping; driving time and distances analysis; demographic and geographic data appends – MapBusinessOnline Pro – $900 with USA Map Data.

Each level of MapBusinessOnline releases includes all the functionality of its less advanced predecessor. At any time, MapBusinessOnline users can log in to their account at MapBusinessOnline.com and choose Upgrade to purchase more advanced capabilities while protecting their existing investment. All upgrade pricing is prorated.

MapBusinessOnline’s Suite of Business Mapping Software

MapBusinessOnline Starter (New!)is the suite’s latest offering. Starter was developed based on the feedback received from existing and previous users and trialers who require only essential business mapping tools and prefer a lower price point. Starter allows imports of up to 20,000 location records per map (50,000 total per subscription) and provides color-coding and symbolization support. Demographic data and imported business data views are supported in Starter’s Data Window.

Starter enables ZIP code maps, radius maps, and heat maps. If Starter users discover that optimized vehicle routing, downloadable business listings, or service and sales territories are required, they must upgrade to MapBusinessOnline Standard.

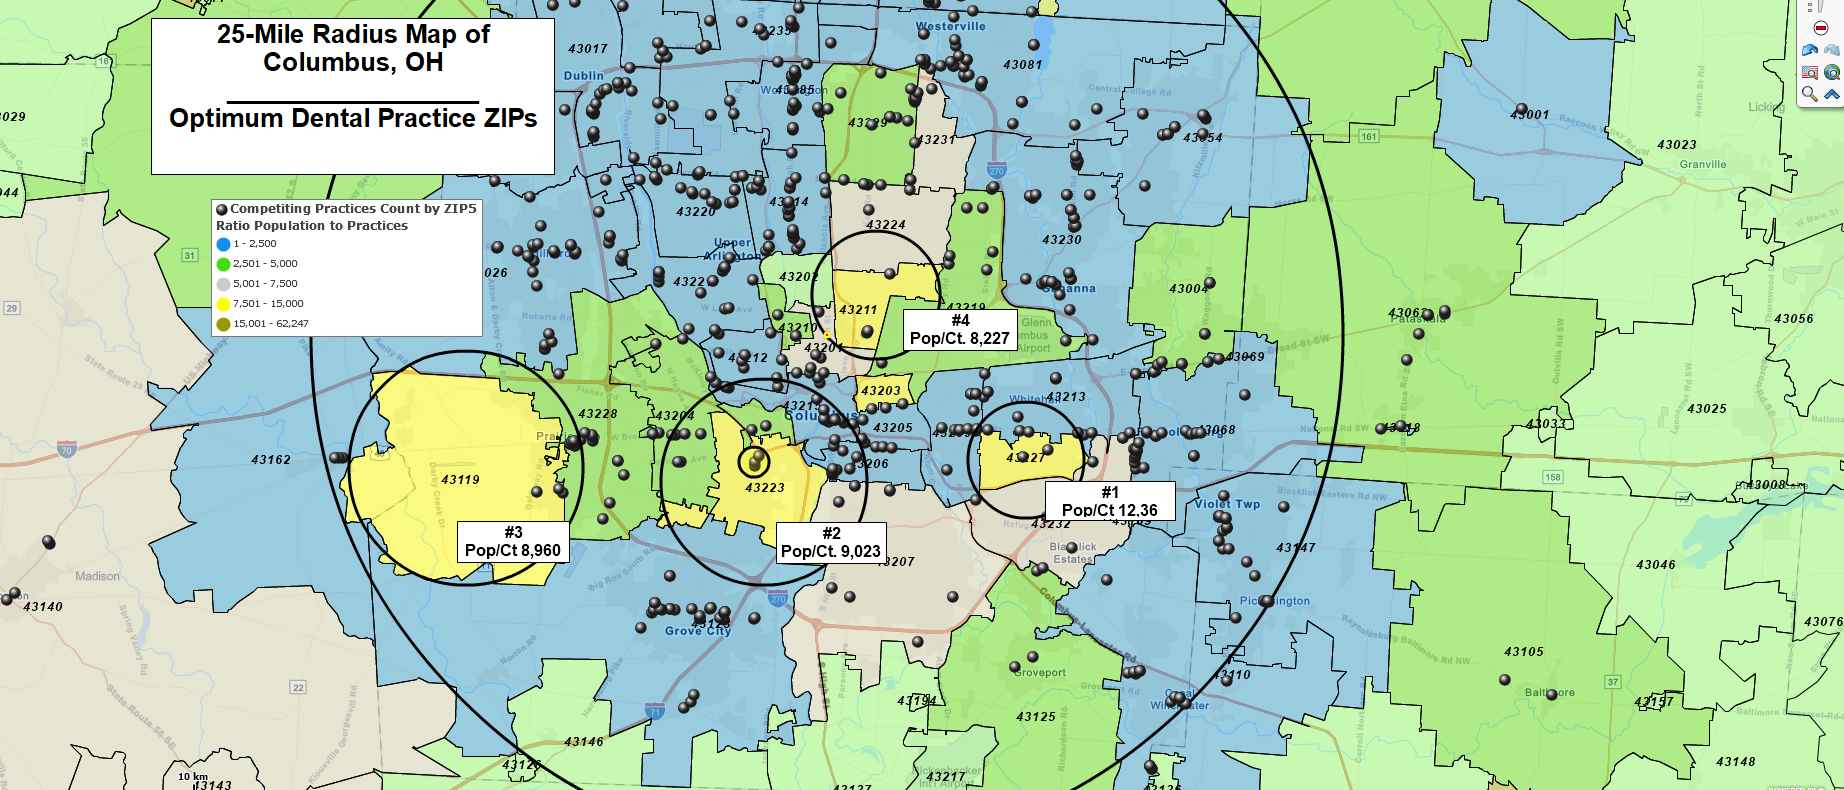
The top four best ZIP code candidates for a new dental practice in the Columbus, OH metro area.

MapBusinessOnline Standard continues to support business data imports of up to 50,000 location records per map and can support up to 50 sales, service, or franchise territories per map. Standard is MapBusinessOnline’s flagship offering and provides:

Elderly Congregate Home Dot Density Map.

MapBusinessOnline Pro provides advanced driving time and distance-enhanced analysis that more and more companies are applying to understand markets, transportation networks, and the impact of traffic patterns. Turn to MapBusinessOnline for mapping tools that include:

  • Advanced territory creation options, including multiple radius and drive time-based territory creation in one pass.
  • Append existing imported datasets with geographic and demographic columns.
  • Proximity analysis and find-the-nearest location selection for construction, business planning, and advanced business analysis and mapping.
  • Conduct batch calculation analysis, ZIP-to-ZIP, and origin-to-destination analysis.

The MapBusinessOnline Customer Success Team is always available for help with map use and subscription processing. Use the Contact button or the Chat option at MapBusinessOnline.com. Tell us about how you use business mapping software and what new features you’d like to have. We listen.

Start Free Now

Posted in Business Mapping Software blog post, Franchise Mapping, How to instruction, Press Release, Sales and marketing | Tagged , , , , | Leave a comment

MapBusinessOnline – the Drive Time Difference

MapBusinessOnline Standard and Pro versions support driving time and distance spatial queries. But Pro provides advanced analysis across all points in one or two large location datasets. This capability opens up a unique set of features for MapBusinessOnline Pro users.

Mapping software has come a long way since the advent of GPS and Google Maps. It’s hard to remember when we couldn’t find directions to a venue or explore a hiking trail online and on our phones.

Cloud-based business mapping software, extending the functionality of tools like MapPoint, Streets & Trips, Delorme’s Street Atlas, and ESRI GIS titles, have enabled small and large businesses to affordably generate compelling map visualizations, territory maps, and optimized vehicle routes that, in many cases, are significantly improving business operations and opportunities.

In 2010, MapBusinessOnline leveraged the abovementioned capabilities, offering an affordable solution for easy-to-use business mapping via the Cloud to almost any business seeking value from location-based services.

A few years later, we took it a few steps further.

MapBusinessOnline published a state-of-the-art territory creation and management system to pick-up where Microsoft MapPoint left off. MapBusinessOnline territory management supports sales organizations, service industries, and franchise businesses. Territory functionality remains at the core of our business offering. Today’s MapBusinessOnline territory tools include:

  • An easy-to-use import or point-and-click territory creation process.
  • Hierarchical territory creation by spreadsheet import for easy and fast creation of territories, regions, and divisions in one easy import.
  • Territory datasheet views for territory balancing, market analysis, and analysis of associated business data. Great for balancing with territory assignments.
  • A comprehensive US Census (and Canada) demographic library for territory balancing and market analysis.
  • Overlap identification for non-overlapping franchisee and sales representative assignments.
  • Easy-to-use territory editing tools because territories shift constantly.
  • No cost, view-only, territory sharing for field service access to territory assignments and sales strategies.
  • Color-coding capabilities for geographies and imported location symbols, supporting advanced map visualizations and the development of compelling presentations.

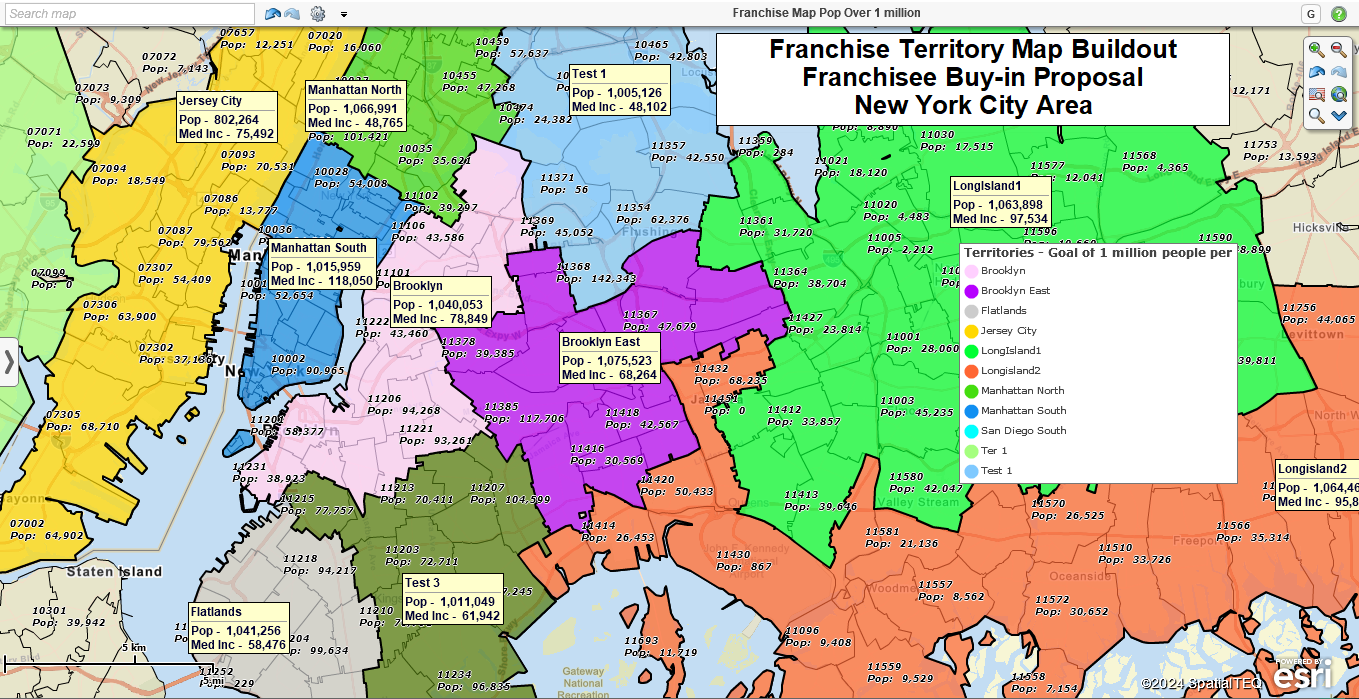
Franchisee territory map based on ZIP codes and population sums of 1 million.

All of this functionality comes at an affordable price and is every bit as easy and intuitive as MapPoint was. MapBusinessOnline technical support is second to none. Most MapBusinessOnline clients conduct some level of territory mapping in their work, from basic regional ZIP code territory map creation to the import of nationwide hierarchical territory systems.

Driving Time and Distance Capabilities

While MapBusinessOnline Standard has included driving time and distance spatial search support for quite a few years, one of MapBusinessOnline’s most recent and powerful innovations has been adding driving time and distance analysis for advanced users. These multi-dataset comparison tools are included in MapBusinessOnline Pro.

MapBusinessOnline Pro is an advanced tool. The core functions involve geographic queries across large datasets that can take a little longer to process—for instance, running a transportation network analysis to estimate driving distances and times between all points in two hefty location datasets. This functionality can be called a ‘Batch Calculate Distance or Times’ process. Clients use this tool to build travel expense estimates for delivery systems and outside sales forces or to conduct ZIP-to-ZIP analysis. Another term applied to the batch calculate process is Origin-destination Analysis.

MapBusinessOnline Pro also provides proximity searches for marketing and sales analysis. Find the nearest optimal site location for new retail stores or determine the demographic stats for areas surrounding a set of proposed retail centers.

Consider the combination of MapBusinessOnline tools supporting your location-based needs. For instance:

  • Conduct spatial searches for imported location and demographic data—search by radius, drive time polygon, or ZIP codes.
  • Create multiple drive time territories in one pass. Import your field technician’s home addresses and create multiple driving time-based territories in seconds.

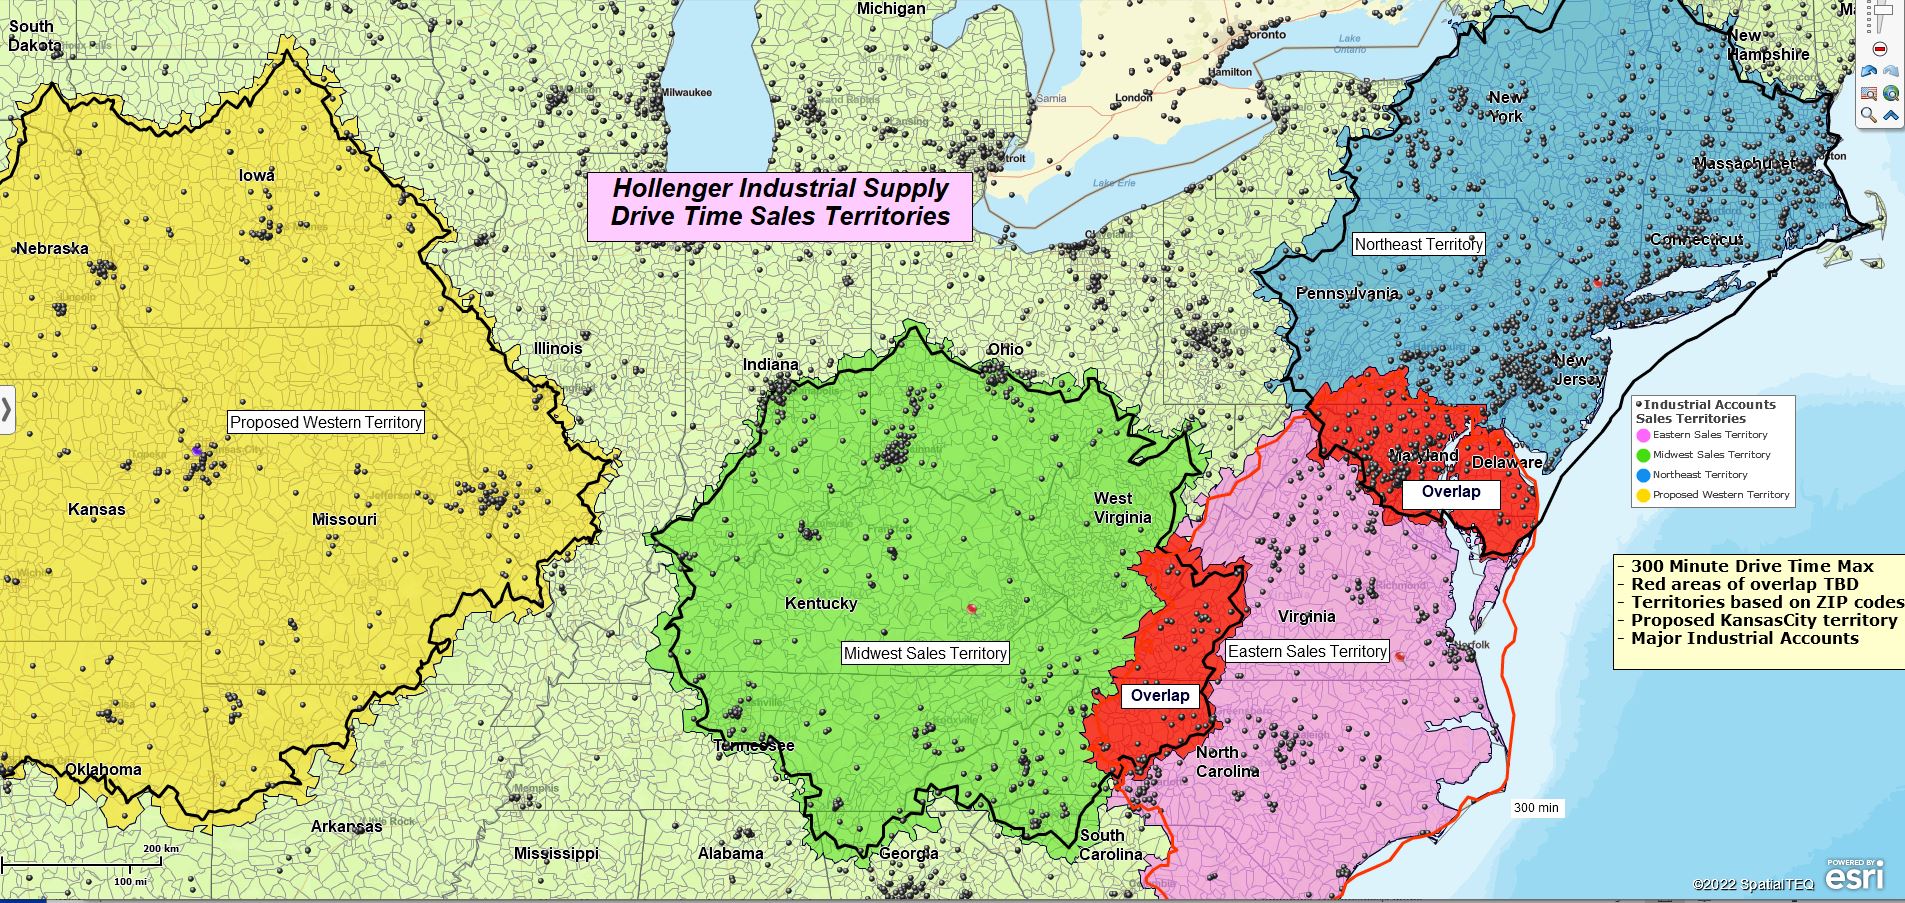
Multiple driving time or distance territory creation.

  • Create nationwide or regional franchise, sales, or service territories that establish clear demarcation lines and provide balanced workloads or value criteria.
  • Analyze multiple bank branch locations to examine progress and risks among existing investments, loans, or construction projects.
  • Determine the most lucrative geographic areas for potential expansion by comparing existing successful ZIP code demographics to similar cities elsewhere.
  • Generate sales leads by uploading business listings using MapBusinessOnline’s business listing search engine—prospect based on known demographic and geographic success.
  • Combine imported business analysis spreadsheet with included demographic data and geographic layers such as ZIP codes or counties.

The possibilities are endless.

Drive Time Territories created using MapBusinessOnline.

We just wanted to reach out and emphasize that MapBusinessOnline offers the driving time difference – driving time and distance queries – which differentiates us from the competition. Not only can you create compelling map visualizations with drive time-based polygons, but you can create driving time and distance and demographic analyses of your areas of interest. That is a powerful combination because driving distances and demographic characteristics depict human activities in a variety of impactful ways.

No other business mapping service provides these features at these affordable price levels.

Go toMapBusinessOnline.com and sign up today.

View a comparison of feature sets for both MapBusinessOnline Standard and Pro here. Or

Request a Web Demo

Posted in Business Mapping Software blog post, Franchise Mapping, How to instruction, Sales and marketing | Tagged , , , , , , , , | Leave a comment

MapBusinessOnline – Your Portfolio of Map Projects


So, you are a new map creator. Congratulations! Or perhaps you’ve been creating maps for your business or several businesses for some time now. Have you established a regular workflow for your business mapping projects? It’s worth thinking about for several reasons:

  • Map project requests will often require the same or similar map solutions used on previous maps, which means you could leverage work you’ve already accomplished toward a new map project.
  • Often, it’s a good idea to stop working on a map project and walk away for a day or so. Returning to the project with fresh eyes can reveal new pathways to success. Remember, maps are a visual medium.
  • Carefully save your map projects within MapBusinessOnline using the Save button on the Master Toolbar. The Save function provides a portfolio library for your occasional review.

Radius-based territory mapping for business expansion planning.

Any map project, like other work or even home projects, will entail a series of steps to completion:

  1. Gather the requirements for your map project.
    1. Establish the goal of the map project. What business problem or process does it address?
    2. How will your project be measured? What measurement criteria will indicate that the map project is successful?
    3. What location data sources are available to support your map project, and where are they located? All map projects need location data. That’s how maps convey meaningful and relevant ideas. Make sure you have access to the necessary files.
  2. Understand your map project audience. Who will view and consider the map?
    1. Map projects reviewed by management or the executive office will impact your reputation. Keep this in mind as you develop your map project.
    2. Consider the map’s audience as you develop the project. Keep the map focused, uncluttered, easy on the eyes for executive team presentations, and well spell-checked.
  3. Decide what business or organizational topics are best presented by a business map.
    1. Review collected location data and all the associated data columns to determine which datasets import well and provide a relevant story or path to a solution via a map presentation.
    2. Determine which administrative map layers best support the map story – ZIP code, City Limit, County, or others.
    3. Are there saved map projects that approximate the project you’re about to create? If there are, open them, save them under a new filename, and proceed.
  4. Consider the ancillary datasets available within MapBusinessOnline that may be able to add value to your map project:
    1. USA Census Bureau demographic data.
    2. Business listings.
    3. Point ZIP code data.

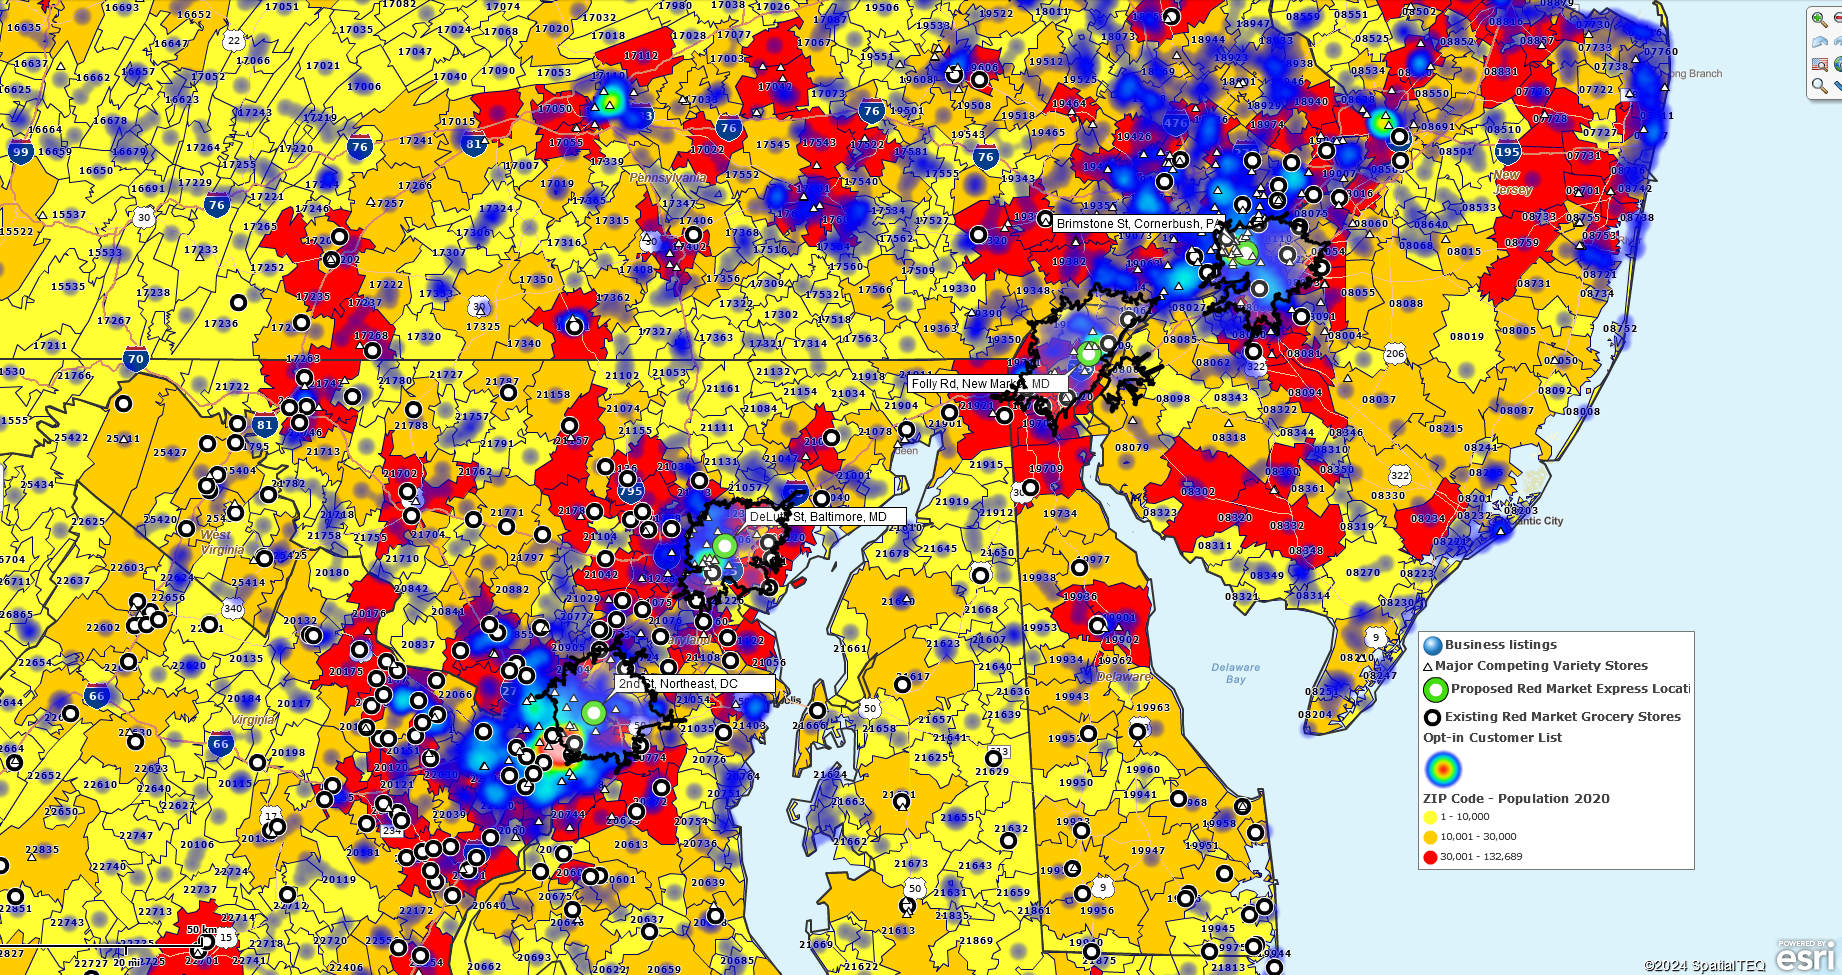
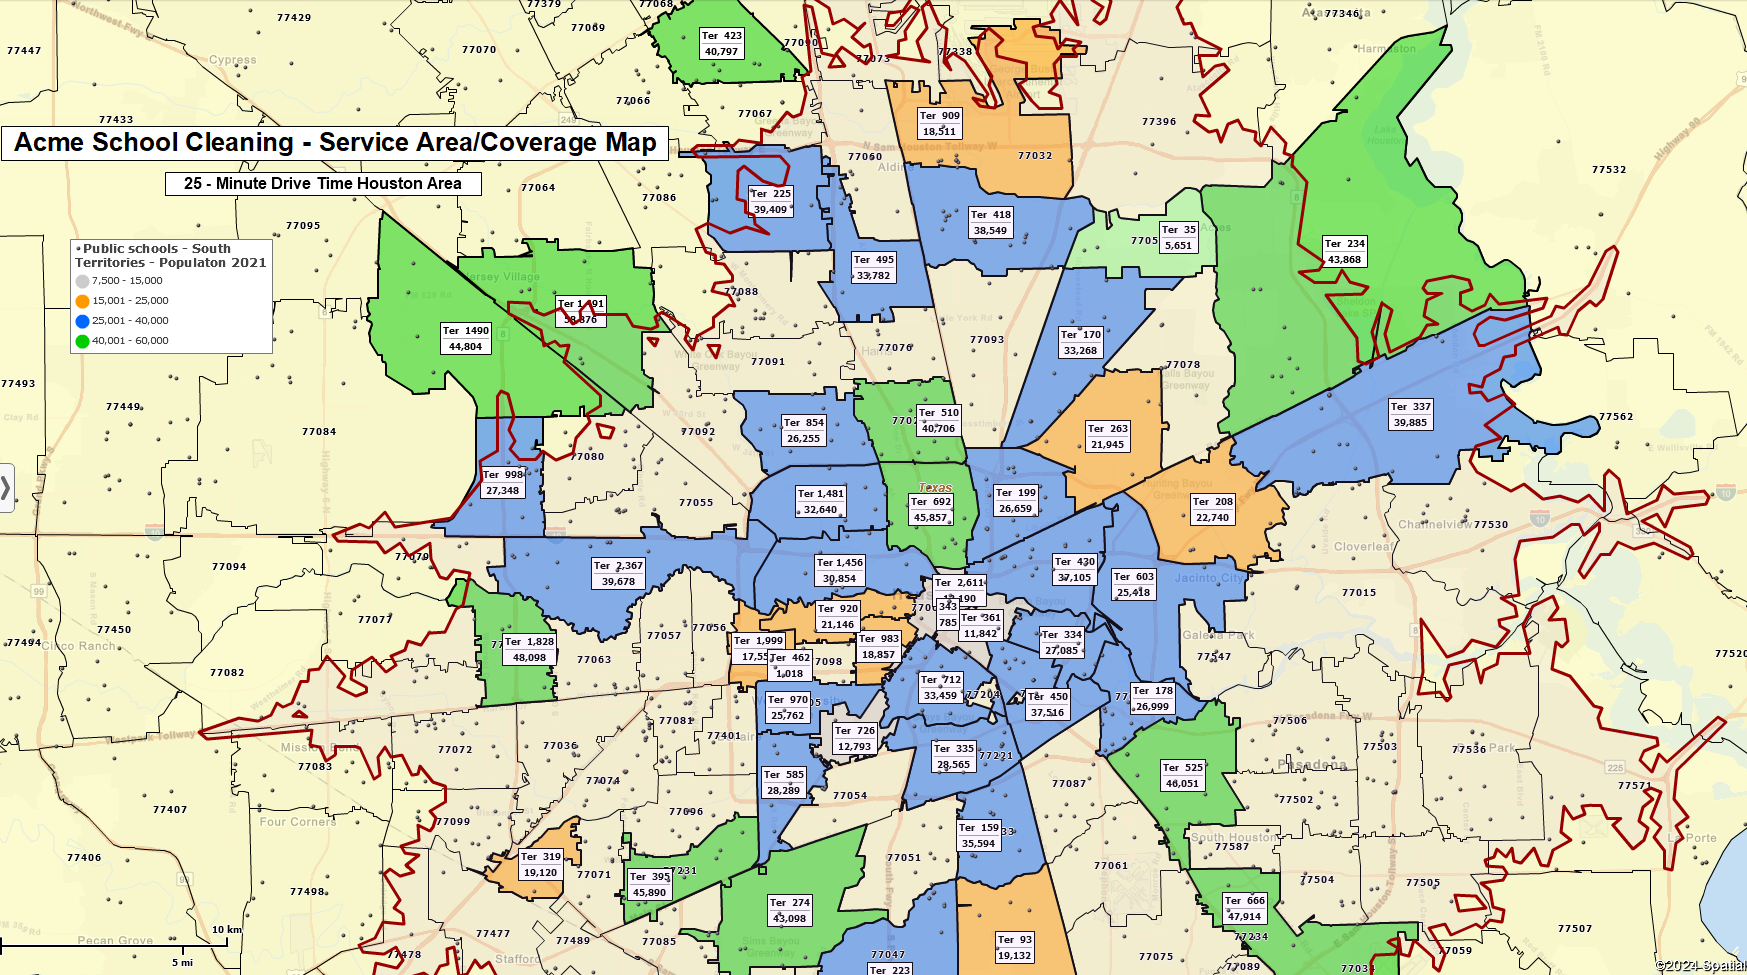
A service territory coverage map created using MapBusinessOnline.

Optimizing Your Map

Once you’ve imported your datasets over the map view, you can start honing your map to match the task. Create a first-pass MapBusinessOnline map with imported location datasets. Match the business map layers with your understanding of the problem or situation the map is supposed to address. Remembering the goal of your map project, look at the data layers. Ask yourself, do all the imported datasets add value to the map? Which datasets are critical to supporting the map’s intent?

MapBusinessOnline’s Map and Data box shows all your imported datasets and map layers. You can check off imported datasets and map layers one at a time. Find the datasets and map layers most critical to your map’s intent. Turn the other layers off. The map creator can always turn datasets and layers on to answer questions or make points.

Are the map layers you’ve selected relevant to the problem? For example, if you are exploring the reasons for repeated late deliveries to certain ZIP 3 codes, you probably do not need to show ZIP 5 codes or Counties on the map. Turn off the layers you do not need.

Generally, two map layers are enough to support a business map. Usually, ZIP 5 Code and State layers are turned on. Depending upon the distribution of your data, ZIP codes and City Limits can be applied. Do this judiciously. Only use map layers and datasets that add value to the presentation.

MapBusinessOnline provides the map creator with controls over the look and feel of the map. Map creators can adjust the following:

Map Layers – ZIP code, City Limit, County, State.

  • Fill – On/off, color.
  • Line – On/off, thickness, color.

Symbols

  • Symbol – Symbol option, color, size.
  • Heat map – Weather map intensity area based on numeric values.
  • Circles with numbers – Circle color, size, and numeric value.
  • Charts – Use chart or graph-style symbolization.

Learn more about adjusting the map look and feel.

Identifying the top four best areas by ZIP code for a new dental practice in suburban Columbus, OH.

Saving Your Map Project

Over time, you will generate more business map projects for your organization. You must keep your map projects saved and organized.

Remember to save your map project with a name that describes the purpose or geographic design. Some examples of descriptive project save names:

  • CongressionalDistrictPopulation2024
  • ZIP3MailAnalysisHomeDepot
  • CountyHHInc2023MADeputyAssoc

When creating a new map project, it is a good idea to review your previous work to see if there are similar projects you can leverage.

If you find a previous map project that might fit your latest project, open the map file and save it under a different name. Remove previous datasets and import relevant data. Now, start optimizing your map project to your liking.

When you near completion of your map project, keep these final steps in mind:

  • Ask a trusted associate to review your map work.
  • Do a final spell check. Remember to look at map titles, the saved map name, and any text boxes you’ve placed on the map.
  • Save your map project as a My Template in the MapBusinessOnline save option. Saving the map in the My Template folder will prevent you from overwriting, deleting, or sharing the map inadvertently.

Think of MapBusinessOnline as your geographic project portfolio. And think of yourself as a certified map geek – which is an excellent thing!

Request a Web Demo.

Posted in Business Mapping Software blog post, Franchise Mapping, How to instruction, Sales and marketing | Tagged , , , , , , , , , , , | Leave a comment

For New Subscribers to MapBusinessOnline.com

MapBusinessOnline is an interactive geographic web map of the United States or Canada. It allows map subscribers to overlay relevant map layers and create business map models that describe their particular business systems.

Business models include sales territories, franchise territories, customer maps, prospect maps, market analysis, expansion planning maps, and field service maps.

Designed to improve upon the Microsoft MapPoint user interface, MapBusinessOnline is easy to use and has provided thousands of professionals with affordable access to business mapping software. To get started, import your location datasets (address or latitude/longitude data) into the mapping application. Here’s another helpful resource for map creation using MapBusinessOnline.

A franchise territory map balanced by Census Bureau population data.

Example industries that regularly use MapBusinessOnline include:

  • Construction – Site planning, job site monitoring, and vehicle routing.
  • Franchise businessesFranchisee territory planning, sales planning, and franchise mapping.
  • Healthcare – Field clinician mapping, hospital systems planning, and healthcare market analysis.
  • Hi-tech – Field service territory mapping, market analysis, and expansion planning.
  • Insurance businesses – Sales mapping, territory mapping, market analysis, and field claims mapping.
  • Manufacturing – Sales mapping, territory management, hierarchical territories, and expansion planning.
  • Large and small Retailer – Marketing campaign management, territory mapping, and expansion planning.
  • Sales & Marketing – Territory management, marketing campaign tracking, and map visualizations.

Additional map layers available to MapBusinessOnline map creators include:

  • Client location data – customer and prospect address lists, patient address lists, store locations, and many other business location-enabled datasets.
  • Optional additional map layers – ZIP codes, counties, states, city limits, and Census tracts.
  • Ancillary datasets – Census Bureau demographic data, Business Listings, and calculated data sets generated within MapBusinessOnline from other datasets.

Imported location data points can be converted to optimized vehicle routes with up to 150 stops per route. They can also be used to create customer map visualizations that visually describe where customers are located and their point density across a larger map view.

Territory Mapping Support

MapBusinessOnline sales, franchise, or service territories are created from map layers – ZIP codes, counties, city limits, or states. Territory mapping support includes:

  • Territory spreadsheet import.
  • Territory creation by on-map selection.
  • Hierarchical territory support – Regions, Divisions, Zones.
  • Territory overlap controls.
  • Territory balancing functions.
  • Export ZIP codes segmented by territory.

Basic How to Videos

Click here for a quick recorded MapBusinessOnline web demonstration. For a live demonstration, possibly using your business data, contact MapBusinessOnline here.

Resources for learning about MapBusinessOnline and how to create effective business maps are listed below:

Contact us options:


Read reviews and view MapBusinessOnline comparisons on G2:


Posted in Business Mapping Software blog post, Franchise Mapping, How to instruction, Sales and marketing | Tagged , , , , , , , , | Leave a comment

How Location Data Supports Market Analysis

Location data is rapidly becoming an indispensable analysis resource for large and small businesses. MapBusinessOnline enables the import of any industry’s location-based data. As long as the data includes a column(s) for location, you’re good – address, latitude/longitude, or other geographic fields. Just import your data and play with symbolization and color-coding tools on a business map.

A case in point is a billboard advertising business’s requirement for traffic data. Many of you reading this blog haven’t considered who is responsible for setting up billboards along a major highway and how they do it. Well, don’t feel bad, neither did I.

Multiple clients have used our business mapping software to support billboard marketing. Recently, a billboard management client requested that we help them import a dataset of points representing traffic concentrations along a major highway.

Our billboard marketing client, armed with a shapefile dataset showing traffic history along a significant corridor, sought to determine where the highest traffic locations happen. This data would represent the highest number of potential human eye views that could perceive the proposed billboard advertising. Their simple data story is a testament to the power of location-based data in marketing.

Traffic data is available through city and state road and highway maintenance agencies. Usually, these agencies have a GIS employee or group that manages geographic data collection. That data is often deployed in shapefile format. Not all business applications can ingest shapefile data pulls. Thus, MapBusinessOnline required conversion to Excel to access the data points by latitude and longitude coordinates.

Upon receipt, our sales team leader, Jason Henderson, reviewed the data and sent the shapefile to our technical team for conversion into an Excel spreadsheet. With the data now importable into MapBusinessOnline, Jason suggested they visualize the information based on the data collection station columns within the Excel sheet. The client map user imported the location points, which geocoded the latitude and longitude coordinates onto the state of North Carolina within a MapBusinessOnline North America map.

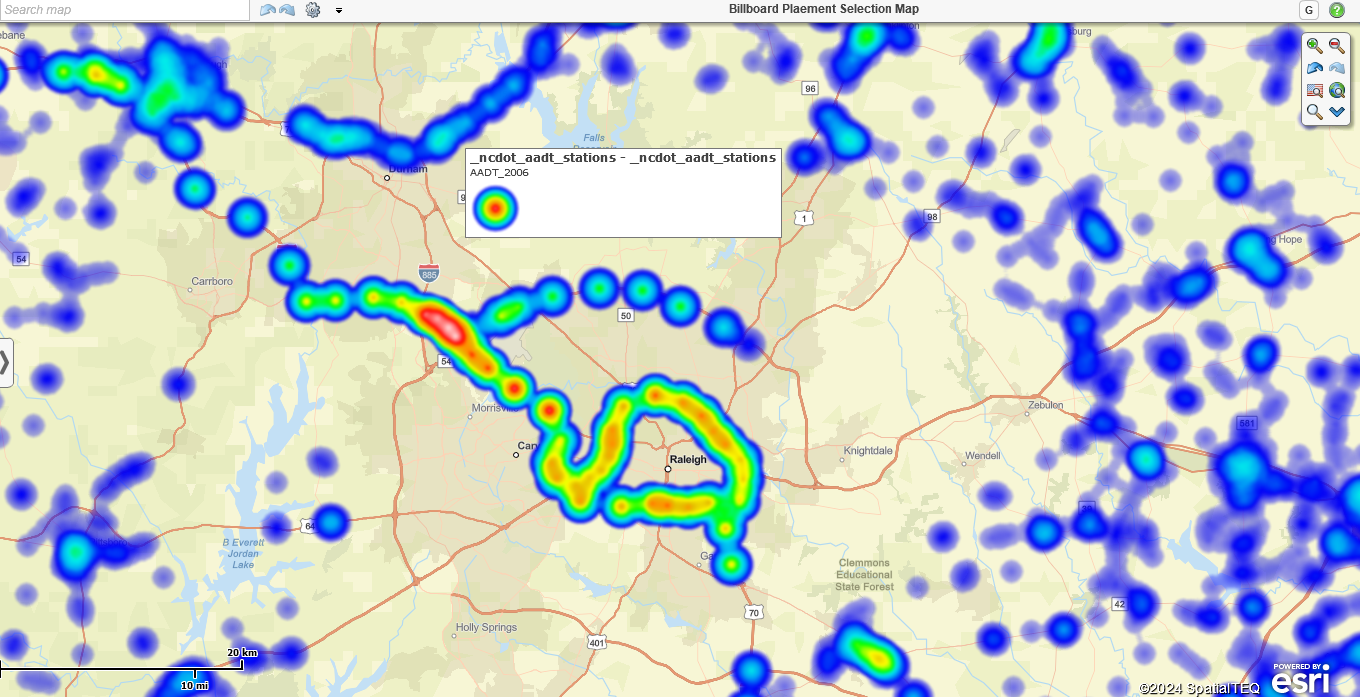
The MapBusinessOnline user used MapBusinessOnline heat map tools to transform the map display into a heat map showing point densities at station collection points where passing traffic was most highly concentrated. Because there were roughly 45,000 latitude-longitude points to plot, the data fit nicely into MapBusinessOnline Standard, which enables up to 50,000 location points per map.

y data

This heat map shows concentrations of collected data points along a highway.

For imports of up to 250,000 records and for more advanced driving time and distance queries, upgrade to MapBusinessOnline Pro.

The Process for Visualizing Collected Location Data

Unfortunately, MapBusinessOnline does not support shapefile import. However, a GIS or IT specialist can convert the data to a point dataset in CSV or Excel formats. Armed with this standard spreadsheet, the MapBusinessOnline user can easily import the location data through typical data import processes.

  1. Along the Master Toolbar, under the Adding to Map section, click the Dataset Button.
  2. Navigate to your saved data file and select it for import.
  3. Follow the dialogue box options for geolocating the data in MapBusinessOnline.


With the converted point layer overlaid onto a MapBusinessOnline business map, there are multiple ways to symbolize, color-code, and view the map data layer:

  • A color-coded point layer, perhaps with varying symbol sizes and colors.
  • A heat map dot-density map view that shows the dot concentrations in high-density areas.
  • A heat map weather-map view shows hot or cold activity based on numeric data.
  • Numbered circles of varying size and color.
  • A ZIP code map with a color-coded scheme based on coordinate densities within each ZIP code.

The marketing client will consider traffic data collection densities when determining the optimum placement for billboards.

There could be other non-municipal uses for the side of the highway traffic data:

  • Retail and service station potential site location analysis.
  • Rest stop, site location analysis.
  • Vehicle breakdown location analysis for call boxes.
  • Endangered species protection analysis.

Marketing users of MapBusinessOnline also have territory-creation tools at their disposal. Marketing and sales professionals apply dot density maps, like the above-described billboard map, to study areas of interest or territories for sales groups or field technicians. Territory analysis is used to research billboards and other marketing initiatives – results vs. investment.

Look for available location datasets relevant to your industry.

Request a web demo.

Posted in Business Mapping Software blog post, Franchise Mapping, How to instruction, Sales and marketing | Tagged , , , , , , , , | Leave a comment

The MapBusinessOnline Territory Mapping Solution

MapBusinessOnline is perhaps best known for its territory mapping capabilities. These capabilities are fundamental sales and marketing tools for hundreds of thousands of businesses worldwide, including franchise, sales, and service organizations.

Many old-timer clients compare the capabilities of MapBusinessOnline territory management to those of Microsoft MapPoint—a product Microsoft abandoned ten years ago.

MapBusinessOnline stands out among business mapping software by integrating database management with handsome geographic map views and location-based data analysis. This unique combination of powerful data visualization tools makes it a wise investment for any sales and marketing or general business professional.

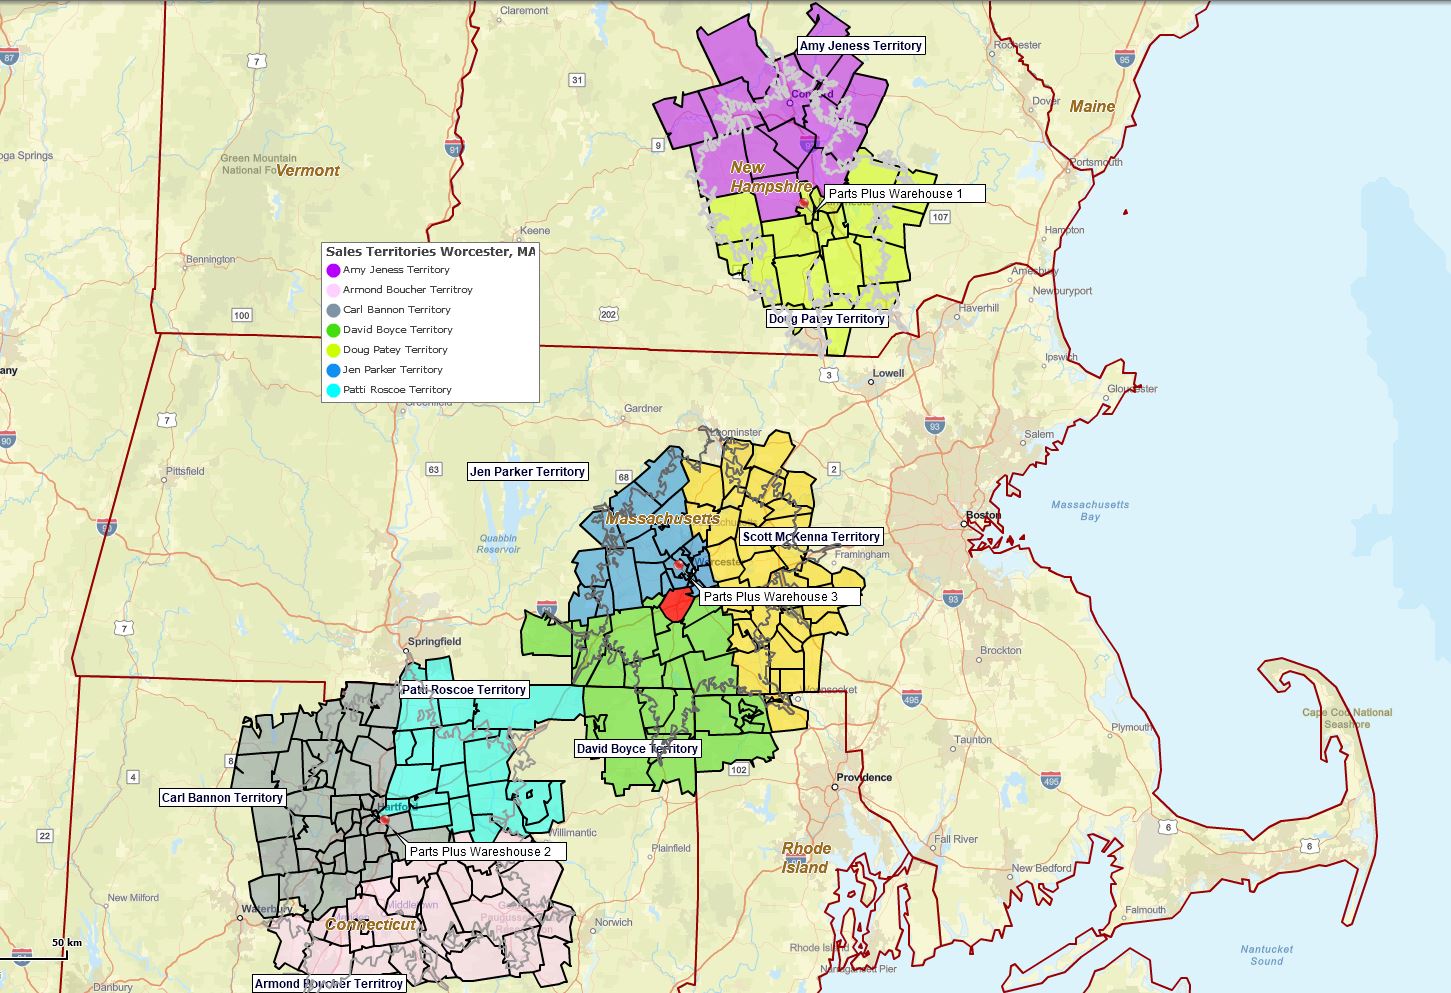
Three ZIP code-based drive times territories created using MapBusinessOnline.

Territory mapping users apply these location-based tools to many specific applications, including:

  • Franchisee territory map development for area definition and contractual records.
  • Field staff management for sales, clinical, homecare, and service industries.
  • Market analysis in support of business expansion.
  • Sales planning, forecasting, and sharing maps for business meetings.
  • Support nationwide businesses with hierarchical territory maps for nationwide conglomerates.

Common

When map creators launch MapBusinessOnline territory mapping tools, they tend to do the following:

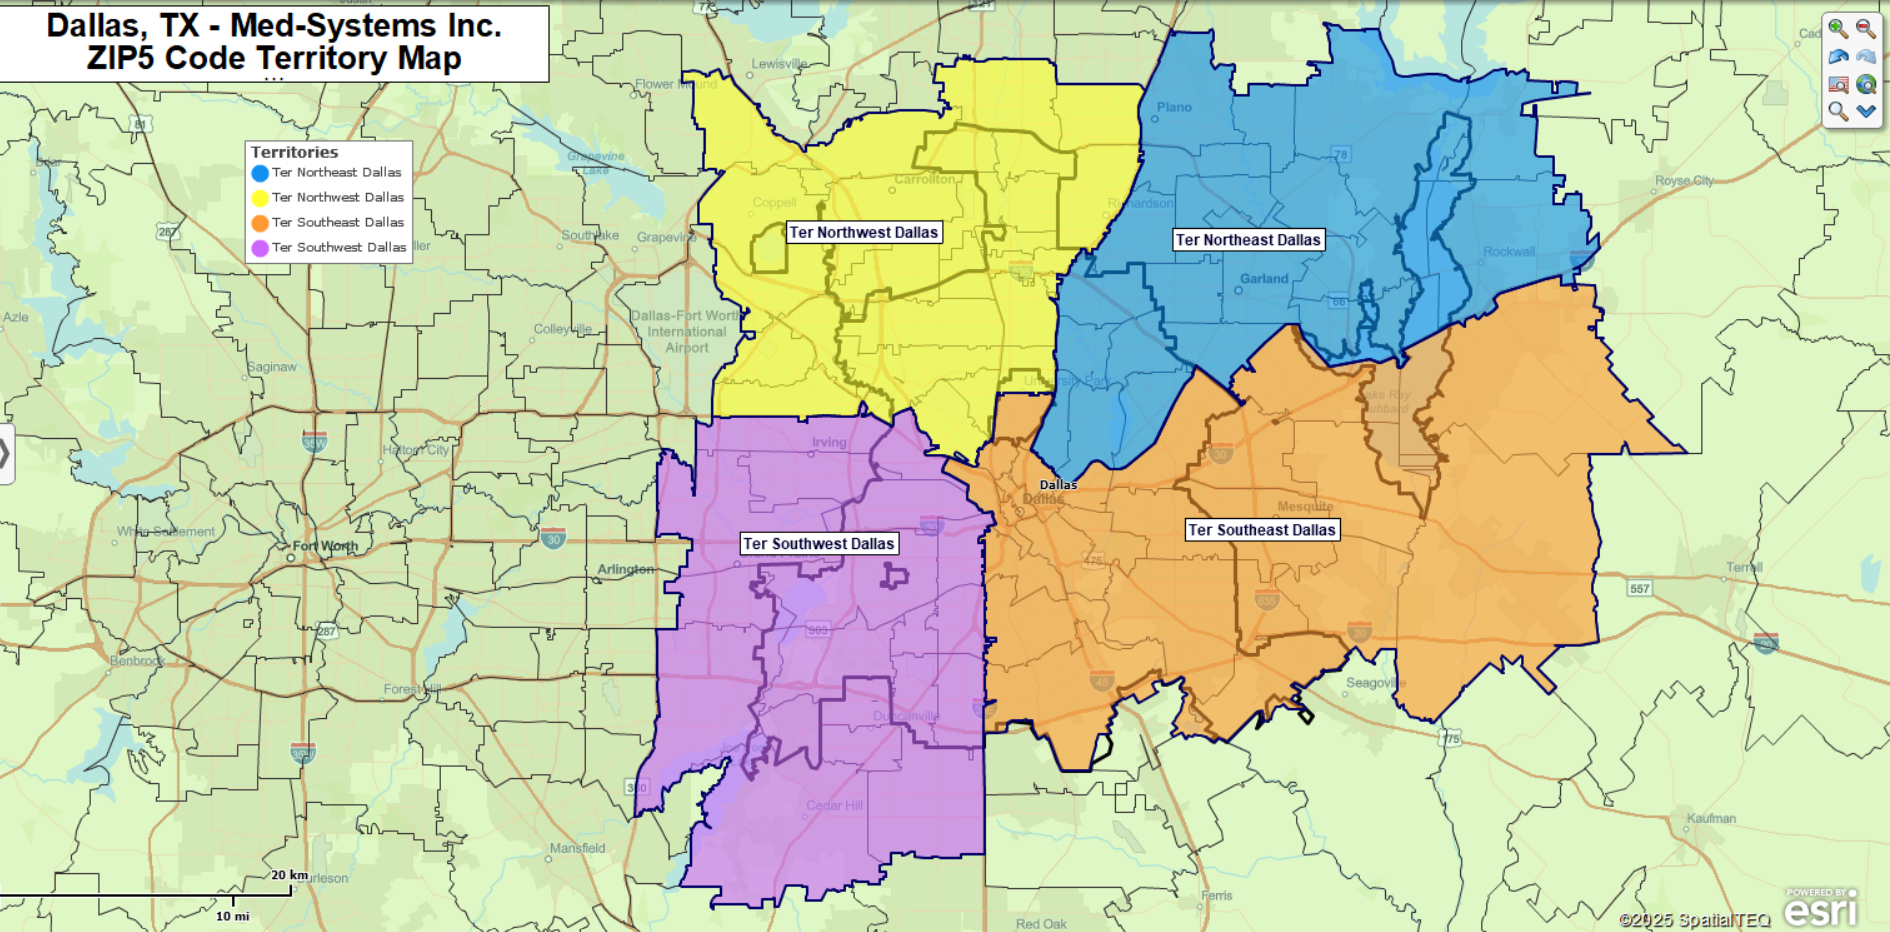
Build a ZIP code territory map of their area of interest – Map creators are generally more comfortable with ZIP code map layers for territory map creation. ZIP codes provide the geographic granularity required to manage their operations, especially for more regional and local businesses like franchise organizations and home care agencies. Multi-state territories do occur, but business life is often more complex than a state map layer allows at a geographic level. Learn more here.

Overlay imported customer or patient data—It is easy to import an address or latitude-longitude spreadsheet onto a MapBusinessOnline territory map. Customer layers add a visual component to the territory map and a datasheet view where customer locations can be geographically associated with other relevant data columns. Learn more about customer maps.

Create a demographic layer on their territory map. MapBusinessOnline includes access to the Census Bureau demographic data library for use within any business map. While the category options are extensive, territory map creators tend to pull from certain data types—population, income, ethnicity, and consumer expenditures are among the most popular. Learn more here.

Search for business listing sales leads to supplement existing customer locations – Prospecting for additional sales is a constant challenge for most companies. MapBusinessOnline lets the map user/creator search for new leads by business name, industry, ZIP code search, radius search, or polygon search. Fill in those canceled appointments or look for additional stops to fill out extended business trips. Learn more here.

Two New Key Features

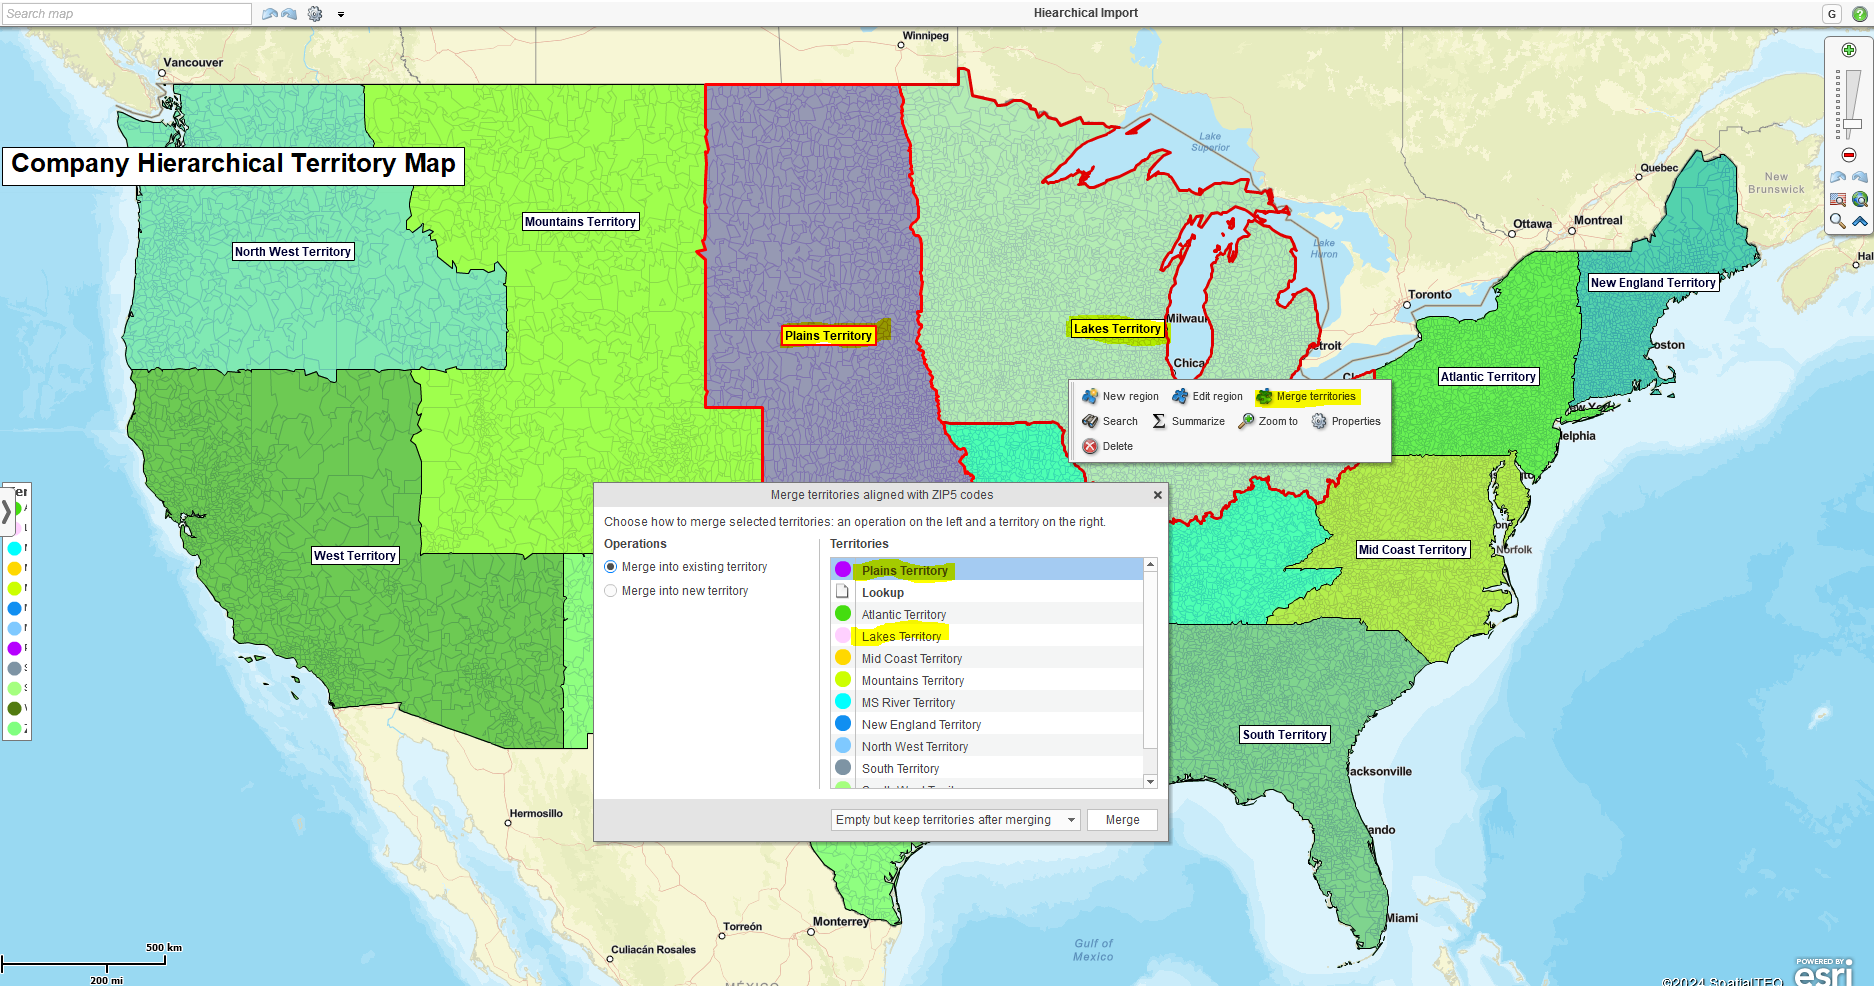
Merge Existing Territories in One Step—Merging two distinct territories is often required when editing territories. Now, MapBusinessOnline includes a one-step Merge option to help the map editor quickly combine territories and decide what happens to the original territory selection. Select the territories you wish to merge and select Merge Territories in the dialogue box. You can choose to keep the name on one territory or create a new territory with your selection.

Select territories and choose the Merge Territories option.

Import Hierarchical Territory Spreadsheets – Our most recent territory enhancement. Create tiered territory hierarchy spreadsheets and import Territories, Regions, and Divisions in one step. You won’t believe how easy it is once you create your scheme. Learn more here.

Other Territory Mapping Functions

Edit & Optimize a  Territory Map—MapBusinessOnline makes it easy to adjust the various visual components of an accurate territory map. Turn ZIP code and county layers on and off. Adjust layer transparency. Color-code the fill and boundary lines. Make your map more focused on critical elements such as core business targets.

Add additional data to Territory Map Labels – Sometimes, territory labels need to say more than just a name. MapBusinessOnline provides five flexible fields for territory labels, just like other map layer labels. Add imported numeric data or select demographic data to append to your territory labels. Additionally, there is a field for notes associated with every territory. Use the notes field to add information your constituents may require to do their job.

Share territory Maps with Constituents – Use MapBusinessOnline public map sharing to share view-only, pan-and-zoom interactive maps with constituents. They view, download data, and create routes, but they cannot edit the map. Learn more here.

Analyze a Target Market Area Using Territory Map Views – Using the territory map Data Window view map, creators can display the ZIP codes or Counties where they’ve been successful at selling. Add to this data view the demographic characteristics of those areas of interest, and a picture begins to take shape describing the most lucrative ZIP code types for certain products and services. Now, search the country for similarly populated sections and generate more business.

Additional Features Included in MapBusinesOnline’s Complete Territory Mapping Solution

  • Filter the map view by area, ZIP code, county, state, and other map layers.
  • Create optimized vehicle routes with up to 150 stops per route.
  • Build up to 50 territory maps (Standard) or 1500 territory maps (Pro.)
  • Color code geographic areas or imported location points.
  • Share low-cost interactive maps. Generate PDF, Jpeg, KML, or PNG image files.
  • Conduct advanced driving time and distance queries across datasets (Pro.)
  • Generate spatial searches of data by radius, polygon, or driving time search.
  • Export search results to CSV file – imported data, ZIP codes, demographic data, and business listings.

Request a Web Demo

Posted in Business Mapping Software blog post, Franchise Mapping, How to instruction, Sales and marketing | Tagged , , , , , , | 2 Comments

Import a Hierarchical Territory Map in Just a Few Steps

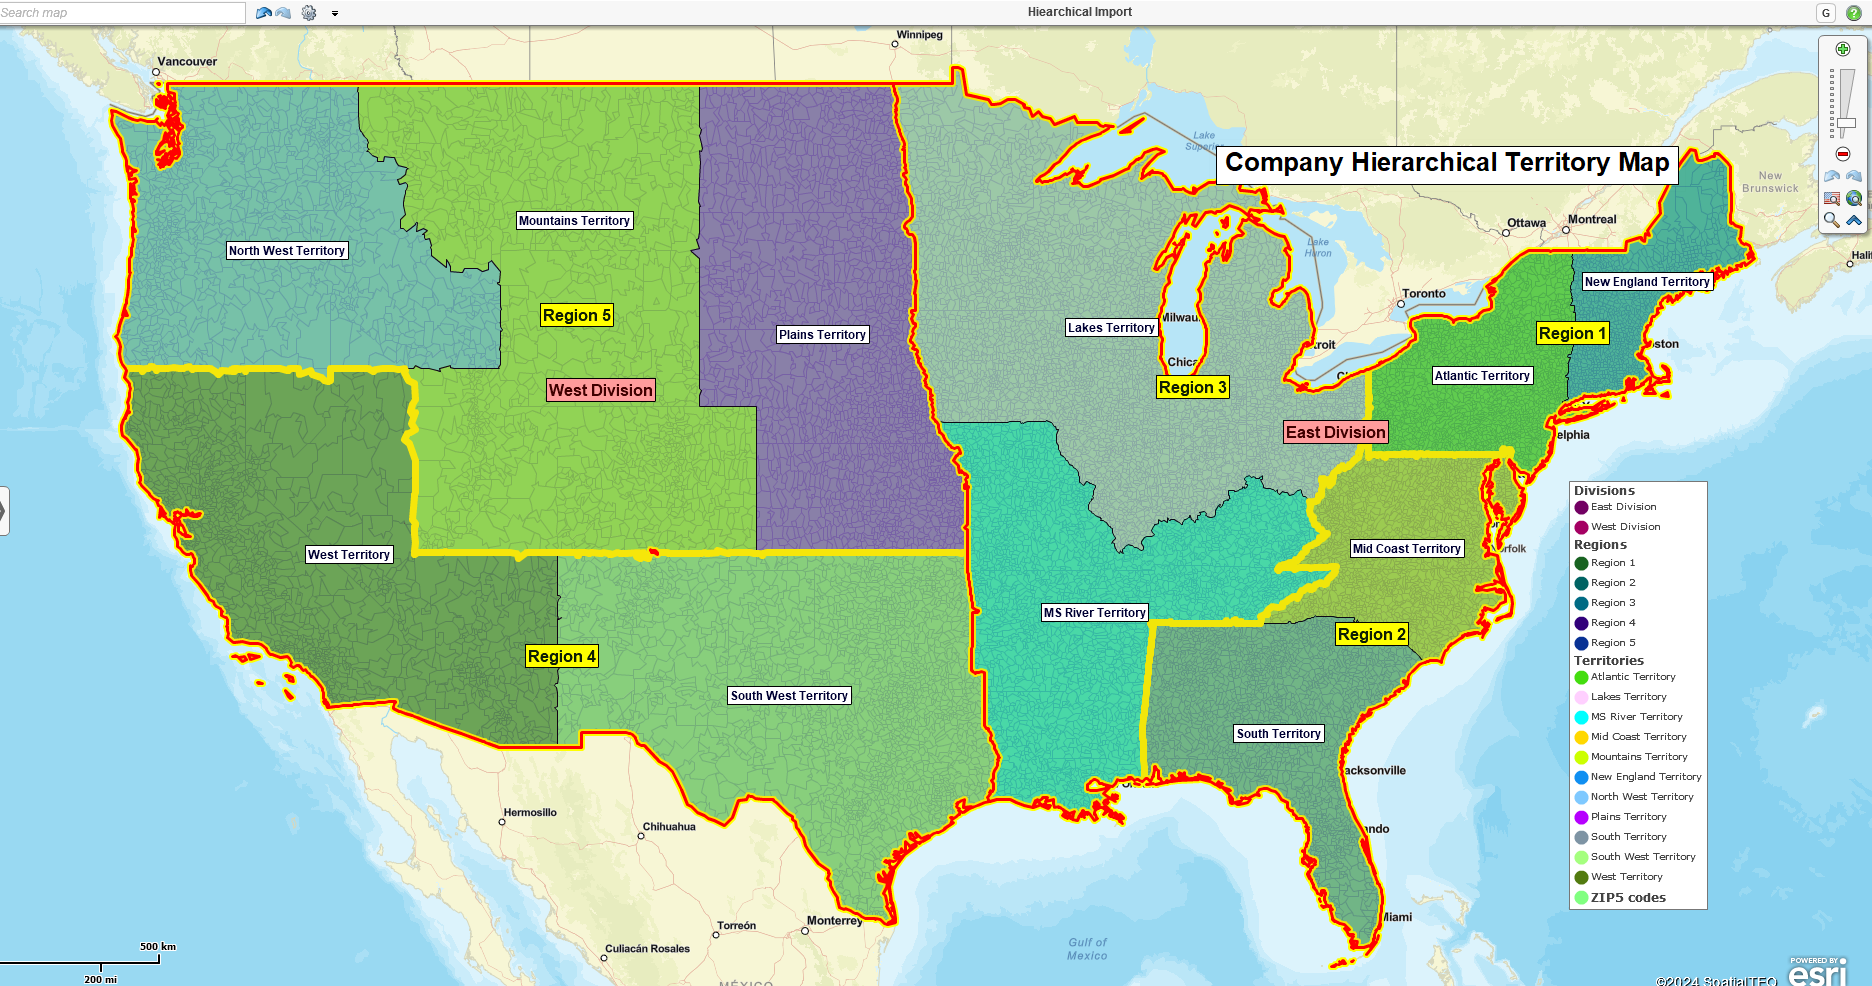
MapBusinessOnline announces a two-step hierarchical territory import process. Import and Assign your territories, regions, and divisions with just a few mouse clicks.

Users can easily import an Excel or CSV territory hierarchy file to create a full-tiered sales or service territory hierarchy.

MapBusinessOnline hierarchical territory support is not just a feature; it’s a game-changer. The tool provides territory mapping support for franchise, sales, and service businesses, efficiently organizing territory tiers over large geographic areas. This makes it an invaluable business tool, enhancing your sales and service management capabilities.

Territory hierarchies are most commonly applied to nationwide sales organizations.  These businesses support a network of sales professionals requiring several tiers of sales managers responsible for multiple regions of the country.

Usually, hierarchical territory structures represent geographic layers of management:

  • Territories – Individual salespeople are responsible for designated territory areas.
  • Regions – Regional managers are responsible for a group of territory managers.
  • Divisions – Vice presidents and directors manage a group of regional managers.

MapBusinessOnline territory mapping software is designed to accommodate varying management structure labels such as Zones, Areas, or Divisions. No matter how your business is structured or what labels describe your tiers, MapBusinessOnline has got you covered.

The Hierarchy Territory Process

The first step for hierarchy territory map users supporting a multi-tiered territory import process is creating a spreadsheet that reflects the desired territory, regions, and division assignments.  If you already have territory assignments in MapBusinessOnline, you can export those territories to a CSV file as a starting point. Learn more about territory export here.

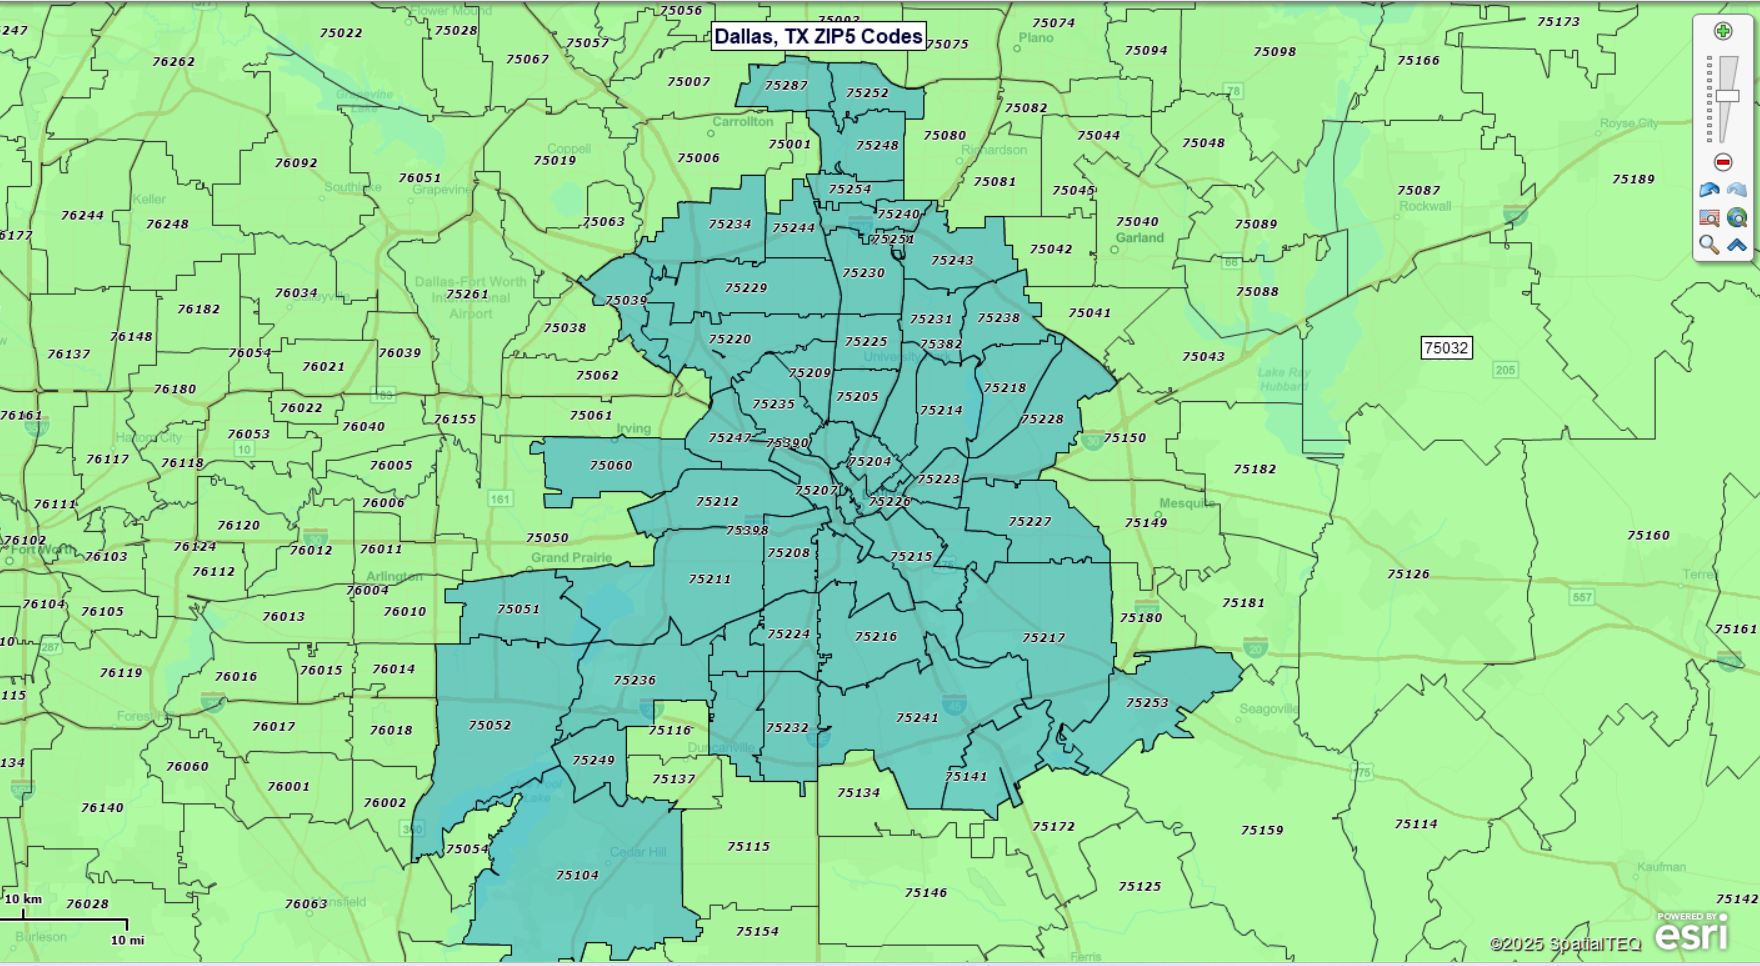
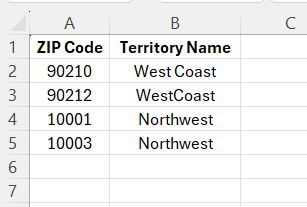
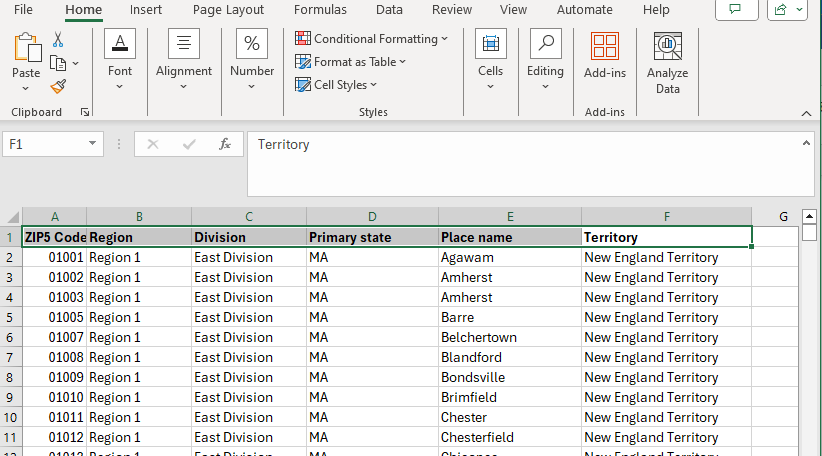
Below is a sample hierarchical territory spreadsheet section for your review.  This particular file is for a territory map based on ZIP codes.

Upon import, each ZIP code is automatically assigned to a territory (column F), region (column B), and division (column C.)

  • Required columns for a ZIP code-based hierarchy spreadsheet – ZIP code, Region, Division, Territory.
  • Required columns for a County-based hierarchy spreadsheet – County, State, Region, Division, Territory.

Import a Territory Hierarchy

Once you’ve imported a Hierarchical Territory spreadsheet into MapBusinessOnline, you will feel comfortable creating your territory hierarchy in just one or two steps. But for clarity, these are the steps with the various options included.

  1. On the MapBusinessOnline Master Toolbar, select the Territories button under Adding to Map.
  2. In the Create Territories dialogue, select Import Multi-level Territory Hierarchy.
  3. Navigate to your data spreadsheet. Select the data and click Next.
  4. A new pop-up appears called Create Territories—Territory Levels. Here, the process presents the hierarchy of territory levels or tiers about to be imported. The map creator has the option to uncheck any of the tiers about to be imported. Click Next or click directly on Create Territories.
  5. A Next click above presents a new Create Territories—Alignment Options pop-up. The user can change the alignment layer assignment and ignore point ZIP codes. In most cases, the map creator will click Create Territories.
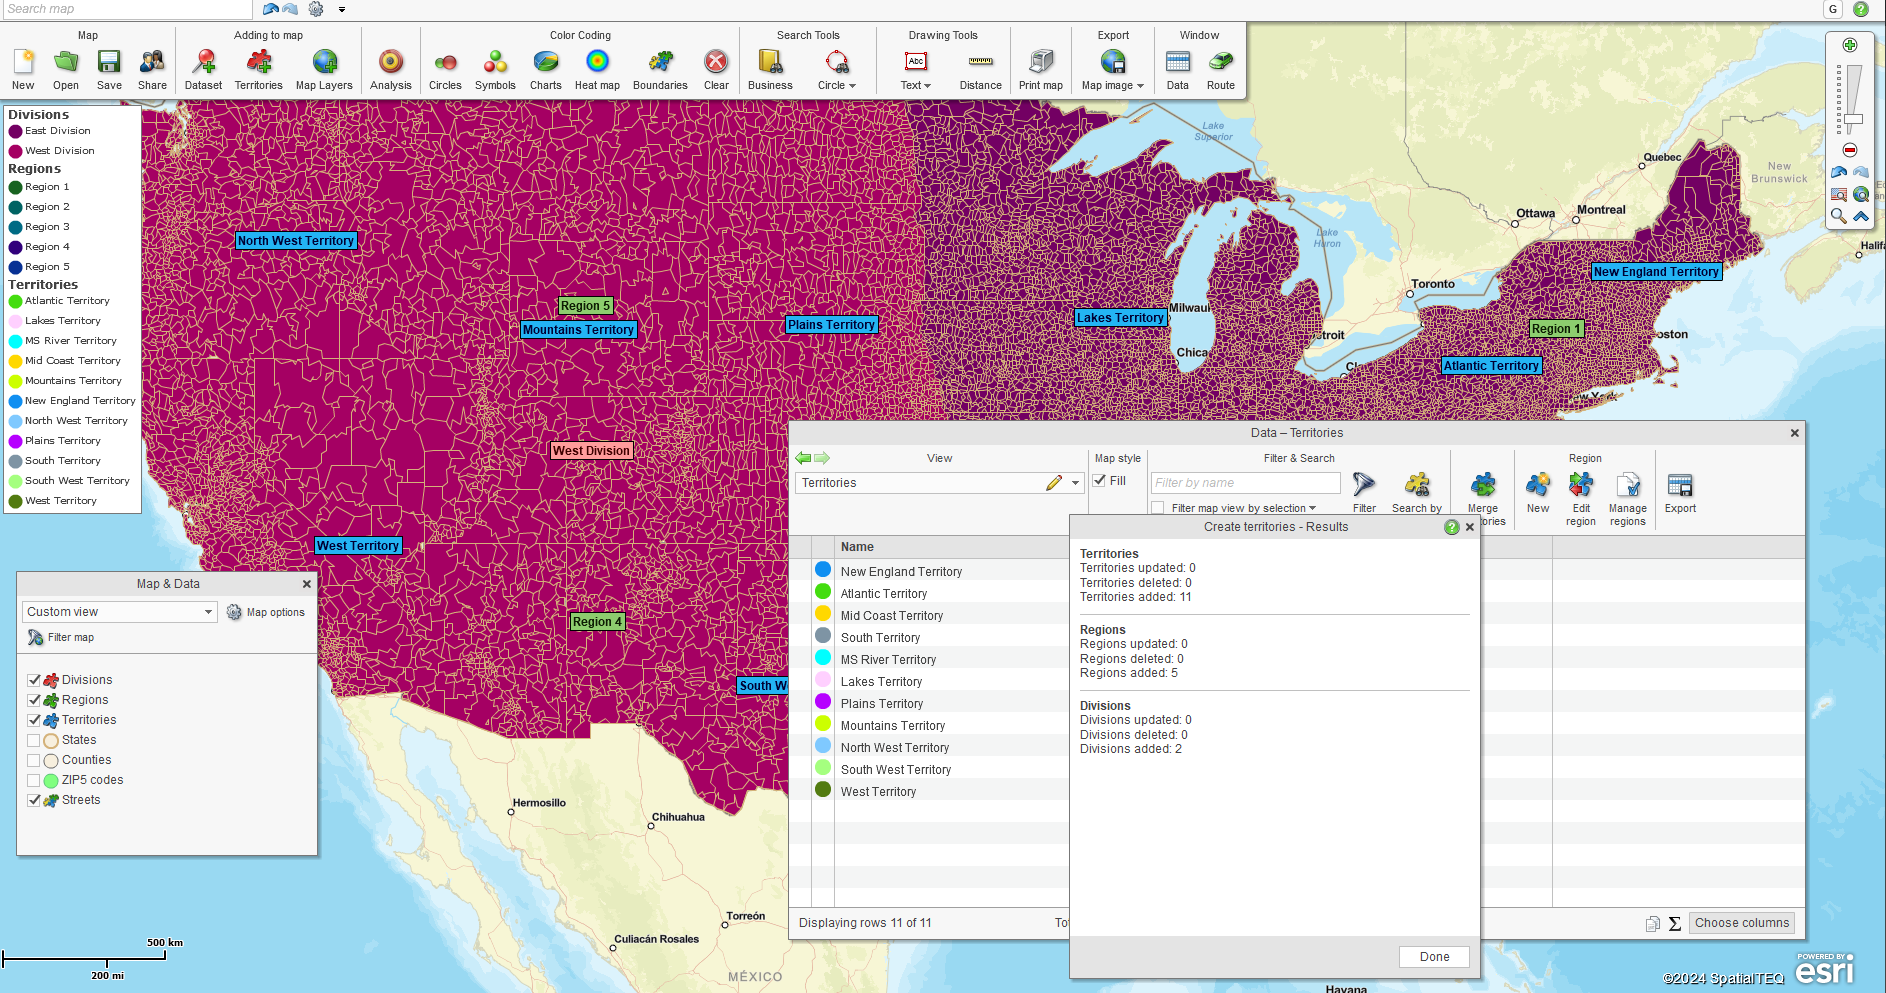
  6. Territories, regions, and divisions now populate the map view. The Data Window provides a territory datasheet view. A map legend listing territories, regions, and divisions also appears. A final Create Territories—Results pop-up box describes the number of territories, regions, and divisions created and any issues that might have occurred. Click Done when you’re finished reviewing the Results pop-up.

A post-import map view with the legend, Data Window, and Results pop-up is now on the MapBusinessOnline desktop:

Adjust and Refine Your Territory Map

At this point in your process, especially when creating a nationwide map based on ZIP codes, always review your map to ensure you’ve collected all the boundary ZIP codes or Counties required for your territory map. Look for unshaded areas that may need to be cleaned up. Editing territory maps is easy using MapBusinessOnline. Read more about creating a nationwide territory map.

You will also want to refine your map’s look and feel. Fine-tuning your map view makes it easier for your constituents to understand your territory map. Adding Regions and Divisions does complicate a map view.

I made several quick adjustments to each territory, region, and division layer to make the map easier to view and less cluttered:

At the Territorial Level

  1. In Map and Data, click the Edit Map Layer Properties button. Click on the General tab.
    1. Adjust the territory Boundary control to a thin, dark color.
    2. Check the Hide Internal Boundaries box.
    3. Move the Transparency bar to 60%.
  2. Click on the Label tab and change the Label Fill Color to White.

At the Region Level

  1. In Map and Data, click the Edit Map Layer Properties button. Click on the General Tab.
    • Adjust the Region Boundary control to a thicker, yellow color.
    • Check the Hide Internal Boundaries box.
    • Move the Transparency bar to 90%.
  2. Click on the Label tab. Change the Label Fill Color to match the boundary color, make the text Bold, and increase the size to Large. Use your cursor to move the label to a central point in each region.

At the Division Level

  1. In Map and Data, click the Edit Map Layer Properties button. Click on the General Tab.
    1. Adjust the territory Boundary control to a thicker, darker color.
    2. Check the Hide Internal Boundaries box.
    3. Move the Transparency bar to 90%.
  2. Click on the Label tab. Change the Label Fill Color to match the boundary color, make the text Bold, and increase the size to Large. Use your cursor to move the label to a central point in each division.

Here’s my final map output:

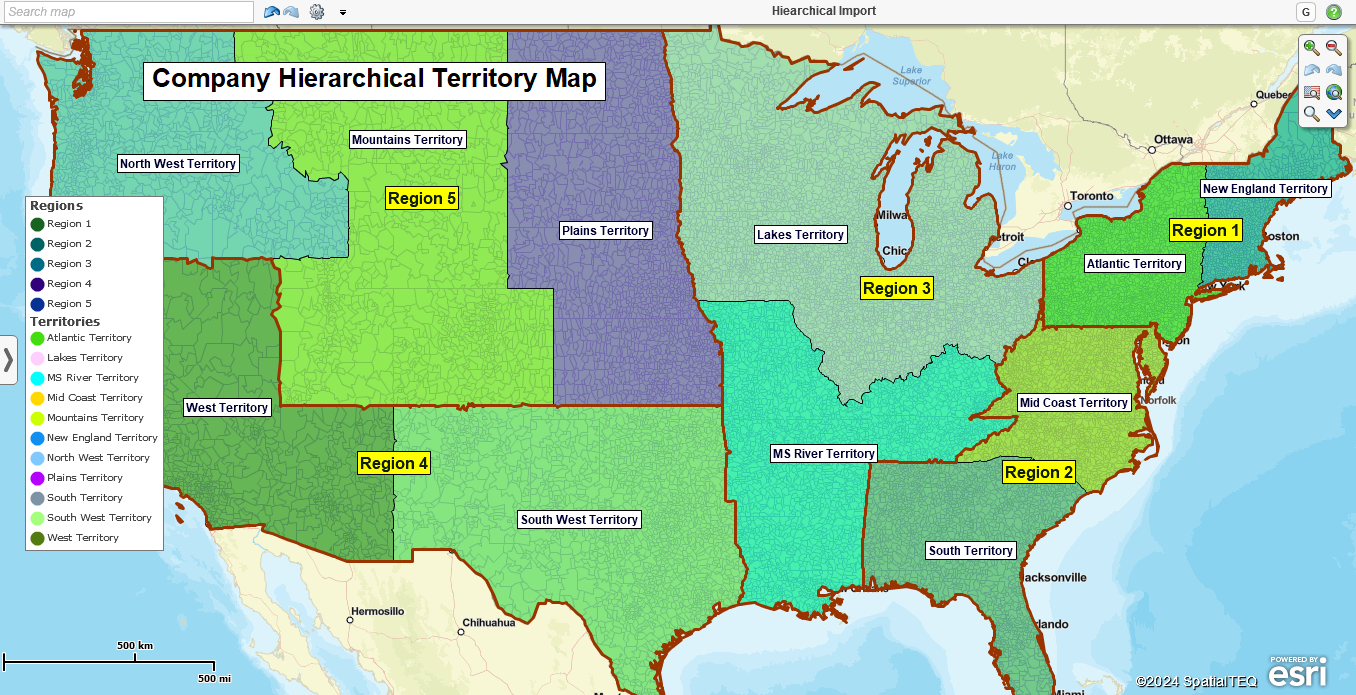
Final hierarchical territory map optimized for best look and feel.

The above adjustments are recommendations for optimizing this particular map view.  Your map business map may benefit from different colors, thicknesses, and transparency choices. Read more about how to adjust your territory map’s look and feel.

Using MapusinessOnline’s import territory hierarchies should only process, including territory edits, should only take 15 minutes or so. Technical support is always available through Chat, email, or phone.

Request a Web Demo


Posted in Business Mapping Software blog post, Franchise Mapping, How to instruction, Press Release, Sales and marketing | Tagged , , , , , , | Leave a comment

Metropolitan Statistical Areas – Census Geographies for Market Analysis

MapBusinessOnline includes a geographic boundary layer called MSAs or Metropolitan Statistical Areas. MSAs are area geographies designed, managed, and published by the Census Bureau.  These areas come in two types:

Metropolitan MSAs – These are defined as having at least one urban area with a population of 50,000 people, ensuring the accuracy of your data analysis.

Micropolitan MSAs are areas with at least one area with population of at least 10,000 but less than 50,000.

Read more about the Census Bureau MSA criteria here.

The MSA map layer in MapBusinessOnline is included in the Layers button along the Master Toolbar. Select the MSA layer, which will be displayed on your business map. Each record of an MSA consists of an identifying FIPs code. A map editor can edit the look and feel of an MSA layer just like a City Limit, ZIP code, or County layer; you can control boundary color and thickness, choose fill color, and turn fill on and off.

Read more about adjusting your map’s look and feel.

A nationwide MSA map showing population breakdown.

MSA – Marketing Geographies

MSA geographies in MapBusinessOnline are more than just areas; MSAs are often used as convenient examination regions for market analysis.  Reviewing relevant business and demographic data over a germane target area helps the map user make informed business decisions.

MSA demographic population criteria are intended to characterize an area’s urban intensity, such as Boston.  Any metropolitan area, like Boston, typically includes radio, periodical, television programming, and online media with advertising that directs consumers to local and regional businesses for products and services.  This demographic marketing data keeps your business informed and competitive in the market.

Using an entire MSA to represent a marketing area of focus can also save map-building time and help organize your unique business analysis.

In MapBusinessOnline, the application of MSA areas sometimes overlaps with other map analyses that could include ZIP codes or counties. A map creator can create territories from multiple ZIP codes or counties representing marketing areas. MSAs are preconstructed and might provide a similar map presentation with less time and effort.

MSAs are similar in scope and intent to Nielsen DMA geographies, which are also designed marketing areas. DMAs are proprietary and controlled by Neilsen, requiring significant investment to be incorporated into an analysis tool like MapBusinessOnline.

Here’s a demographic example using MSA geographies.  The most money spent on alcoholic beverages per capita occurs in Los Alamos, NM, not Boston, MA, as many suspect.

MSA geographies and Census consumer data on alcohol consumption.

Practical Use of MSAs

The MSA map layer in MapBusinessOnline could be used to design a sales, service, or franchise territory mapping system, just like you would using other map layers.  MSAs can be combined into groups or territories.  Applying MSA territories could be a time saver for businesses with more extensive territory operations and a way to focus on core markets. For instance, Boston, Worcester, and Manchester, New Hampshire, might combine nicely into a key territory for certain organizations doing business there.

MSAs could also serve as a franchisee territory base layer within franchising organizations.  SA easily accommodates the import of MapBusinessOnline demographic data for balancing purposes.  All territory functionality still applies, so minimizing areas of overlap is easy.

The downside of MSA territories in franchising is that the coverage areas may be too large.  Franchisee territories tend to be concentrated in heavily populated urban areas, and the outlying regions are usually too sparsely populated to support a franchise sales business.

Like other MapBusinessOnline business mapping software MSAs, geographies can be combined beyond territory maps into regions and divisions.  Hierarchical territory support constantly improves as MapBusinessOnline releases updates enabling hierarchical territory data imports.

Like other boundary map layers in MapBusinessOnline, MSAs can be color-coded based on relevant associated data, such as imported business data or demographic data.  These relevant data layers can create another view of the USA  or regions that reflect core demographic statistics.

Sales organizations may find MSAs a very convenient geography for selecting and downloading business listings.  Because the MSA areas tend to be more urban-focused, business listings will be concentrated in these populated and active centers of consumer activity.

Explore the other map layers available in MapBusinessOnline. City limits and census tracts are additional add-on layer options for your business map work.  See how MapBusinessOnline can make your location-based work more accessible, enjoyable, and effective.

Request a web demo

Posted in Business Mapping Software blog post, Franchise Mapping, How to instruction, Sales and marketing | Tagged , , , , , , , , | Leave a comment

MapBusinessOnline Pro – A Solution for Where & When Challenges Related to Location

What problems does MapBusinessOnline Pro solve for the average customer using the tool?

Business mapping software and GIS are geographic software solutions that address business challenges from a location perspective. In other words, a subscribing user of MapBusinessOnline would use the software to address a business problem within their industry that is related to location in some way.

Finance Business Problems

For example, a banker might examine the problem of monitoring real estate investment risks for a specific business client. Instead of viewing those investments by account number in a spreadsheet, they might also use MapBusinessOnline to create a location-based Map Visualization of those investments overlaid on a ZIP code or group of ZIP codes or perhaps over a radius search of 10 miles from a given center point.

Once defined on a MapBusinessOnline business map, a specific area of interest can be easily overlaid with an array of relevant location data. For risk assessment in the above banking example, the area of interest can be enhanced with demographic information, imported business, and other relevant datasets.

What problems does MapBusinessOnline solve for a banking business?

  1. Exposing possible mortgage and loan area risks. Map visualizations can display color-coded ZIP codes that reflect high-risk neighborhoods based on loan portfolios and demographic trends.
  2. Business maps that include actual client home and business locations with relevant financial data can be symbolized to reflect investment or payment histories—banks like knowing where both good and bad customers spend their money.
ZIP Codes Med Household Income Population No. of Snow Tires Sold Winter 2024 Mortgage Values
27415 $57,875 5478 216 $12 million
27418 $63,978 4879 187 $8 million
27419 $61,879 6014 235 $6 million

An example of business data that could be imported into MapBusinessOnline.

In addition to banks, insurance companies and franchise businesses use the territory mapping and market analysis capabilities of MapBusinessOnline Pro to control multiple aspects of their businesses, including:

  • Managing field technicians and sales staff in the field using territory management tools.
  • Finding new markets using map-based market analysis based on actual sell-through data.
  • Examining expansion opportunities and fine-tuning site selection.
  • Avoid sales staff frustration and balance workloads by controlling sales overlap.
  • Informing the sales team or strategy meetings using map visualizations.

Franchise Business Challenges

Of course, a ‘franchise business’ covers a lot of ground. That’s because franchises could be:

  • Restaurant businesses – A series of restaurants sold to franchisees from city to city, such as McDonald’s.
  • A set of retail product(s) sold through franchisee stores like Ace Hardware.
  • A service business. There are thousands. Think The UPS Store, Anytime Fitness, or Tattoo Removals R Us.

Franchise businesses love territory maps because map visualizations describe the franchisee’s territories well. Map visualizations created in MapBusinessOnline also include a data view.

What problems does MapBusinessOnline solve for a franchise business?

  1. Ensure the franchisor and the franchisee are clear on territory boundaries, with no overlap with other franchisee territories.
  2. Balance franchisee territories to keep things equal between franchisee businesses.
  3. Provide the franchisee with a map visualization of the territory to be filed with the franchise investment records.

Franchising businesses use MapBusinessOnline to analyze the marketplace and balance territories.

Construction Industry Mapping

Business mapping software provides geographic visualization tools perfect for site management and assessment. Construction, property management, and real estate professionals use Map Business Online Pro for portfolio management and site assessment tasks.

Portfolio management means specific sites or groups can be imported into a map project as a location dataset. Typical Excel or standard spreadsheets can be imported easily by address or lat/long coordinates.

Once imported, map visualizations are created from future site location data to enhance sales processes and construction management. For example, construction site locations can be visualized within a specific driving time or distance window of the nearest critical resources. Construction sites can be color-coded and symbolized to reflect project status and type, such as construction versus renovation sites.

What problems does MapBusinessOnline solve for a construction business?

  1. A map visualization shows where existing construction projects are located. Similar projects might fit well into the business growth plan, perhaps assisting sales with new leads.
  2. Site assessments can be organized by mapping projects, tracking inspection appointments, and other milestones, providing an organizing platform for project review.
  3. Where are all my critical resources located? MapBusinessOnline Pro conducts proximity searches to reveal the nearest municipal, medical, and other industry resources.

Medical Business Planning

Anyone seeking medical services in urban areas with at least one hospital system will have noticed medical businesses changing ownership or merging with new umbrella business management. Such medical system consolidation can bring challenging operational shifts impacting medical professionals and the patient community.

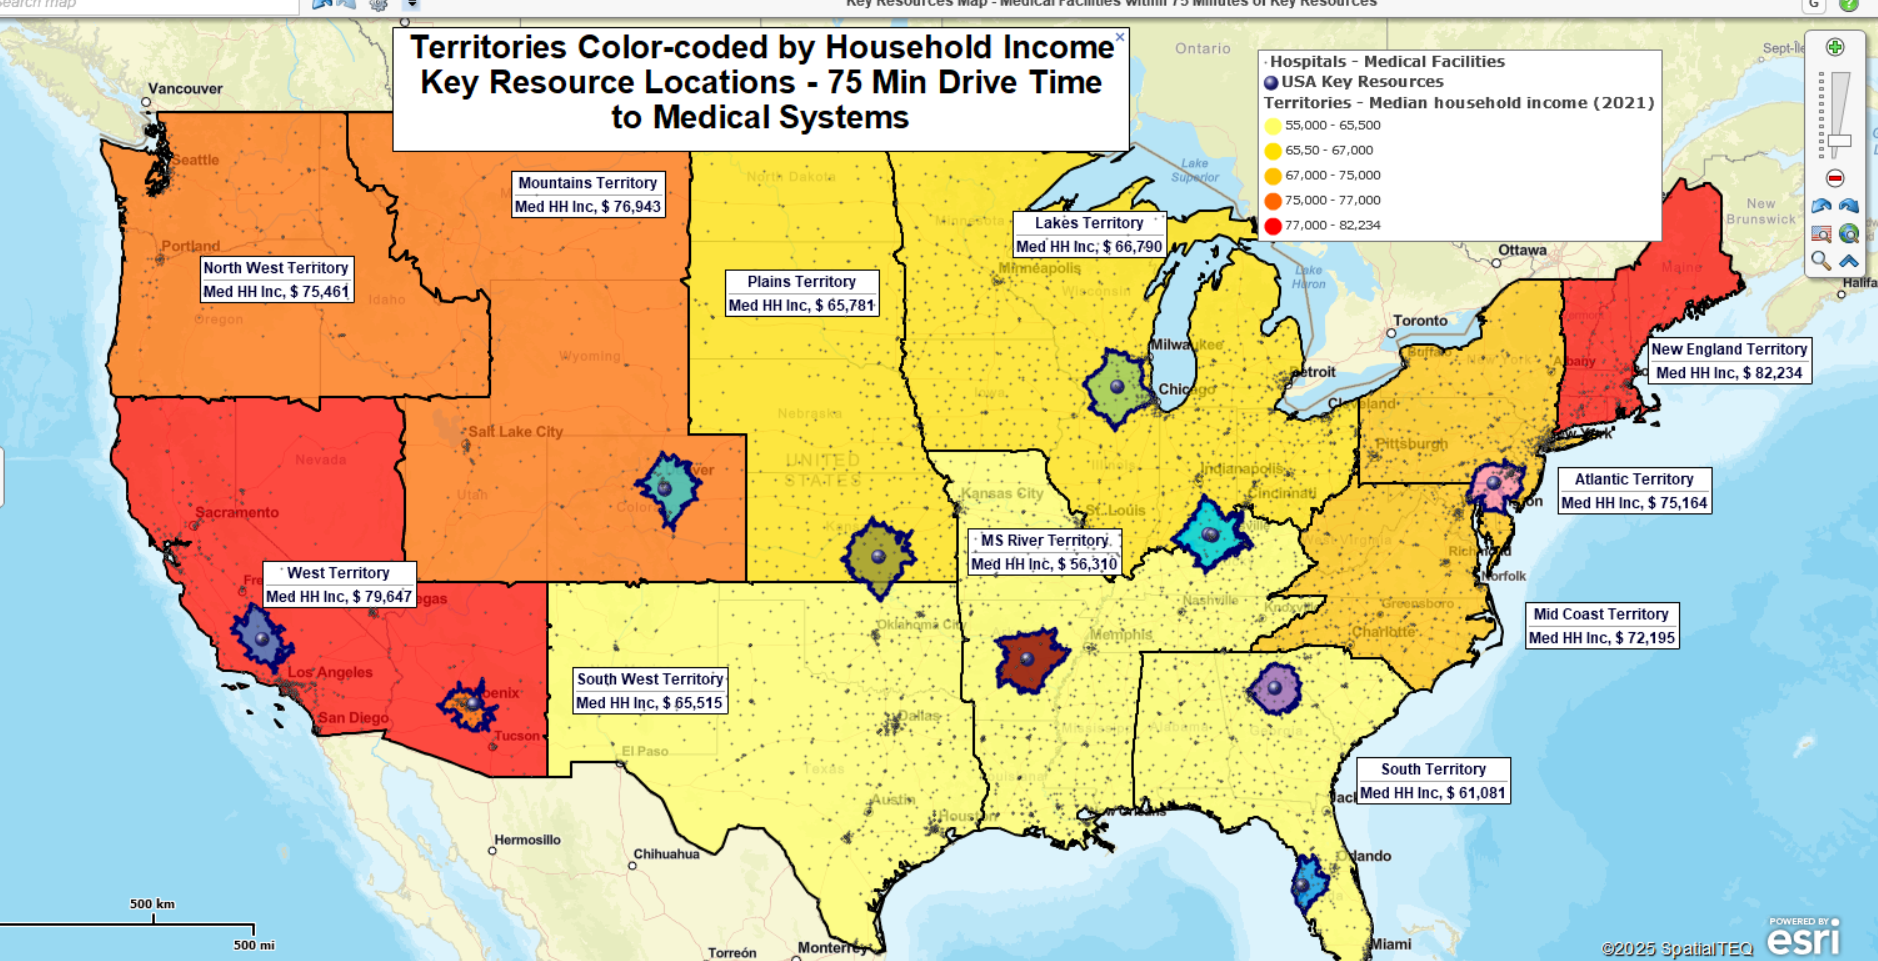
Medical system planners often include an analysis of driving time and distance analysis in their acquisition and systems development planning. MapBusinessOnline Pro provides affordable driving time and distance tools to quickly define areas of interest based on driving time measurements.

Health Care System analysis map using MapBusinessOnline.com

What problems does MapBusinessOnline solve for a medical systems business?

  1. Understanding where the core client constituency lives. Establishing driving time or distance tolerances for most patients seeking standard medical services means site assessments can proceed in designated areas. Driving time and distance queries can help decide where to locate a medical lab or imaging facility to maximize client convenience.
  2. Organizing medical business consolidations based on like services and proximity to the central hospital system. Maps keep things efficient.
  3. Understanding where traveling clinicians are today and viewing patient locations on a business map can help avoid expensive clinician travel cross-traffic while addressing critical patient needs.

MapBusinessOnline Pro provides significant businesses with the advanced capabilities to solve complex business problems based on location.

  • Import up to 250,000 locations points per map.
  • Create up to 1,500 territories per map.
  • Generate proximity searches, origin-destination analysis, and demographic analysis.

We help businesses with where, when, and how challenges.

Request a web demo here.

Posted in Business Mapping Software blog post, Franchise Mapping, How to instruction, Sales and marketing | Tagged , , , , , , , , , , | Leave a comment

Radius Searches Compared to Driving Time & Distance Searches in MapBusinessOnline

Radius and Driving Time searches are commonly used geospatial search approaches within MapBusinessOnline. Each data search tool has its advantages.

MapBusinessOnline Standard offers both Radius and Driving Time and Distance search options under Search Tools on the Master Toolbar.

MapBusinessOnline Pro includes all Standard capabilities and offers extended Radius and Drive Time mapping capabilities through the Analysis Button on the Master Toolbar.

Read more about the differences between MapBusinessOnline Standard and Pro.

Radius Search

Selecting the Circle or Radius option from the Search Tools drop-down generates a basic radius search. Place a center point on the desired location, and select the circle’s radius distance by dragging your mouse cursor or adjusting the radius length in the Properties dialogue box that pops up.

Select the Radius option from the Search Tools and choose your search radius.

But why generate a radius search to begin with?

A circular area or radius spatial search is an organized way to view data. An organized search can help locate a dead body, a lost child, or a missing wedding ring. Radius searches also reveal trends in data, such as customer purchase patterns or disease trends in the field.

Radius searches are more straightforward than a driving time or distance-based search. A circular shape or radius object is placed on the map, and the area it covers is searched for data. A driving time or distance polygon must also account for the travel along the road network. The resultant shape of the area is based on the calculation of driving time or distance. This means we must consider distance traveled along all roads, speed limits across all roads, and even turn restrictions across all roads in all directions.

Radius searches can be easily duplicated on a map view. A map creator can copy the radius search and plot the same search at a new location. Concentric ring searches provide extended radius searches – first a 1-mile search, then a 5-mile search, and so on.

Radius searches are also faster than polygon and free-form searches. The map creator doesn’t have to be so exact. Drop a point, stretch the circle to the desired size, and go. Polygons and random shapes can be messy, unintentionally grabbing areas and data outside the intended space.

Data searches are similar to physical searches. Radius searches in standard lengths keep things consistent across a map. Of course, there may be times when a varying search radius is applied. A polygon search tool might work better around significant geographic obstacles. It depends on the circumstances. For instance, mountains and highways can complicate real or virtual searches for things or data.

A consistent radius search area can provide relevant results when analyzing or comparing demographic data. A five-mile radius search in New York City will display very different results from a five-mile radius search in Bingham, ME, which is how it should be—a reflection of population density. In the case of New York City versus Bingham, ME, the population density is staggering different based on a consistent 1-mile radius.

New York, NY vs. Bingham, ME.

New York, NY – 1-Mile Radius Search Population Density – 81,858.1

Bingham, ME – 1-Mile Radius Search Population Density – 18.48

Calculated using MapBusinessOnline Standard Radius Search and US Census Bureau Demographic Data.

Drive Time Searches

In MapBusinessOnline Standard and Pro, Drive-Time searches, as mentioned above, are a more complex alternative to Radius Searches. The user still searches an area for imported location, demographic, or geographic data within a defined area. But instead of a circular area, a drive-time area is generally a jagged polygon that reflects the area encompassed by a vehicle’s potential travel perimeter in all directions over a given time.

Drive time configurations consider road speed limits, one-way/two-way restrictions, highway classifications, and time of day traffic. So, where a radius search defines a 5-mile circular area, a driving distance search shows the map view of the area covered if a vehicle traveled five miles along the road network in all directions. Likewise, a driving time search shows the area covered if a car traveled along the road network for five minutes in all directions.

Drive time polygons used for territory development.

Driving time search results gather data within a driving time or distance polygon. These dataset query results in MapBusinessOnline could report imported demographic and geographic data.

Retailers like drive-time searches for defining and analyzing marketing campaigns. Driving times help define core audiences for campaign messaging, for example, the assumption that a family won’t drive further than a 20-minute drive time for pizza or miniature golf.

A manufacturing sales team might use drive time analysis to define territory areas based on the sales representative’s start-of-day locations and maximum driving distance. This is a common method for balancing territories and keeping workloads and compensation fair.

Logistics managers use driving time and distance searches to determine optimum travel pathways for supply chain transportation networks.

Facility operations planners use driving time searches to calculate the most effective new locations for warehousing, stores, or light manufacturing facilities.

MapBusinessOnline Pro enhances the drive time search capability of MapBusinessOnline Standard by offering multiple center point searches, origin-destination batch analysis, and comparison of multiple datasets for driving time and distance results.

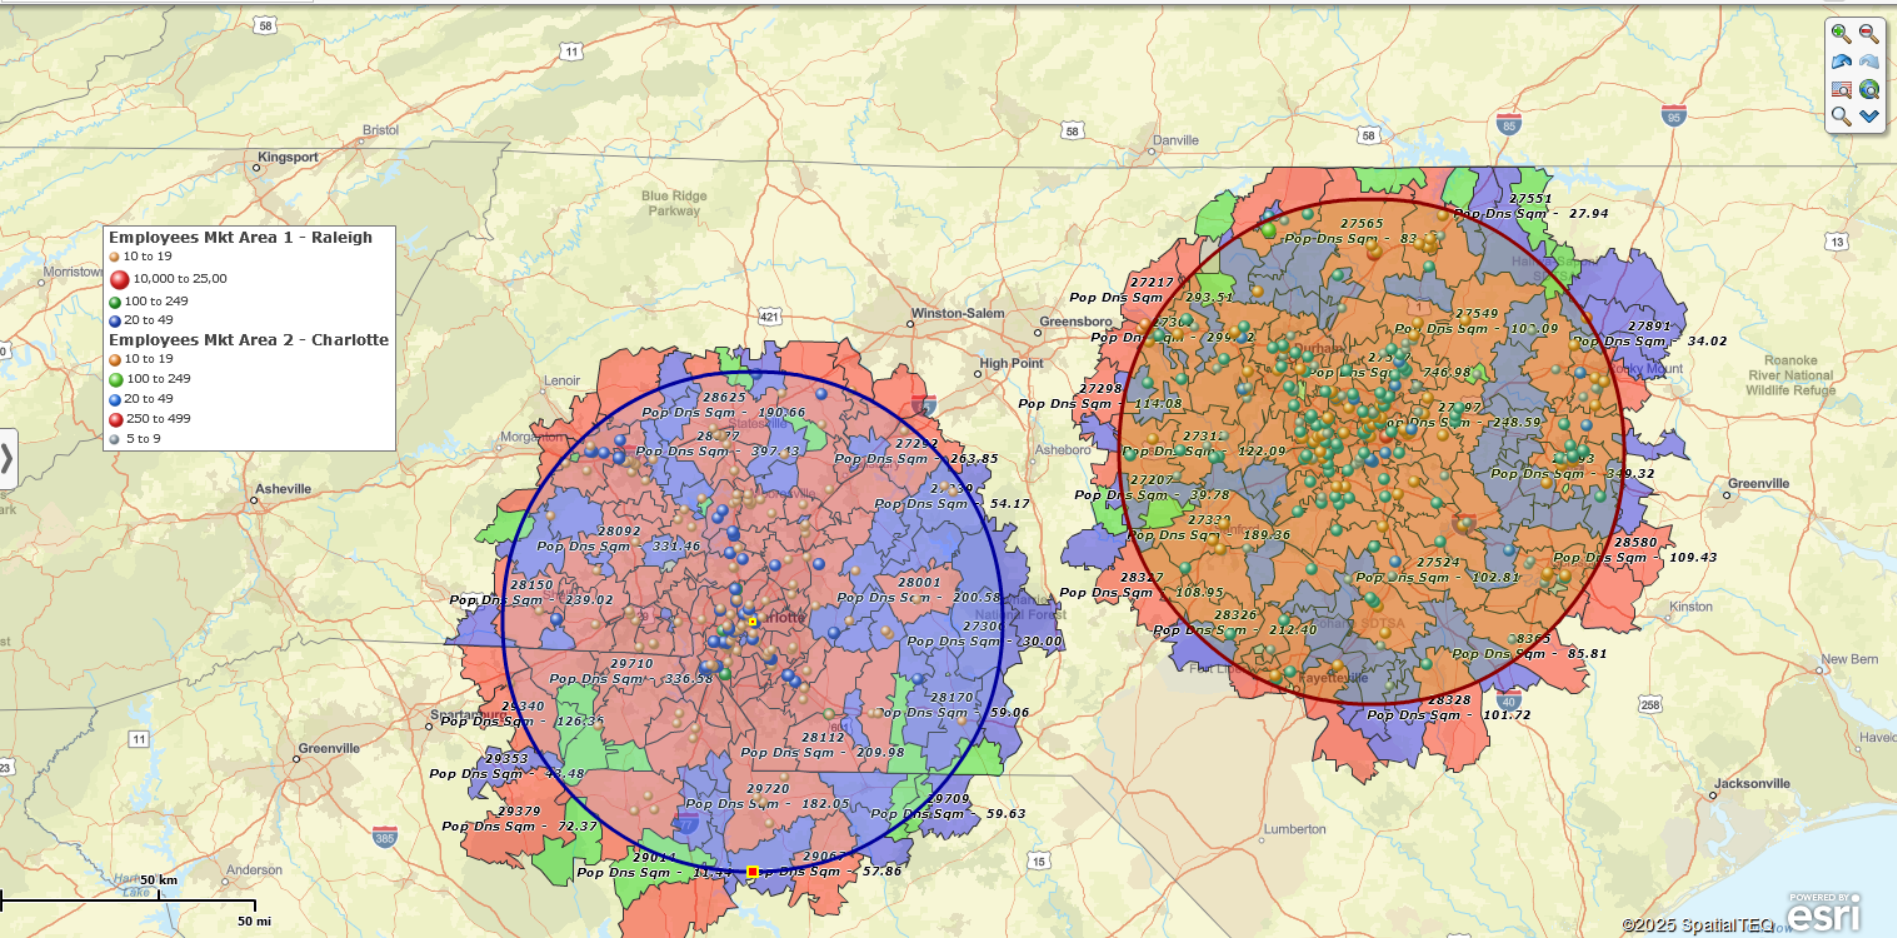
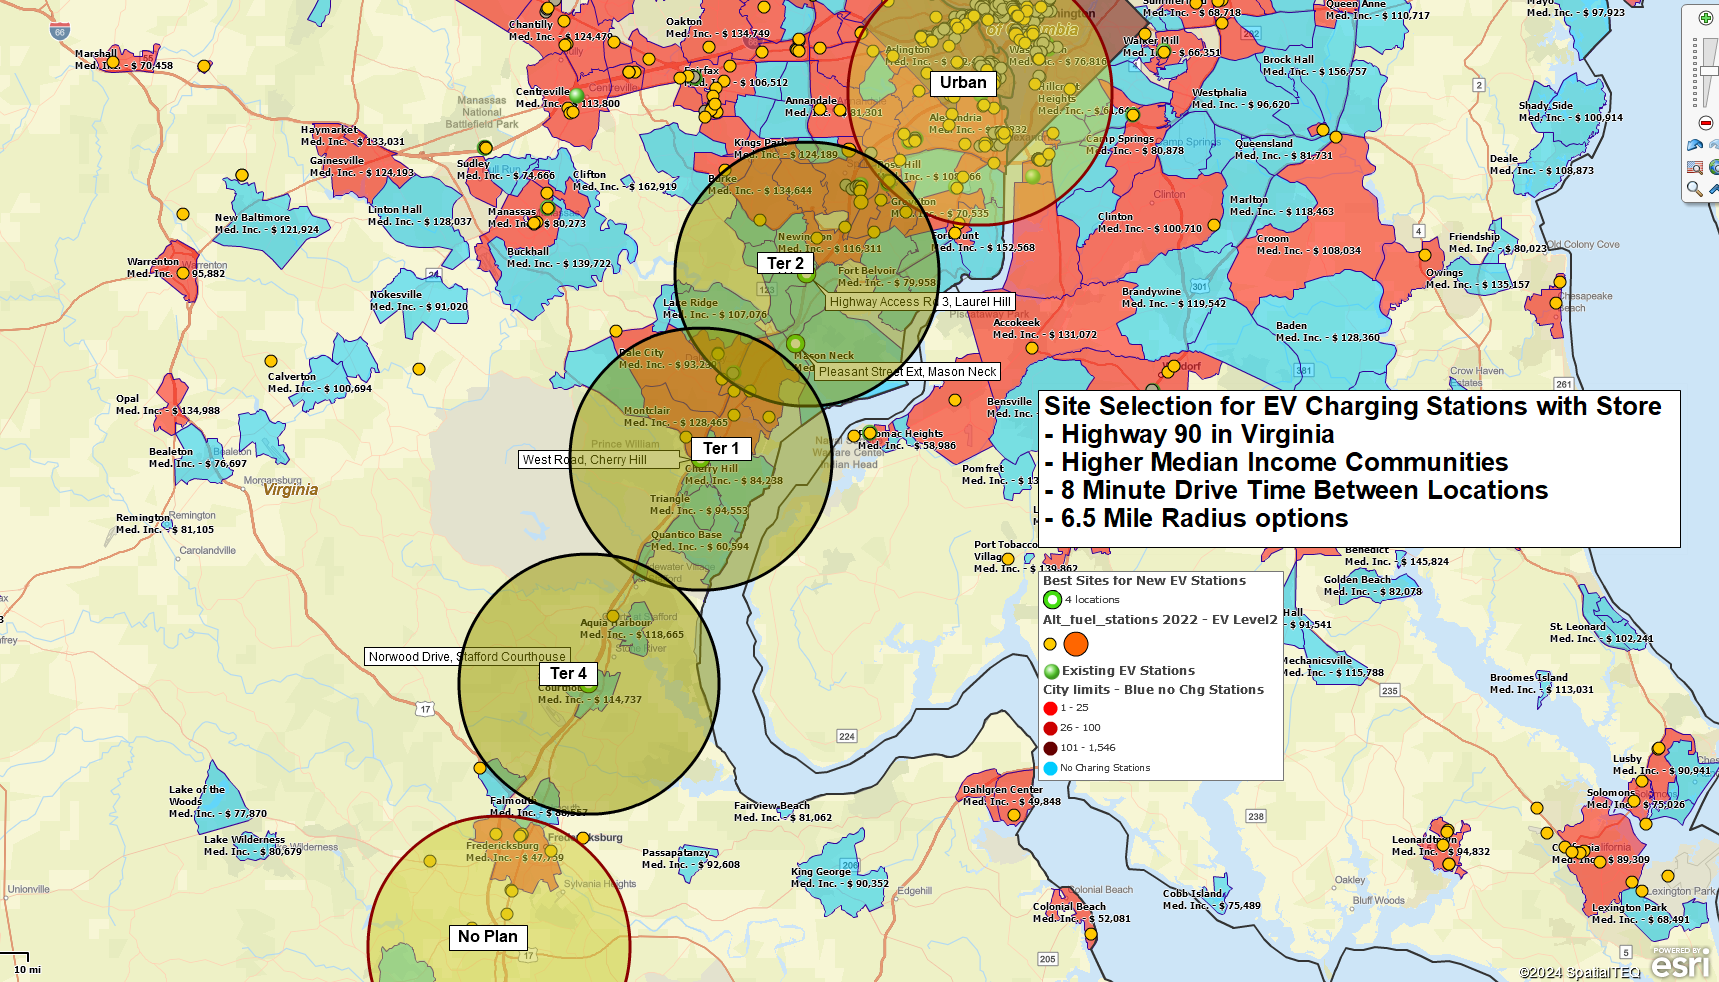
In many mapping situations, both radius searches and driving time and distance searches can be used on the same map. Drive time polygons might be used to create territories or areas of interest related to a highway. A general radius search could provide relevant demographic data for the map viewer on the same map.

A site selection planning map with relevant demographic data highlighted by a radius search.

As always, business mapping tools serve your map’s business purpose. Use them wisely and avoid superfluous clutter on your map, or you might win the National Map Geek Cluttered Map award.

Request a web demo here.

Posted in Business Mapping Software blog post, Franchise Mapping, How to instruction, Sales and marketing | Tagged , , , , , , | Leave a comment