Business mapping software helps you communicate concepts and business plans to your map audience. A critical aspect of that communication is the Map Legend. I talked about the legend in the last post, but I guess I have more to say.
The map legend is the key to understanding map symbolization, color schemes, and key data layers. Sometimes it is referred to as a Map Key. The map legend explains your map.
Keep It Simple
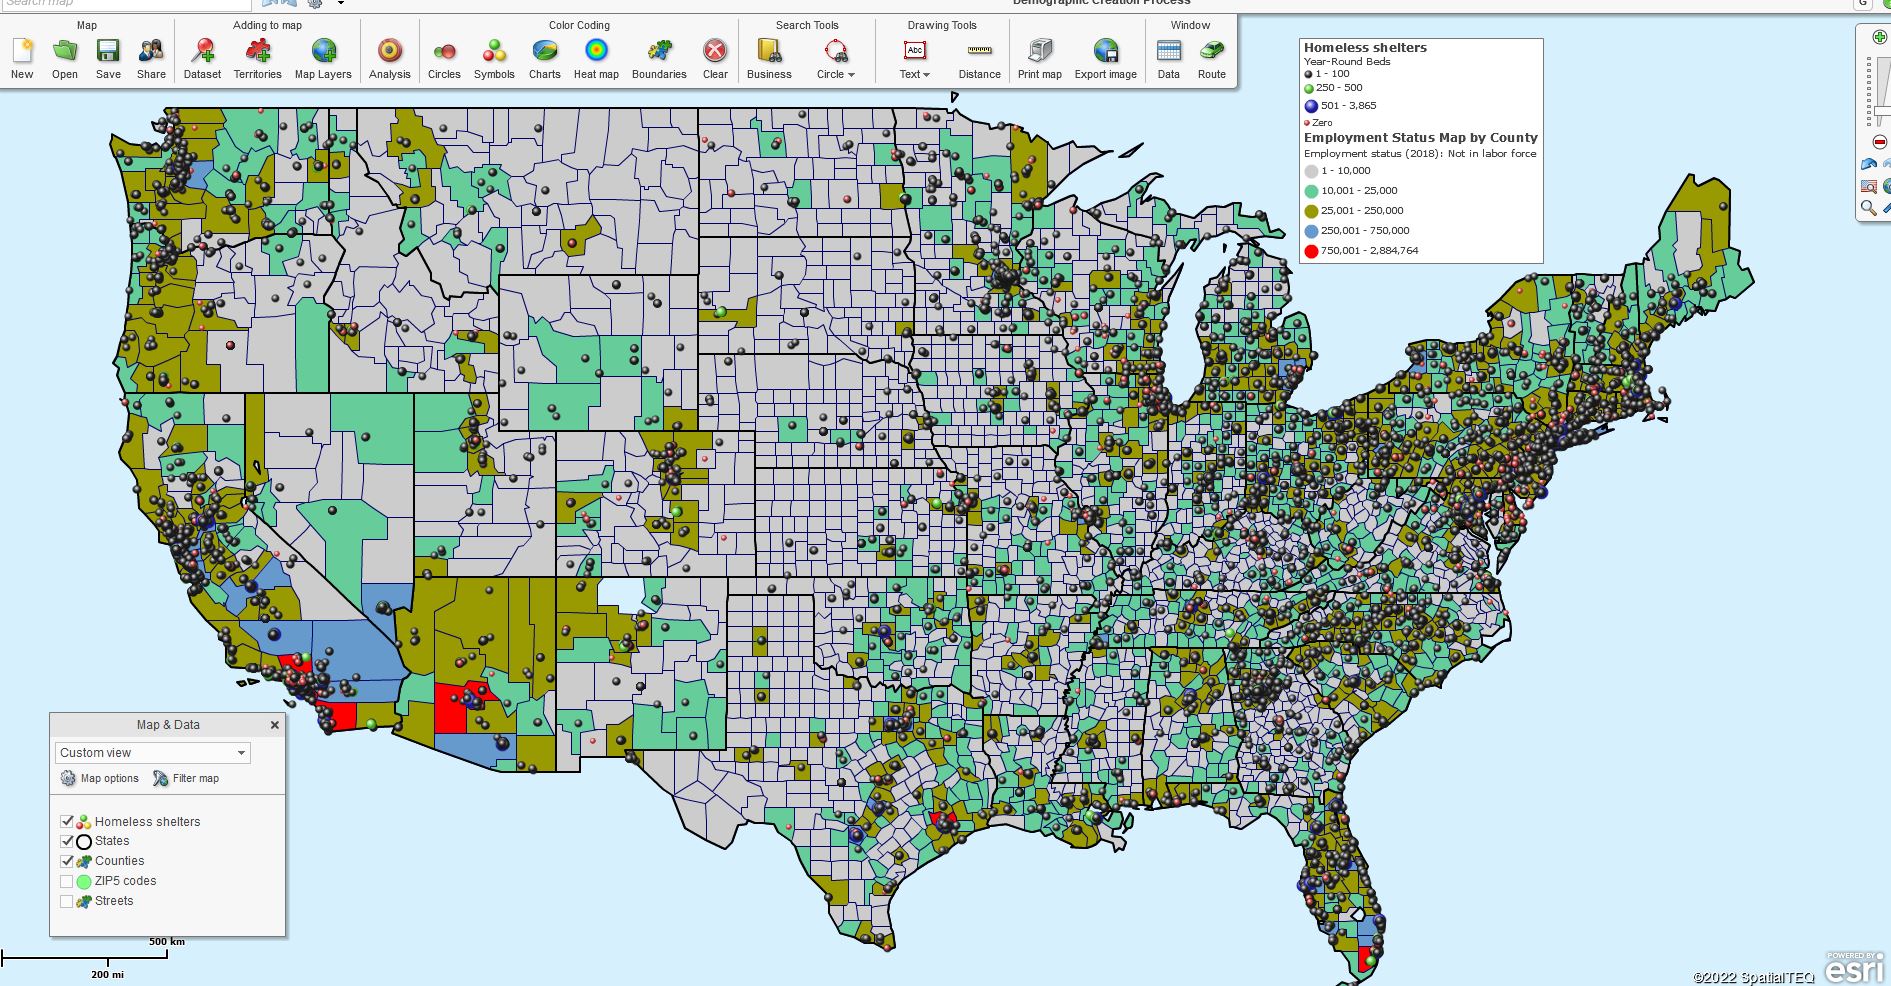
Over time, as you add more and more information to your map, your map legend can grow large. Think of this growing map legend as a warning. If your map legend is more significant than one-third of your map, you are placing too many data layers into your map view or trying to symbolize too many location points. Consider simplifying your map by deleting layers, dumbing down your color-coding scheme, or perhaps using two maps to make your point(s).
Often, new users try to symbolize more than 50 different record types. For example, the user may assign another symbol for each of the 65 sales reps or a different symbol for each of the 80 customer locations. The mapping software will let the user do this, but it is not a good idea. Too many color schemes create a busy map and a map legend that’s way too big. You may be asking the boss to think too hard – now, is that something you really want to do?
Consider consolidating your symbolization candidates into categories. Instead of 50 sales reps, classify them by type: 20 reps are seasoned, 25 reps are rookies, and five reps are temps. Customer categories for those 80 customers might be 25 commercial accounts, 20 industrial accounts, 15 distributors, and 20 government accounts. So instead of 80 customer symbols, you would now show five different symbols classified by customer type.

Employed Labor Theme & Homeless Beds Symbols.

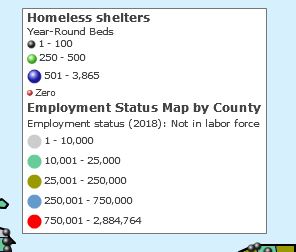
Succinct Legend for Above Map
Color-shading by Numeric Value
In MapBusinessOnline, your map legend follows that classification scheme as you symbolize your numeric data based on dollar values or quantities. This is achieved by choosing a set of ranges to display numeric values. For example, three ranges:
• 0 to $1000 Yellow
• $1001 to $5000 Green
• $5001 to $10000 Red
Each range is represented on the map and the map legend by a different color shade. Your business mapping software will control how numeric values are displayed, how many ranges you can establish, and what symbols and colors can be applied.
These numeric value color-coding schemes are crucial for displaying demographic data by county, zip code, or Census tract. A popular demographic category for color-coding is household income by zip code. But the range assignments always work the same way. In the above case, the color of a zip code is shaded to reflect an estimated population of an age segment or gender group in that zip code.
Edit the Map Legend
MapBusinessOnline legend controls are in the legend itself. Find the Map Legend on the map after importing data. If the legend is missing in Map and Data, click the Map Options Gear on the top menu. In the panel that opens about halfway down, click Edit Legend. Make sure the Show Map Legend box is checked on, and click the Update Map Legend button at the bottom.
To edit the legend layers and text, click the tiny Edit Gear in the top right corner of the map legend. Select layers to edit and adjust the text to your liking in the panel. Go ahead and try it. It’s pretty straightforward. When done, click Update Map Legend.
Reset Legend Order Using Color Code Tools
Even though the Map Legend is an editable feature of the mapping program, most data display and symbolizing controls are found in the color-coding processes. Sometimes, after completing a value-based color scheme, a client realizes that the map legend does not reflect the order or text they had anticipated or desired. To change the order of the data ranges or the breadth of a data range, return to the color-code controls and adjust the parameters there.
Often, when the map user imports Excel data or other spreadsheet datasets, the name of the dataset imported ends up on the legend as a data label. Use the map legend editing tools to edit the map data labels on legend layers or delete superfluous words in descriptions.
Remember, the map legend is the key to unlocking the meaning of your map. Please keep it clean and focused on the critical elements you are trying to display with your map. Make it easy for your audience to understand your map.
Napoleon defeated Austria with the help of a simple map. It turns out his Russian map may have been way too busy. “Mon Dieu! Cette carte légende font tourner la tête!”
_______________________________________________
Discover why over 25,000 business users log into www.MapBusinessOnline.com for their business mapping software and advanced sales territory mapping solution. The best replacement for Microsoft MapPoint happens to be the most affordable.
To access MapBusinessOnline, please register and download the Map App from the website – https://www.mapbusinessonline.com/App-Download.aspx.
After installing the Map App, the MapBusinessOnline launch button will be in the Windows Start Menu or Mac Application folder. Find the MapBusinessOnline folder in the Start Menu scrollbar. Click the folder’s dropdown arrow and choose the MapBusinessOnline option.
The Map App includes the Map Viewer app for free non-subscriber map sharing.
Please read customer reviews or review us at Capterra or g2crowd.
Contact: Geoffrey Ives geoffives@spatialteq.com or Jason Henderson jhenderson@spatialteq.com
