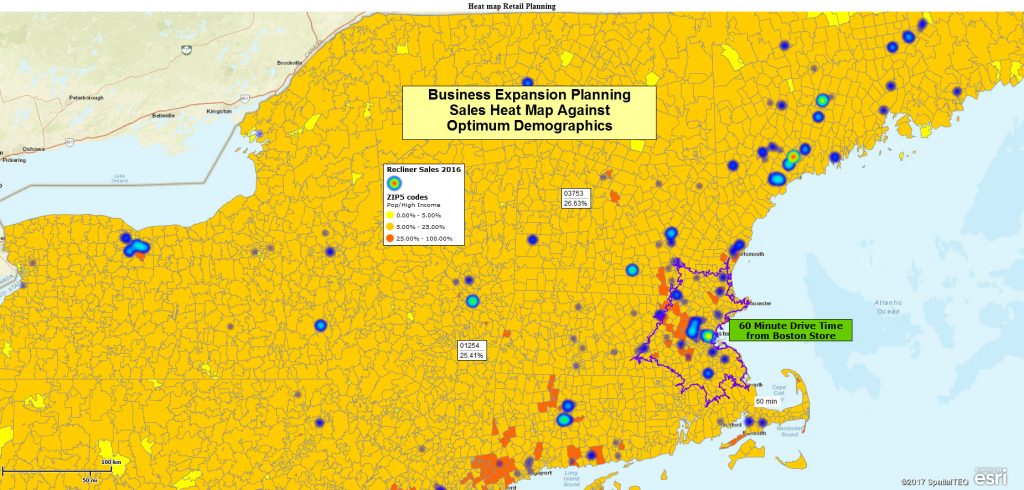
A heat map is a map centric representation of numeric data, that displays the relative intensity of the selected data in color shadings.
Heat maps are used to show increasing or decreasing intensity in location data. Sales activity can be depicted through heat mapping. Sales managers can easily share information about where sales are occurring and growing by showing the data as a heat map. Crime statistics are sometimes displayed as a heat map. Law enforcement maps often show statistical crime data in the form of a heat map. Heat maps tend to transform relatively boring numeric data into colorful maps inspiring map viewers to act.
I think heat maps communicate quickly because they look like weather maps depicting violent thunderstorms. Heat maps tend to wake up an audience.
Some map users call color coded ZIP code maps heat maps. In Map Business Online, while we do color shade ZIP codes based on data intensity, we do not call those heat maps. Those are simply color coded ZIP codes maps. When we color shade imported location data points to show data intensity we call it a heat map. Heat maps are based on numeric data columns in imported user data.
How to Create a Heat Map
- Make sure your data records have at least two columns. One columns for location and a second column with numeric data describing your subject
- Import your location or address based dataset into Map Business Online
- Click the Heat Map Button on the Master Toolbar

- Select your target data set and make sure the correct numeric data column is selected
- Choose an appropriate color scheme and an intensity setting from the options provided
- Process your heat map
Map Business Online heat maps can be quickly and easily adjusted. Simply scroll back through the above noted process and adjust color schemes or intensity to optimize your map view and maximize the effectiveness of your heat map.
Heat Maps Tell a Story
A heat map uses color intensity to describe relative differences between data at specific locations on the map. A series of heat maps describing the same locations with data collected over time will tell a story of how the subject matter intensity changes over the passage of time.
Use heat maps to describe your most important business activity. Just remember, the data must be numeric so business examples that translate well for heat map visualizations include:
- Sales activity by account
- The number of customers over a general area – customer quantity will aggregate into the heat map display by density
- The number of service calls by address
- The record of deliveries made to an address
- The number crimes occurring by lat/long location to show hot spots for specific types of crime – a heat map for arson, a heat map for robbery, etc.
Find out why over 25,000 business users log into www.MapBusinessOnline.com
Contact: Geoffrey Ives geoffives@spatialteq.com or Jason Henderson jhenderson@spatialteq.com (800) 425-9035
MapPoint users – please consider www.MapBusinessOnline.com as your MapPoint Replacement.
Please read customer reviews or review us at Capterra, or at the Salesforce.com AppExchange.
Map-Based Market Intelligence from Map Business Online.

