This seems a simple question, “How do I show cities on my business map?” And it is a simple question. But still, there are multiple options available to Map Business Online users when it comes to showing cities on their maps. It’s worth exploring those options in a blog.
A business mapping software is intended to make a business point. Sometimes the placement of cities is important to that business map point or purpose. Map Business Online has at least five ways for users to display cities on the map.
Cities are used in professional mapping software for a variety of applications:
- Marketing analysis – Cities and urban areas often represent the primary marketing areas of interest for businesses.
- Sales Territory Mapping – Cities might be used for the base map layer of territory construction or reference points for salesperson start of day positions.
- Map Visualizations – Cities provide map orientation points and are often relevant anchor points for business descriptions.
Background Map Cities
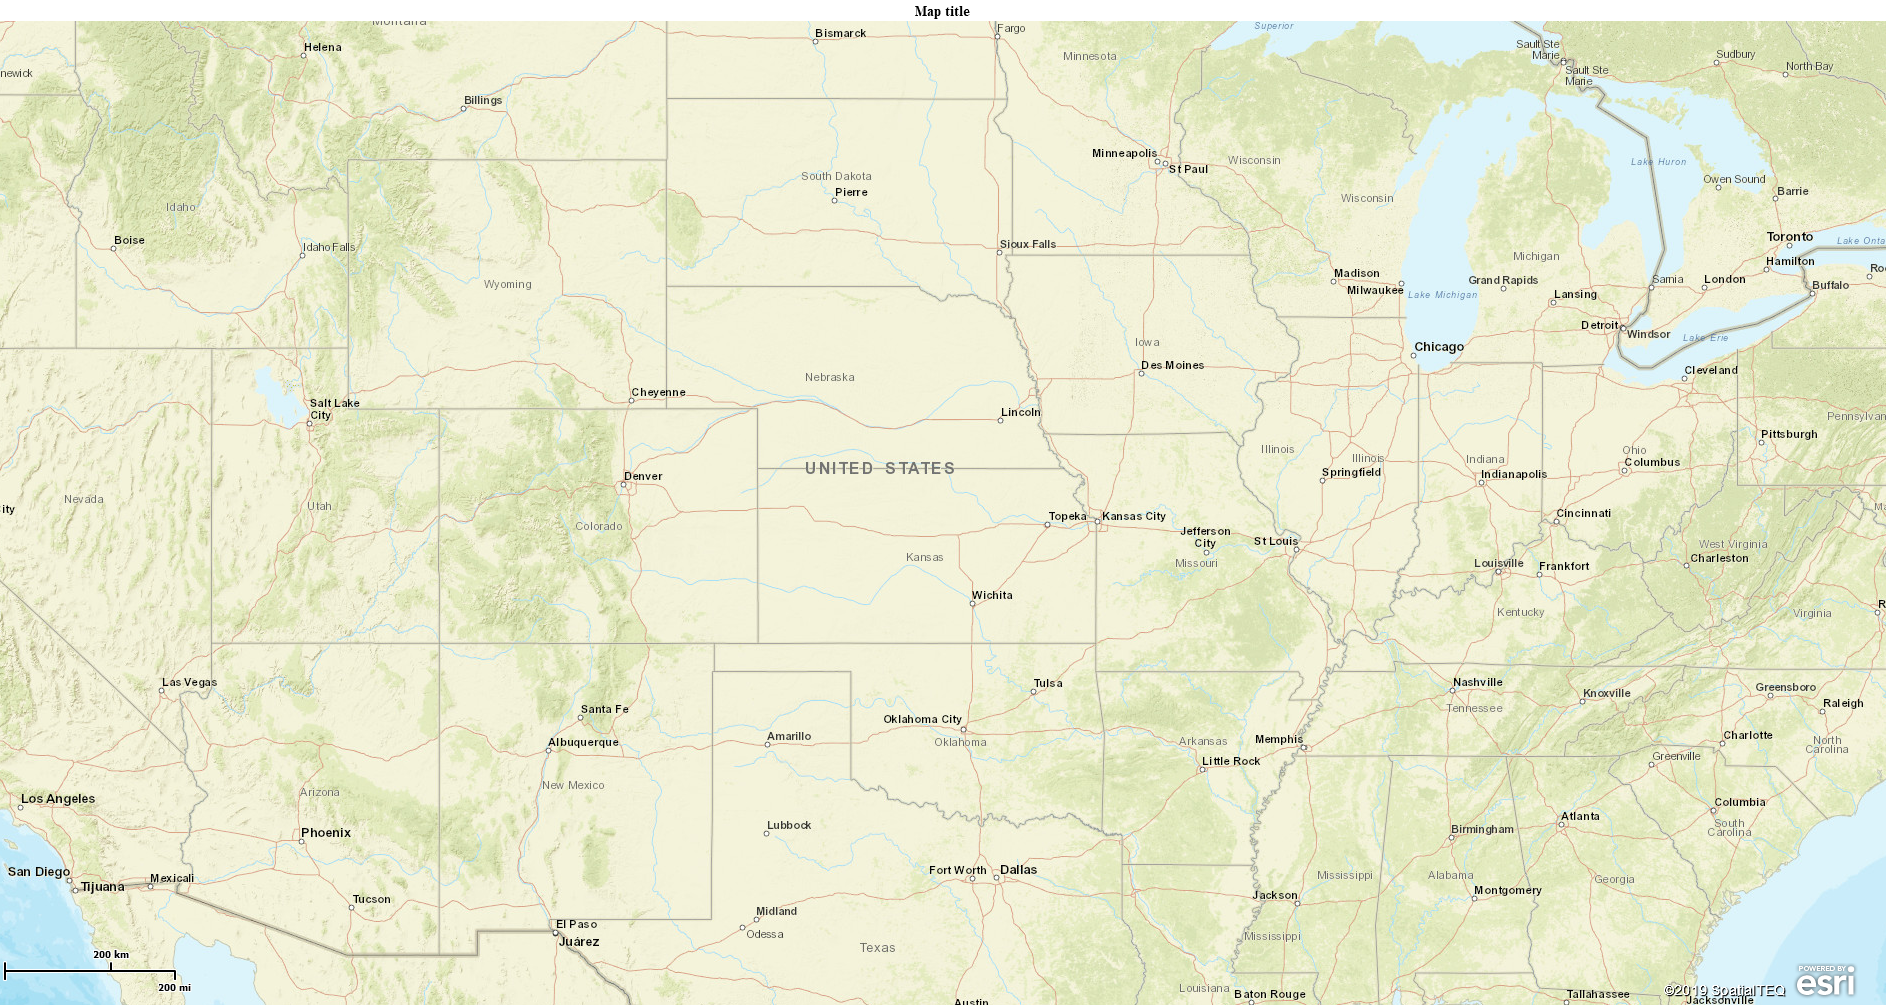
A basic business map often includes a map background, optional in Map Business Online. The lowest checkbox in Map and Data controls the background map options. The options noted as Streets and National Geographic include cities. These city details or points on the background map display larger cities only when viewed at a broad view or a nationwide level. Smaller cities and towns show up only when zoomed in.
This web mapping characteristic, to display map objects like cities in a graduated style related to Zoom levels, is common across all business maps. It controls the object placement on the map so that only limited and relevant map objects, ZIP codes, counties and cities show at the most expanded map view. This generalization controls map clutter and eliminates overlapping map objects on the map. Think about it? Should small towns be displayed on the map at a nationwide view? No. That would create a map with impossible to read text and would leave very little discernable relevant detail.
So, background maps help display more cities as the map view is zoomed in. To maximize the visual impact of cities in the map view, try adjusting the zoom level of your map view to optimize the background map cities displayed. For many business maps, this background map option works well.
Keep in mind, background maps are a tapestry of map visuals, not points or overlaid boundaries. These cities and other map objects cannot be queried.
City Map Layer
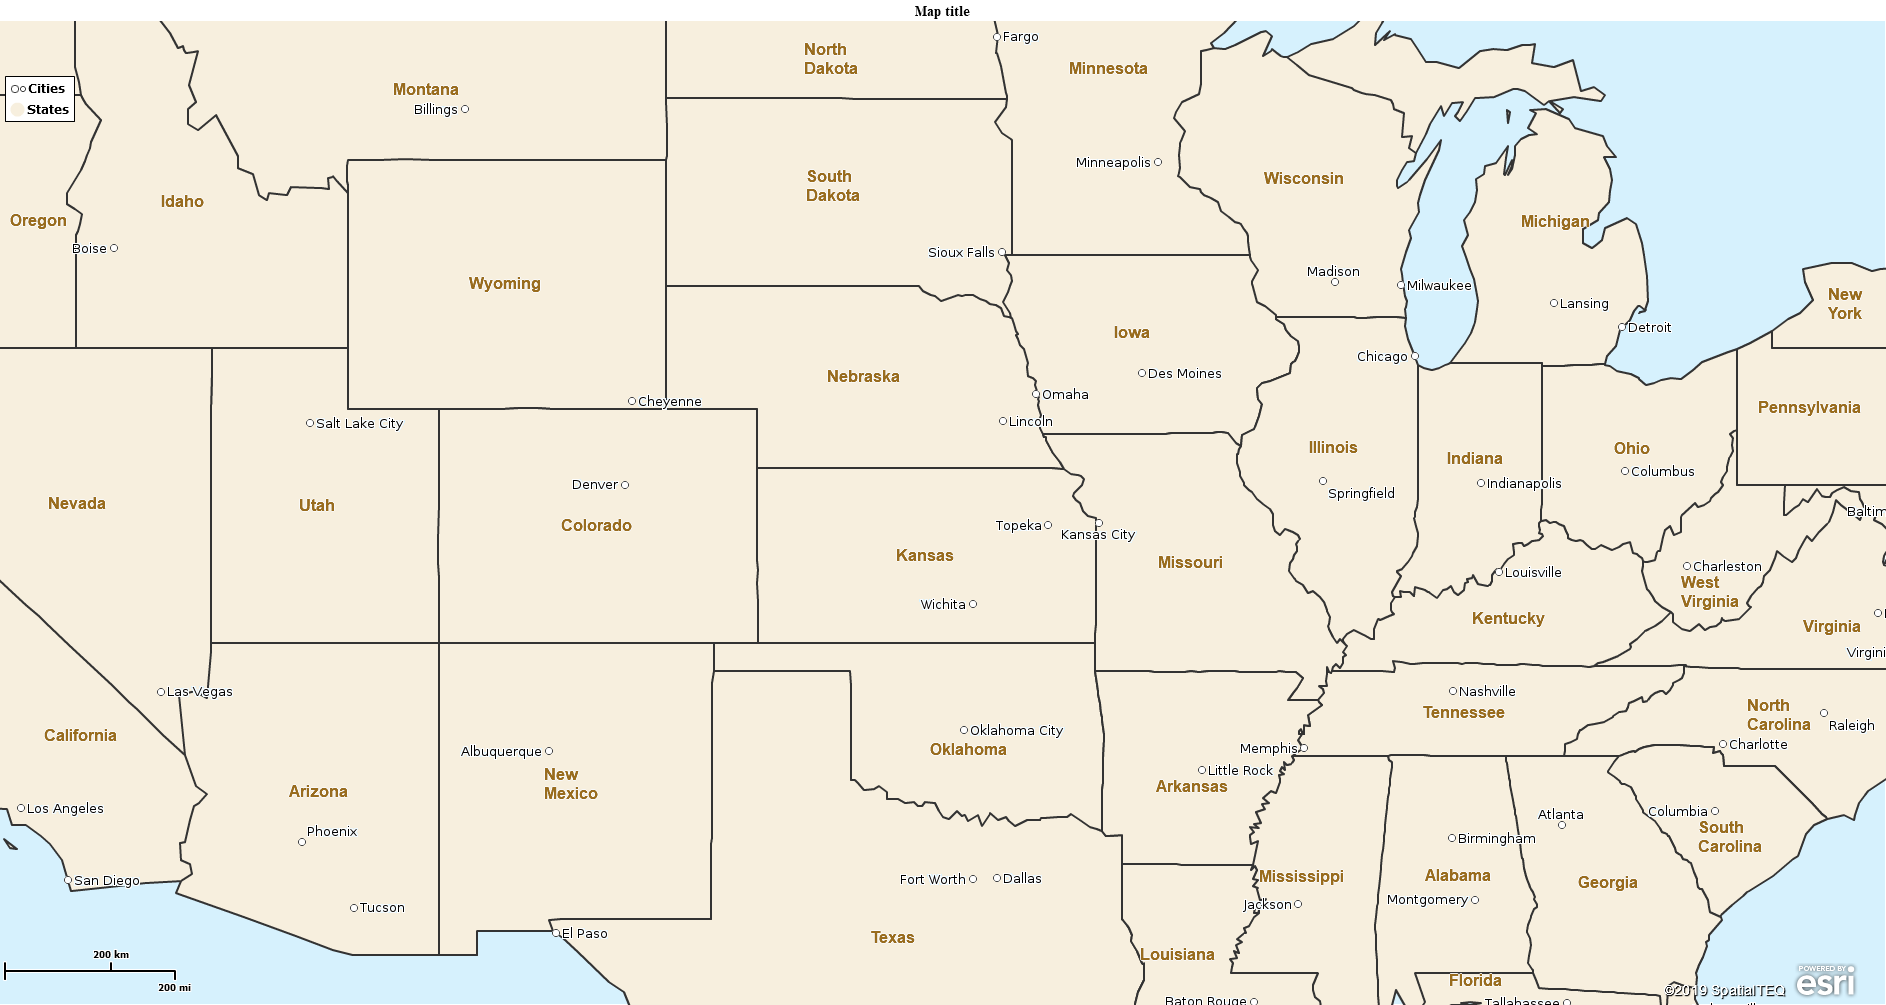
Map Business Online also provides additional map layers for more detail options, including query-able city layers that are searchable. The first of these city/town layer options is the Cites Layer. This layer, along with other additional map layers, is added to your map project from the Add Map Layers button, a blue globe seven buttons in from the left on the master toolbar.
Adding the Cities Layer to the map adds city points with a city label to your map. Just like the background map, larger, more populated cities display at the Zoomed-out levels, and more cities and smaller towns pop into view as the user zooms in.
The City Layer does not allow editing of these city points. The font and color are not editable. This layer is sometimes helpful for general city reference, where boundaries and color shading by city is not required.
City Limits Layer
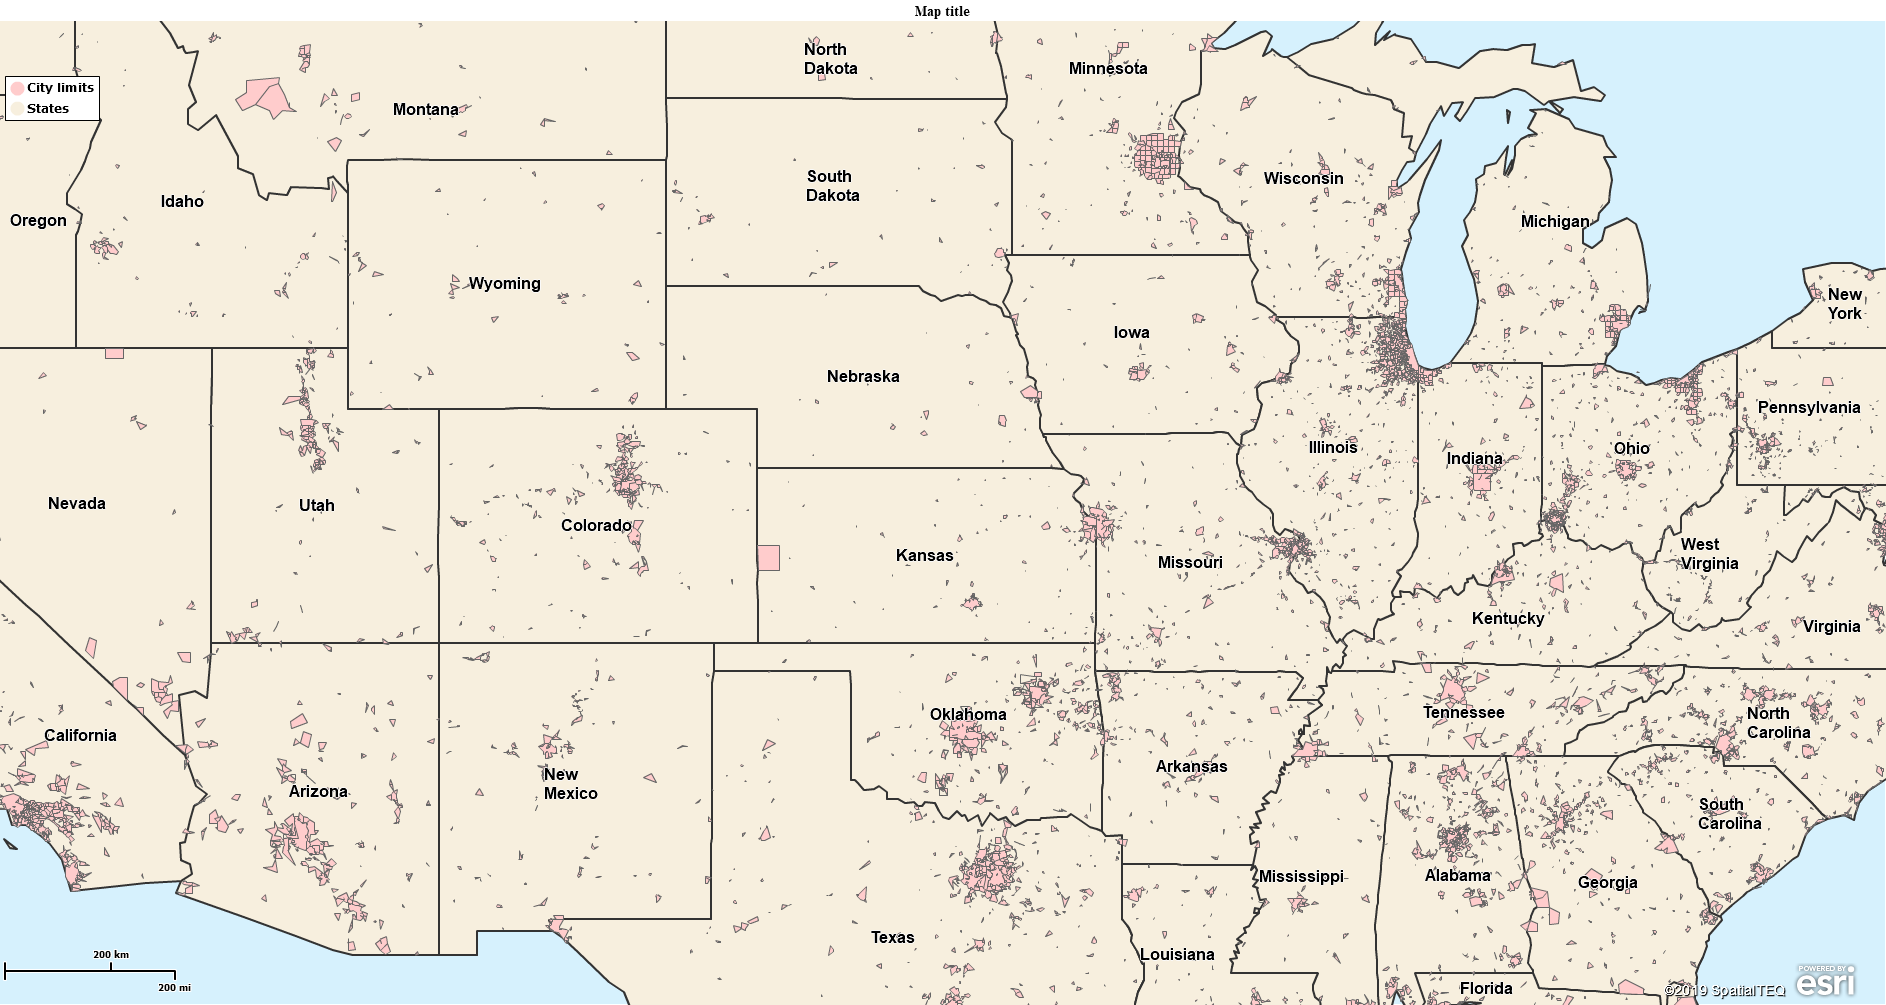
The second City layer available from the Additional Layer button is the City Limits Layer. This layer adds city boundary limits in addition to city labels to a user’s map project. The city limits layer is color shade-able just like the ZIP code or county layers.
The city limits layer has access to the demographic data library, to calculated data, and to imported user data layers for color shading, and label amendments. The city limits layer follows zoom level controls in a similar way to ZIP codes. At a nationwide view, smaller cities may not appear or may appear almost as points. Larger cities and towns will display boundaries and those boundaries will expand in scope, and more towns will appear, as the user zooms in.
City Limits data is great for city-based analysis. It is often used to build marketing models around urban or metropolitan areas. Keep in mind, the city limits layer is based on Census city and town limit boundaries. Places with tiny populations do not display boundary limits.
Public Data – Cities and Town
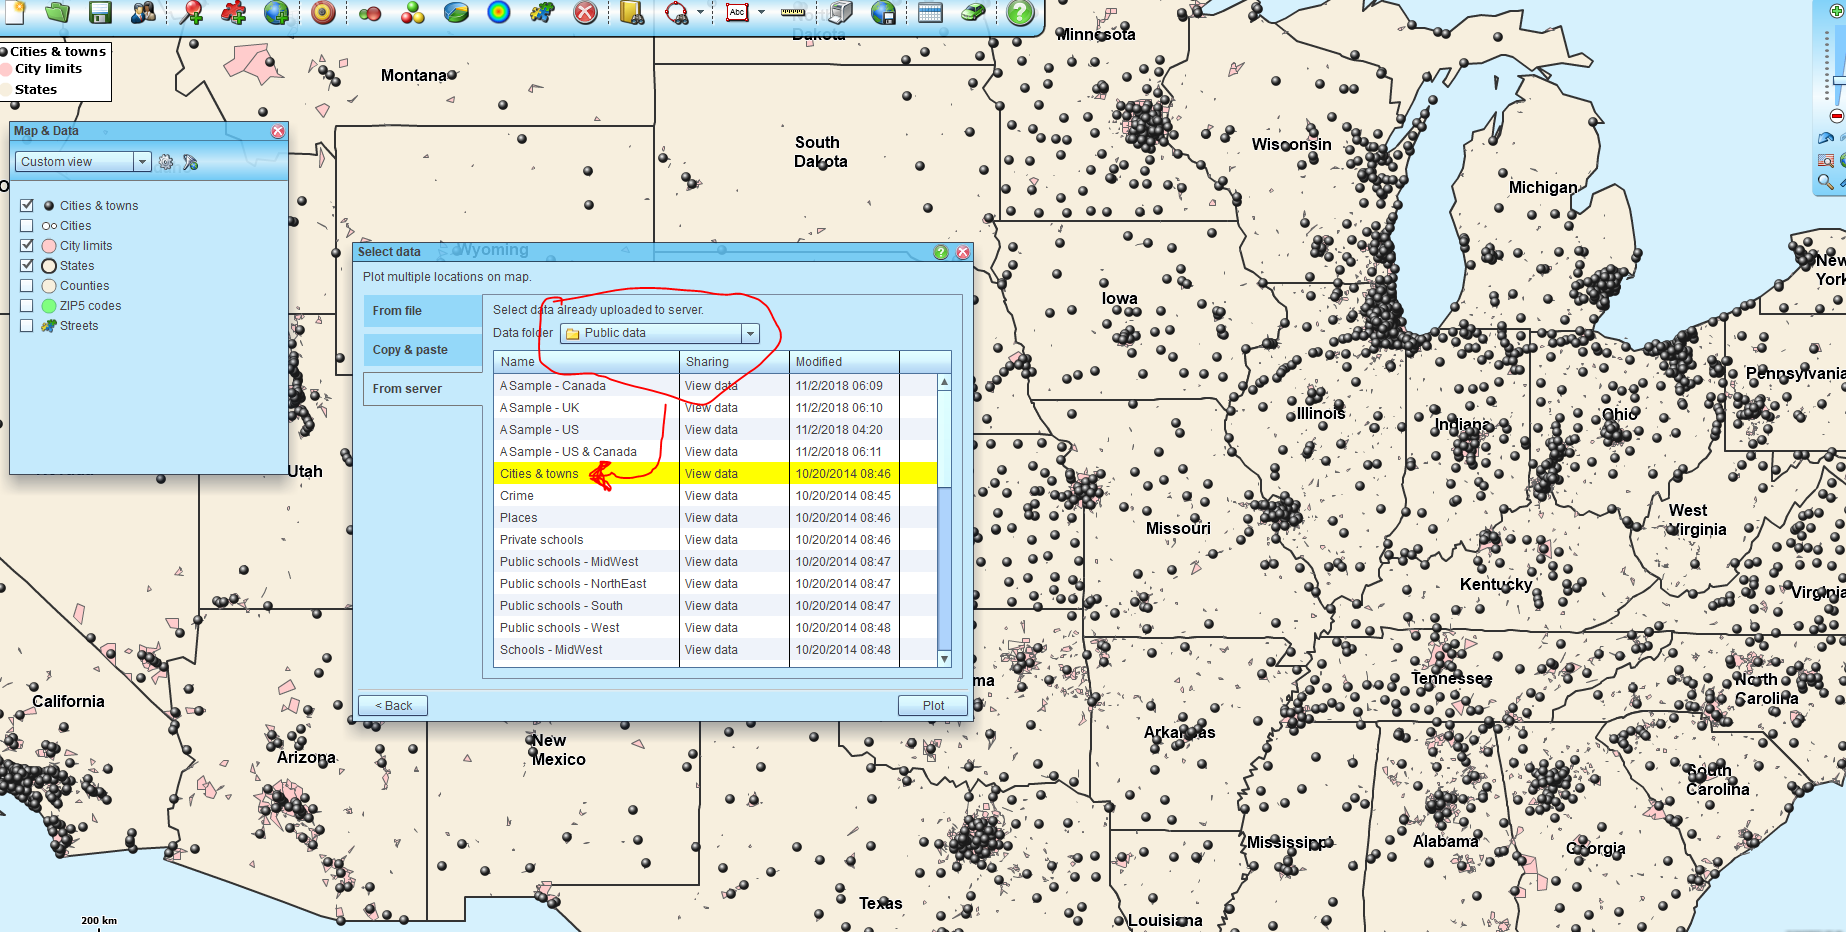
Map Business Online includes a set of public data sets that are available and supplemental data layers available for your map work. Access these layers by clicking the Plot Data button, then select the From Server option and choose Public Data.
The Public Data, Cities and Towns layer will plot 6,715 points on your map. Again, smaller cities or towns will come into view only as the user or viewers zoom into the map. The points imported as Cities and Town scan be symbolized and color-coded.
Import Your Cities
Occasionally, none of the Map Business Online options will display the cities you require at the zoom level you are comfortable with for your map audience. In this case, you can import cities as a spreadsheet for accurate placement on the map. This data will mirror the same import process and visualization options on the map as any other imported location point data set. Users will be importing city points.
Consider the MSA Layer Too
Also available in the Map Business Online add data layer options is the MSA or Marketing Statistical Area layer from the Census Bureau. This map layer acts like the City Limits layer or the ZIP code layer. But it’s significance is that it combines regional urban areas into city-level market areas. These are broader areas encompassing multiple cities.
Tweaking Your Cities
With your map project nearing completion one of the layers that is often used is city-data. If cities are critical to your map’s purpose, we recommend trying all the included city-data options available and described above. Observe how each city-layer helps your map communicate or detracts from the map’s ability to share information.
Experiment with different zoom levels and background map options. And remember, placing a point in incrementally for a particular city or town you want to highlight in a certain map view, is OK to do. Make your map sing by trying all the options available in your Map Business Online bag of tricks.
__________________________________________________
Are you using the Map Business Online Desktop App for MAC or PC? It’s hipper than Instagram and it comes with your subscription. Escape Web-Browser Tyranny!
Value-Added Resellers – Offer the tool to your customers as a reseller. Make money on training and consulting. Contact us with further interest in reselling Map Business Online.
Win a $20 Gift Card! Refer a business associate to Map Business Online in exchange for a $20 Amazon Gift Card!
America’s best geo mapping software.
Find out why over 25,000 business users log into www.MapBusinessOnline.com for their business mapping software and advanced sales territory mapping solution. The best replacement for Microsoft MapPoint happens to be the most affordable.
Discover Map Business Online – tools for making business maps


