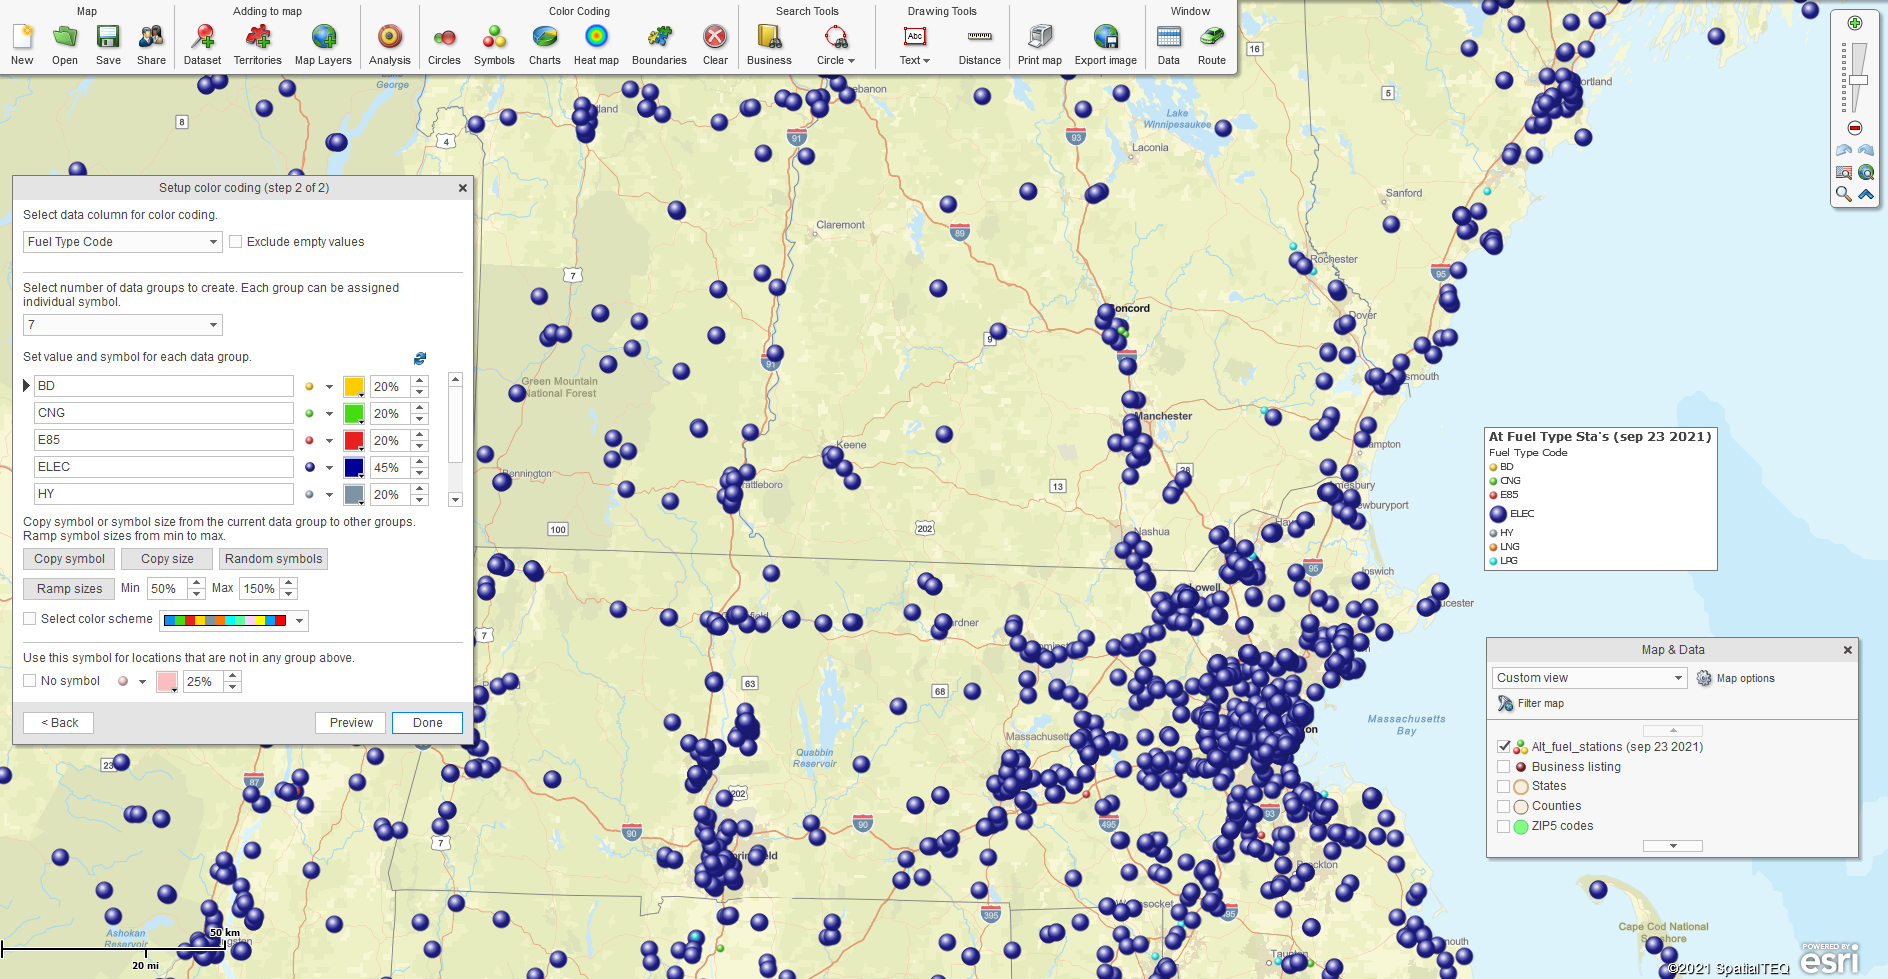
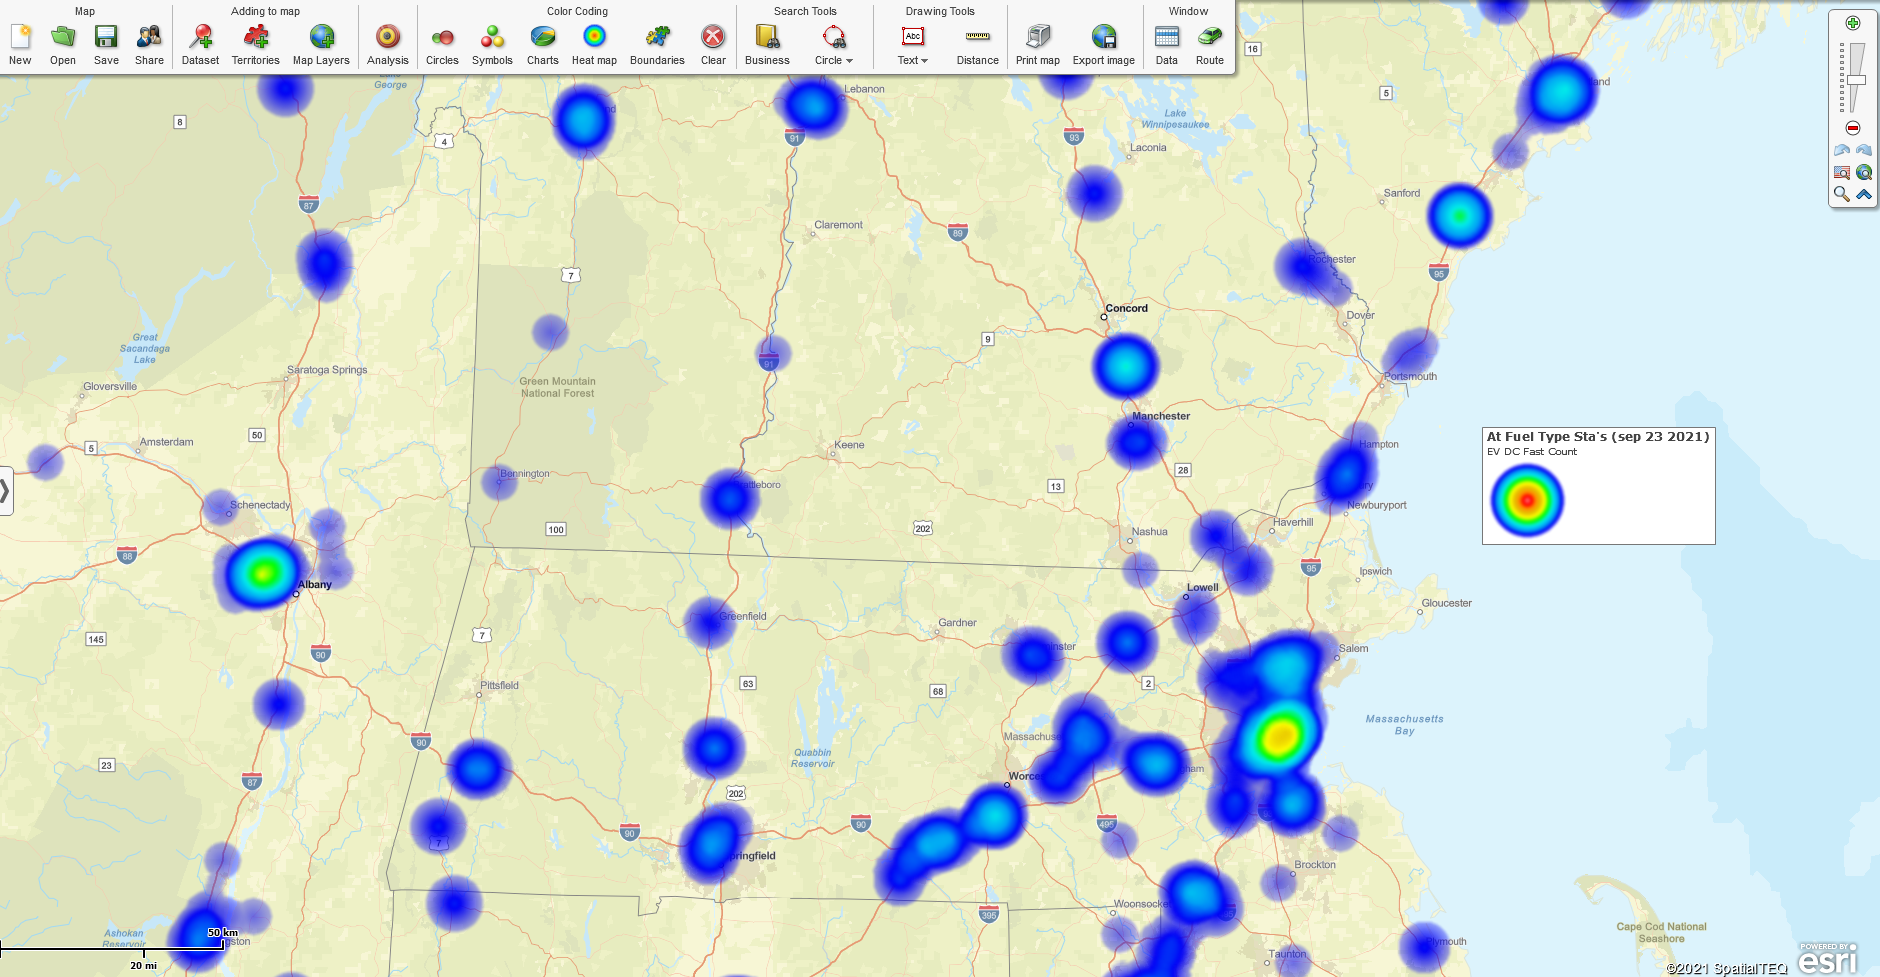
This week, a user contacted us looking for a location dataset of all Electric Vehicle Charging Stations across North America. They thought MapBusinessOnline business listings might have this dataset.
I knew MapBusinessOnline Business Listings data did have some EV Charging records, but when I viewed the data, it was less than 2,000 points nationwide. I knew this data was inaccurate. I suspect that NAICS and SIC Industry code databases haven’t caught up with consumer demand for EV Charging Stations. So, to Google, it was.
As it turns out, the U.S. Dept. of Energy has an alternative fuels data center. Here, I was able to locate and download a dataset of 57,420 alternative fuel service stations.
The data is geocoded by latitude/longitude, which imports sweetly into MapBusinessOnline. In the Data Window, I filtered the data by Fuel Type = ELEC and discovered that Electric Charging Stations make up 50,263 of the total number. Not bad.
To apply such a Filter in our MapBusinessOnline business mapping software:
- Click the Funnel icon on the Data Window toolbar.
- In the dialogue box, on the right, select the imported data. On the left side, set the modifier dropdown to ‘=’ and insert the fuel type column option ‘ELEC’ for electric.
- Click Filter in the lower right, and he results will display in the Data Window.
Filtering results are both exportable and available for territory and marketing list creation. Read more about data filtering in MapBusinessOnline.
Now, having bothered to import this not insignificant dataset of alternative fuel stations into MapBusinessOnline, what else can we do with it?
Color-Code by Point
Color-coding data points is a fundamental and popular feature of almost all business mapping tools. A Dot Density map view can be visually stimulating when you have upwards of 5,000 points in the map view. (Not Niagara Falls visually stimulating, but maybe Christmas sweater visually stimulating.) Color-coding by data point generates a map visualization of imported data.
The imported dataset of alternative fuel stations provides at least seven types of fuel under Fuel type. My approach is to color-code on the Fuel Type column, making the non-electric points small and the electric points appropriately visible. After all, for our stated purposes, we’re just concerned with Electric Charging Stations.
With such a point color-coding process, our map can focus on the charging stations locations. The map creator can append additional data to five flexible label fields or Callouts associated with each point with a little more effort. Callout labels can be turned on by default, turned on incrementally by clicking a point, or viewed as pop-up labels activated by cursor hovering.
Read more about labeling here.
Present the Data as a Value in a Circle
Along the MapBusinessOnline master toolbar, under Color-Coding, is an option for ‘Circles.’ This symbolization option allows the map-maker to replace the dots or points on the map with adjustable circles that display the text value of an Excel record within the circle.
This view can be valuable if the geocoded records on display include a critical numeric value. The decision to display a circle with numeric data will probably be made based on how critical that numeric value is to the map viewer’s decision-making process.
A dense field of numeric circles can be a lot of data for the human brain to process from a business map visually. Try to make the point layer on the map easy to read for your map viewers:
- Keep colors easy on the eyes.
- Make the most crucial point the most important color.
- Make sure to explain map points and numbers using text boxes, the map legend, or map layer labels.
Color-Code by ZIP Code
Another approach is to color-code the ZIP code layer by the imported EV Charging Stations. This approach allows the point layer to be turned off entirely and lets the ZIP code layer provide a quick visualization describing the number of charging stations available within a given ZIP code.
If the map viewer decides they need to have more details, they can turn the imported data layer back on and scan the details in the Data Window.
Color-shaded ZIP code maps are sometimes called heat maps. MapBusinessOnline also includes a ‘heat map’ view that converts a point layer into a colored intensity layer like a weather map showing severe storm activity.
Read more about color-coding point layers.
Turn Up the Heat Map
MapBusinessOnline heat mapping combines the clustering perspective of a dot density map with the numeric value intensity of an imported data column. Choose the Heat Map button, select your data and your desired numeric value column within the data, and then adjust the color and intensity options as required. MapBusinessOnline makes it easy to reset the data visualization process and try different color and intensity schemes.
Charts and graph options are as available as data visualization tools. These Excel-like data depictions are best applied where multi-year data exists by location point. Year-over-year sales reports, or demographic trends over time, can be display for points on the map.
Whether your data is energy, retail, healthcare, or insurance-related, nearly all industries can benefit from the transformative process of visualizing your business data against a compelling map view.
_______________________________________________
Find out why over 25,000 business users log into www.MapBusinessOnline.com for their business mapping software and advanced sales territory mapping solution. The best replacement for Microsoft MapPoint happens to be the most affordable.
To access MapBusinessOnline, please register and then download the Map App from the website – https://www.mapbusinessonline.com/App-Download.aspx.
After installing the Map App, the MapBusinessOnline launch button will be in the Windows’ Start Menu or Mac Application folder. Find the MapBusinessOnline folder in the Start Menu scrollbar. Click the folder’s dropdown arrow and choose the MapBusinessOnline option.
The Map App includes the Map Viewer app for free non-subscriber map sharing.
Please read customer reviews or review us at Capterra, or g2crowd
Contact: Geoffrey Ives geoffives@spatialteq.com or Jason Henderson jhenderson@spatialteq.com


