MapBusinessOnline combines an accurate and easy-to-use business mapping software with the Census Bureau’s library of demographic data. I thought exploring a few sorted, and filtered views of demographic data as applied to a business map might be helpful.
Let’s jump right into Median Income. The demographic categories include overall median income levels and the number of people who make specific gradations of income. There’s a difference.
Suppose we add Median Income for a year to the map by the City Limits layer. In that case, we can color-code that information by City Limit and apply a descending sort from highest to lowest Median Incomes.
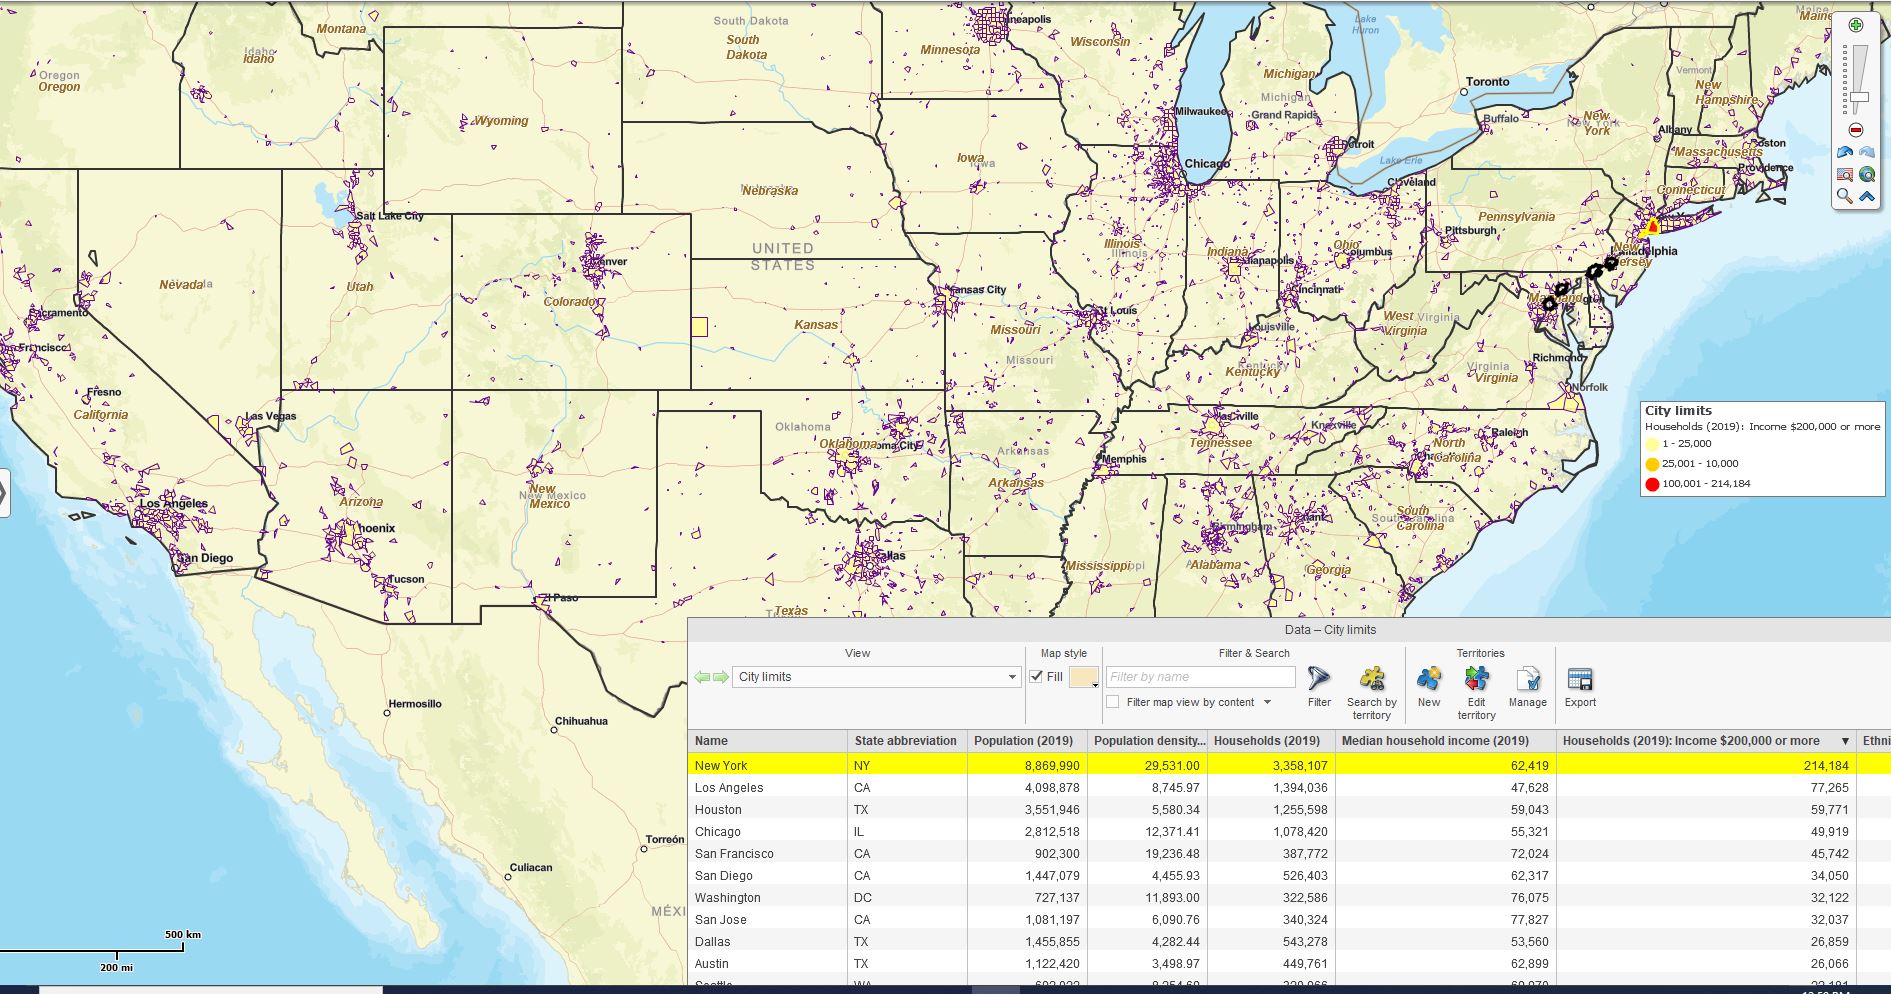
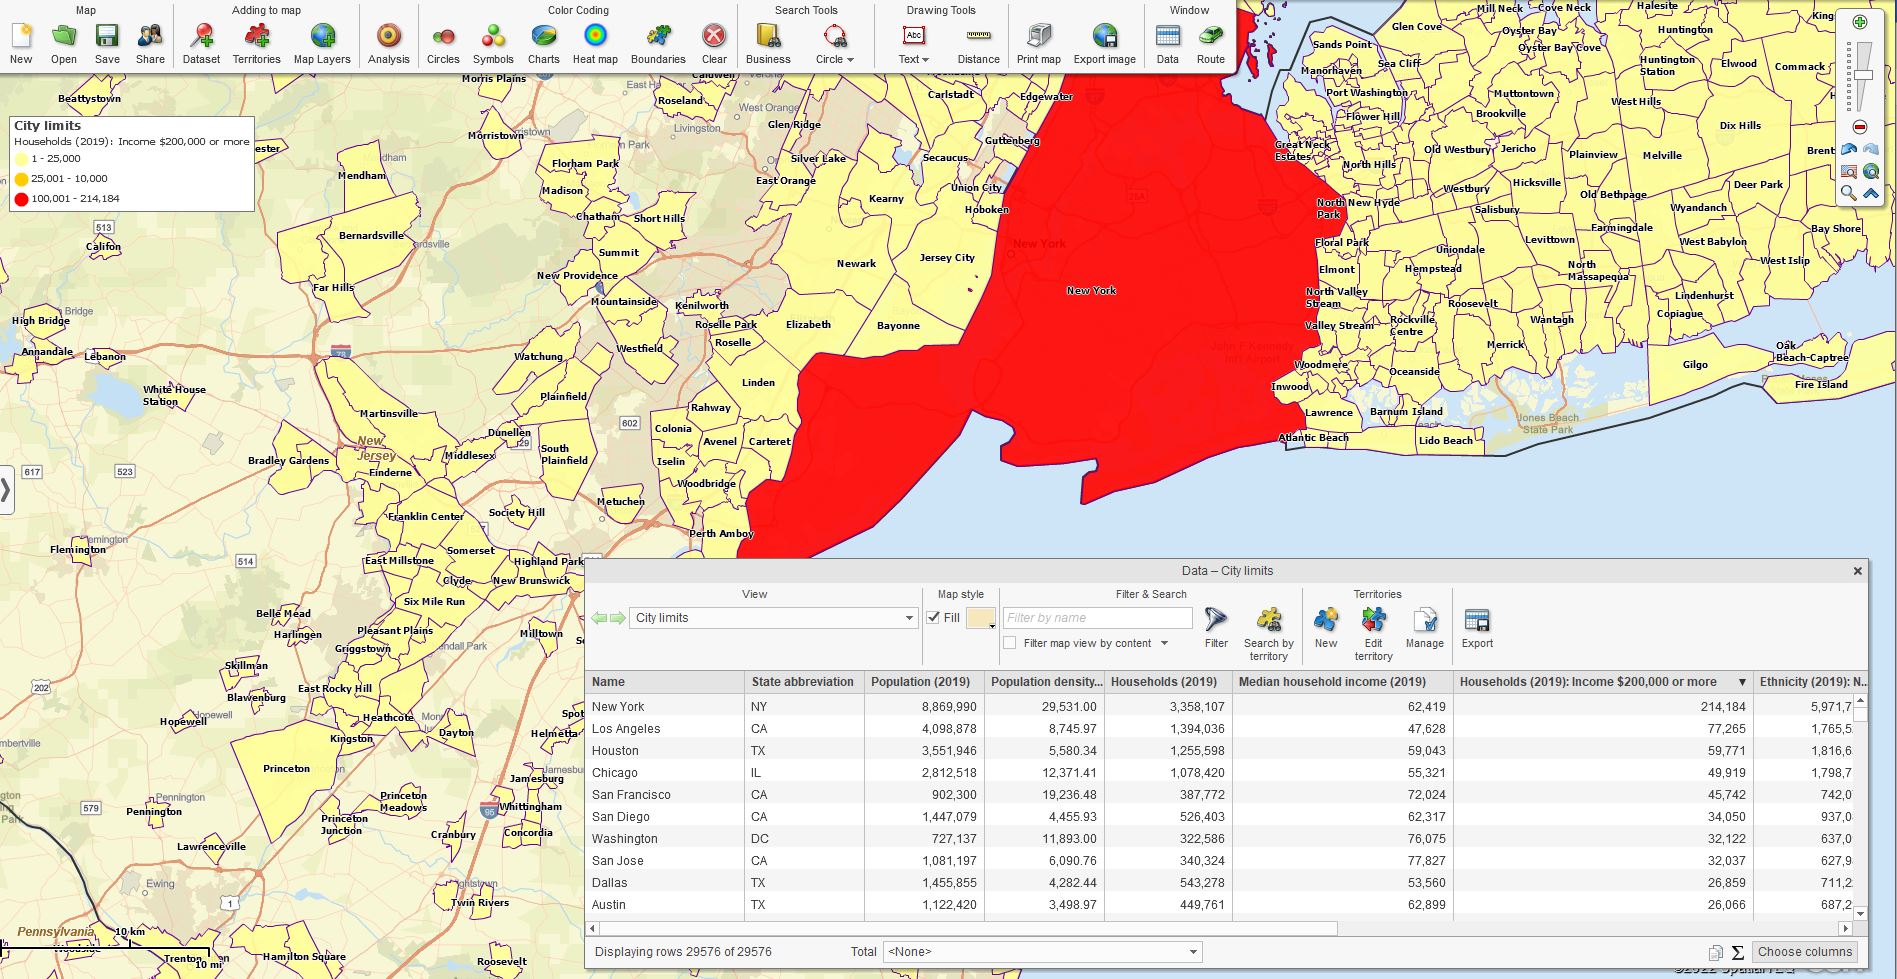
This thematic map view exposes the city areas with the highest number of households with income levels higher than $200,000. There’s only one city limit area with more than 100,000 households with income levels higher than $200,000 – New York City.
This thematic map reflects the number of households with the highest income.

Number of Households by City with Income Over $200,000.
Zoomed on New York City:

Most Households with Median Income Over $200,000
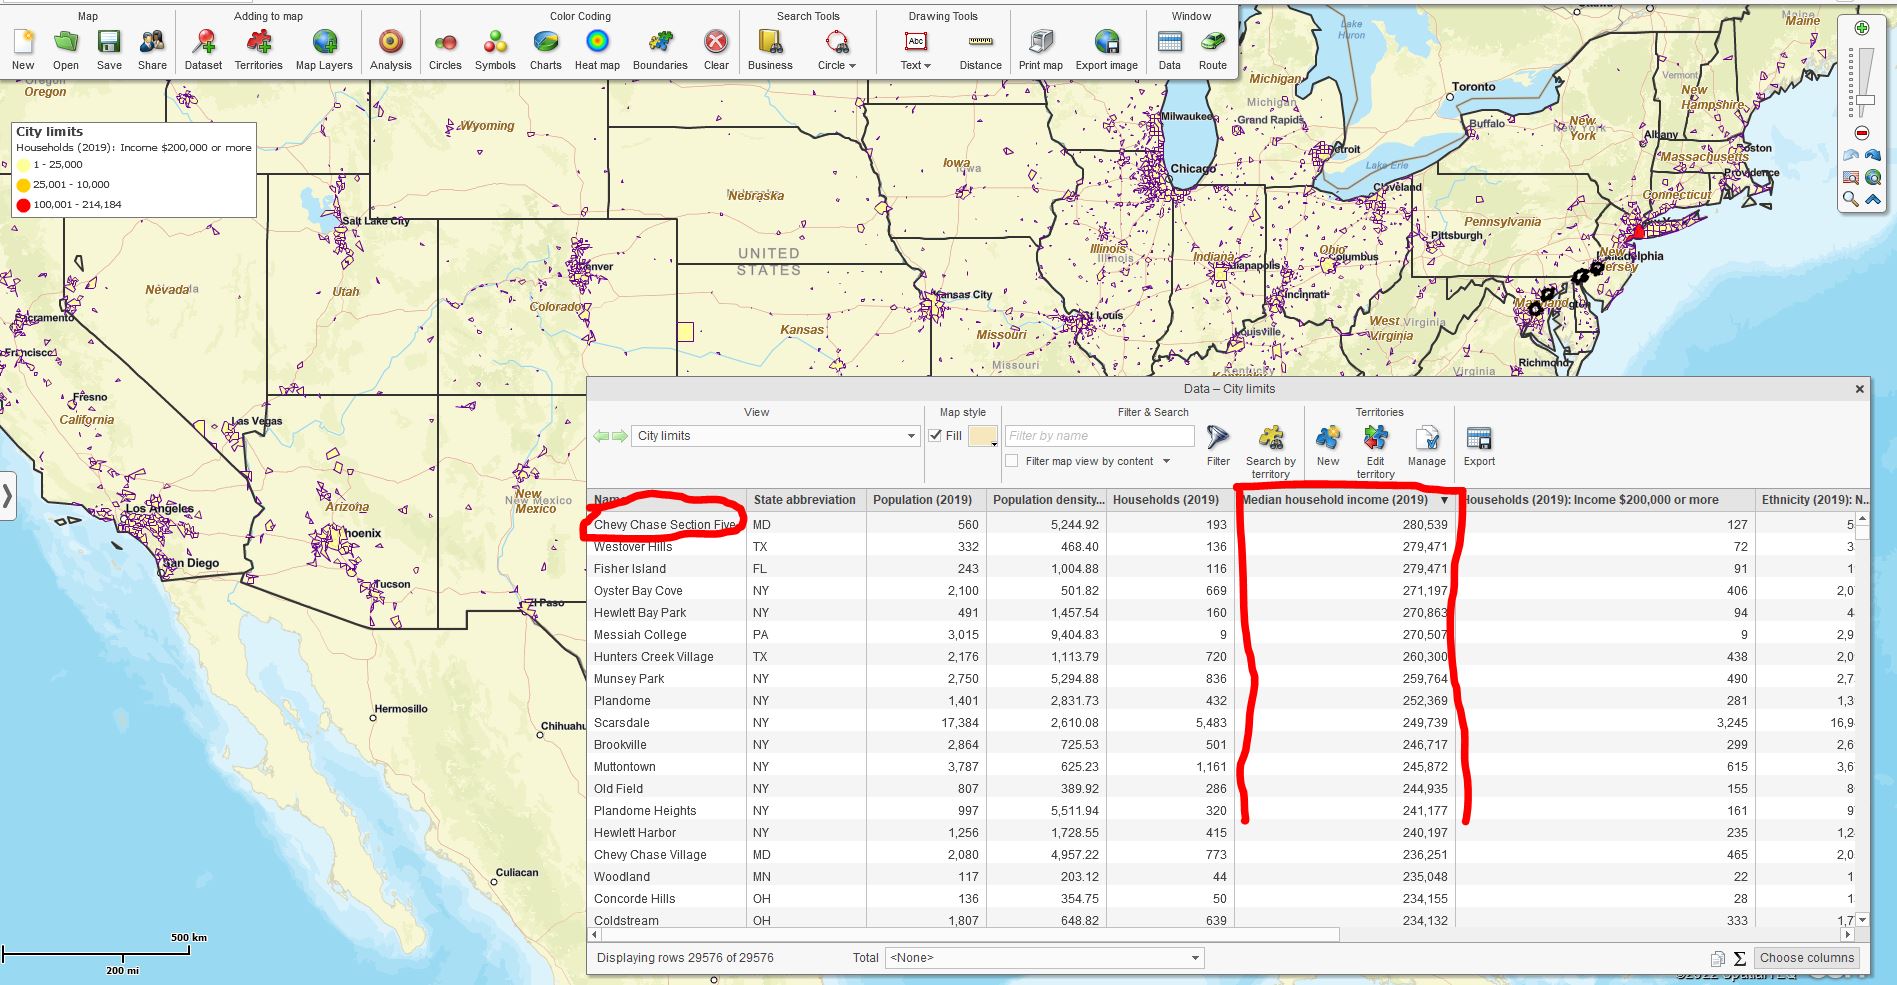
Alternatively, one can look at the tabular view of the City Limits map layer and add the column of demographic data: Median House Hold Income (2019). This result shows the highest income values by city. Median income means the values indicate the median point (not the average) between the highest and lowest.
The following analysis displays Median Income by dollar value. You can filter the results to show the top X cities. My map displays the top 20 cities with the highest median income. New York City is not on that list. Chevy Chase and other cities have more median income in general.

Chevy Chase has the Highest Median Income Level.
One possible conclusion from this analysis, comparing the number of high-income households to the highest median-income cities, is that retailers should focus first on New York City based on the number of households with high income and the population density. If you can make it there, you can make it anywhere. It’s up to you..retailer.
At any rate, the map creator can export that list of top 20 Median Income cities and send it to colleagues for discussion and decision-making. Perhaps you’ve got outlets in New York and are looking to expand elsewhere.
Additional Helpful Demographic Categories
Demographic data from the Census Bureau included in MapBusinessOnline offers hundreds of subjects, many with multiple numeric segments. I’ve found particular subjects to be very helpful:
- Hispanic and Non-Hispanic Populations – Generalizing assumptions about ethnicities can be tricky, but there are practical reasons for considering ethnic backgrounds. Certain products sell well to specific groups, so race is essential from a marketing perspective. For instance, business requirements for hiring Spanish-speaking employees can make such analysis necessary.
- Consumer Expenditures – General categories of consumer expenditures are helpful in broad definitions of market potential, perhaps informing site selection options or finetuning an addressable market.
- Housing and Rental Data – Great for real estate market considerations by region. Helpful for financial institutions too.
- Head of Household Data – Female or Male head of household categories tends to vary by region, income, and other factors. Still, analysis of employment opportunities by the city can benefit from these segments.
Explore the categories accessible from your MapBusinessOnline subscription to find demographic categories that may apply to your specific industry.
Gather the Children and the Old Duffers
Age Segmentation – Breaking down populations by age, income, and ethnicity by segment can help expose specific demographic trends. The demographic data includes population by age, households by median income levels, and other segmented breakdowns.
Demographic segmentation provides a way to drill deeper into the data. For instance, home care agencies can look at specific age sections and analyze those segments against relevant business data. They might determine that the females, ages 75 to 79, have significantly higher incidents of broken ankles and other injuries, which could lead to new preventative measures across the agency.
MapBusinessOnline has a feature called Calculated Data Columns that allows the map creator to combine multiple demographic segments of like values for analysis by map layer. The Calculated Data Columns tool allows the map creator to present all households with median household income levels from $75,000 to $149,000 – three demographic segments – by ZIP code and consider the segment’s estimated purchases of Personal Care Products over the last two years.
The map creators and marketing managers can get creative with their analysis. Calculated Data Columns by City or Market Area (territory) is the perfect tool for:
- Defining an addressable market. Explore the various demographic segments by area and jurisdiction. Drill into demographic details to better match product use cases to population segments.
- Finetuning a site selection process. Create ZIP code or area demographic profiles. Know as much as possible about where you are successful today and bring that information to bear on new operation sites.
- Developing franchise market territories. Connect product or service offerings with known demographic prospect pools. Justify the franchisee’s investment.
Census Bureau Demographic data categories enable demographic mapping. These visualization and analytical capabilities are made for each other, like peanut butter and jelly or lobster and melted butter.

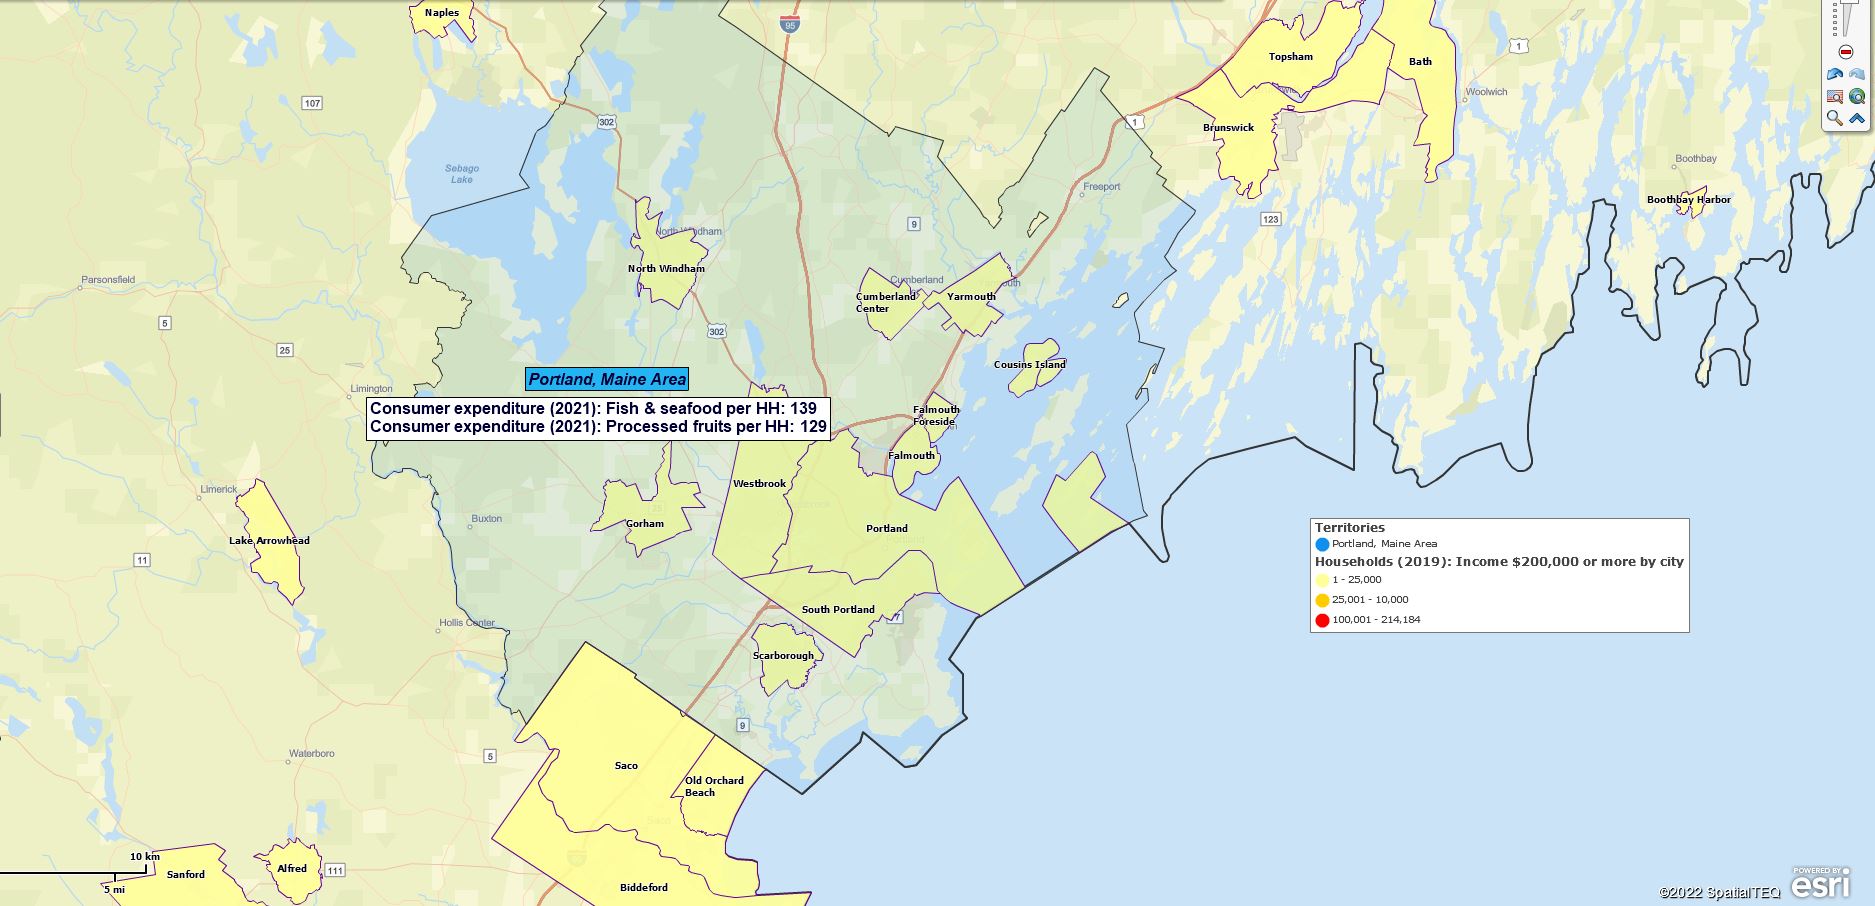
Lobster and Jelly Sandwich.
Which, BTW, would be included in the demographic categories:
- Fish and Seafood per HouseHold.
- Processed Fruit per Household.
_______________________________________________
Discover why over 25,000 business users log into www.MapBusinessOnline.com for their business mapping software and advanced sales territory mapping solution. The best replacement for Microsoft MapPoint happens to be the most affordable.
To access MapBusinessOnline, please register and download the Map App from the website – https://www.mapbusinessonline.com/App-Download.aspx.
After installing the Map App, the MapBusinessOnline launch button will be in the Windows Start Menu or Mac Application folder. Find the MapBusinessOnline folder in the Start Menu scrollbar. Click the folder’s dropdown arrow and choose the MapBusinessOnline option.
The Map App includes the Map Viewer app for free non-subscriber map sharing.
Please read customer reviews or review us at Capterra or g2crowd.
Contact: Geoffrey Ives at geoffives@spatialteq.com or Jason Henderson at jhenderson@spatialteq.com
