MapBusinessOnline provides subscribers with access to demographic data. By the way, the most recent Census Demographics have been updated in MapBusinessOnline as of Nov 2023. The recent 2020 Census decennial counts are identified in the list as ‘Census 2020.’
We’ve discussed in previous blogs how to quickly query a circle figure on a business map, a ZIP code, or a County for demographic data. We also explored setting up territories and adding demographic data using the Choose Columns button from the Data Window.
Another helpful tool MapBusinessOnline provides is the Calculated Data Column (CDC) function. Calculated Data Columns enable the creation of data formulas. The tool is located in Map and Data.
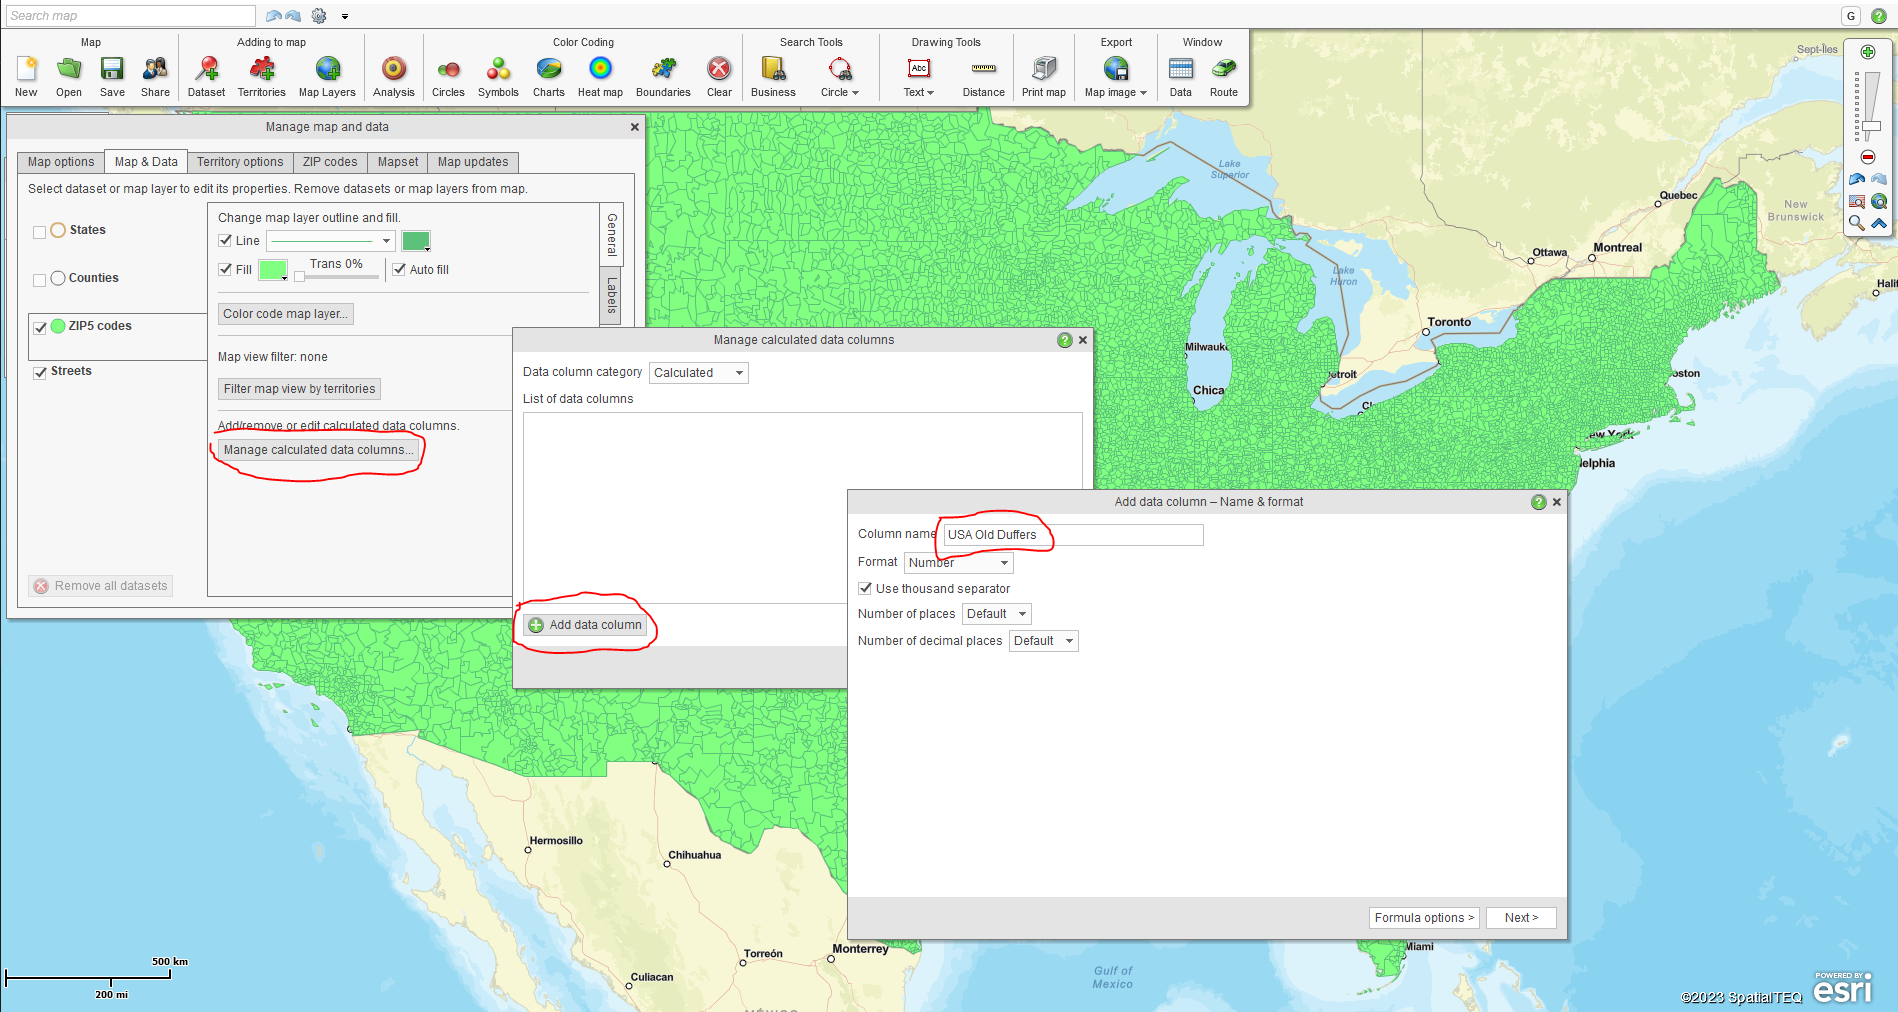
Within Map and Data, each map layer (ZIP Code, County, or State) has its own Calculated Data Column function. Hover your mouse cursor over the target map layer in Map and Data and select the Edit Map Properties Gear. In the corresponding dialogue, you’ll see the box at the bottom that says Manage Calculated Data Columns.
- Click Manage Calculated Data Columns.
- Click Add Data Column.
- Name the column.
- You can select the format for the calculation results – Percent, Number, Currency, etc.
- Manage numeric places and decimal places as required.
- It’s easy to go back and edit these selections later.
- When finished, click Formula Options.
- Select Simple Formula. Scripting is an option, too, but if you want scripting, you probably don’t require my assistance.
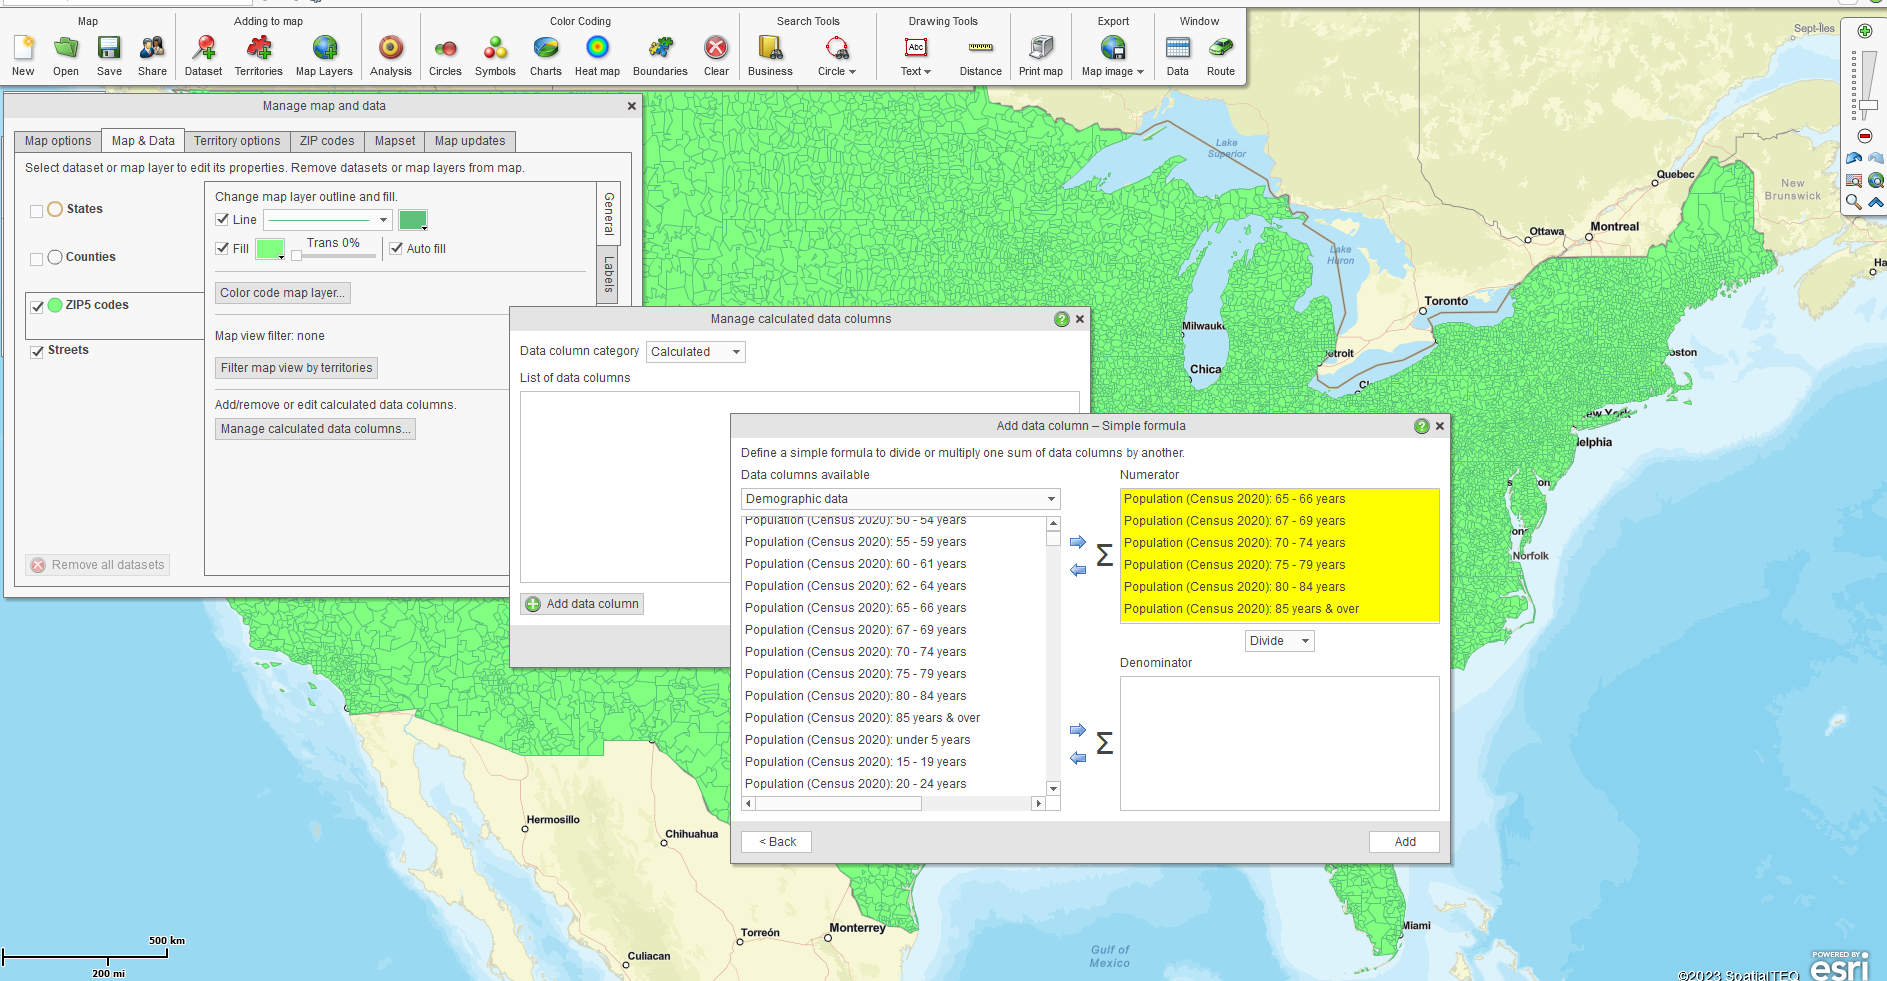
- In the Simple Formula panel, you’ll understand the power of CDC. Here, you can select demographic columns of data (or imported data columns) and move them to the right panel to build a formula.
- You can add columns together. For example, you can add multiple age segments to get a population subtotal that includes multiple demographic categories or columns.
- You could also create a ratio. For example, you could divide a gender population total by a total population to explore percentages.
- You can multiply the top section by the lower section. For example, you could multiply a currency column by a quantity column.
- With your formula factors applied, click Add in the lower right and exit the formula builder.
- To apply your Calculated Data Column for map visualizations or analysis, look for the data as an option within data dropdowns. CDC data is available when Color-coding by your target map layer, importing data into your territory analysis, or summarizing data. Remember, the formula is assigned to either a ZIP code, county, state, or city limits layer. This means if you set up a CDC in the ZIP code map layer, it will NOT be available for county and state-based operations.
A popular use case of Calculated Data Columns is collating similar Census category columns into a summed category total, which can then be applied across the entire map layer. Thus, for the map layer ZIP 5 codes, we could sum all ages of the population between 30 and 49 years. This CDC formula is then available for ZIP 5 code calculations using the Summary function, territory analysis for any area of ZIP 5 codes, and color coding ZIP 5 maps when using that saved map.
A Business Mapping Software Example of Calculated Data Columns
Let’s color code all USA ZIP codes to reflect the size of the population aged 65 and up.
- Create a new map using the USA template.
- In Map and Data, Edit the Zip 5 map layer.
- Select the Calculated Data Columns option.
- Name the Layer USA ‘Old Duffers.’

Creating a Calculated Data Columns formula named Old Duffers.
- Create the Formula. Move the selection of age ranges from the left side of the Demographic data into the top formula box on the right. Click Add.

Selecting data layers for summing.
- Exit out of Map and Data and Select the Boundary color-code option along the master toolbar.
- Select the ZIP 5 map code layer.
- Select the USA Old Duffer layer in the data options dropdown.
- Choose the map visualization options for optimum map display:
- I limited my color-coding to four variables.
- Adjust your color-coding tiers to reflect reasonable numeric shift points. I did this several times before settling on a scheme I liked. This will be reflected in the Map Legend. You can edit the Map Legend too.
- Select a color scheme and click Preview or Done.
- Repeat the procedure of color-coding to adjust the scheme.
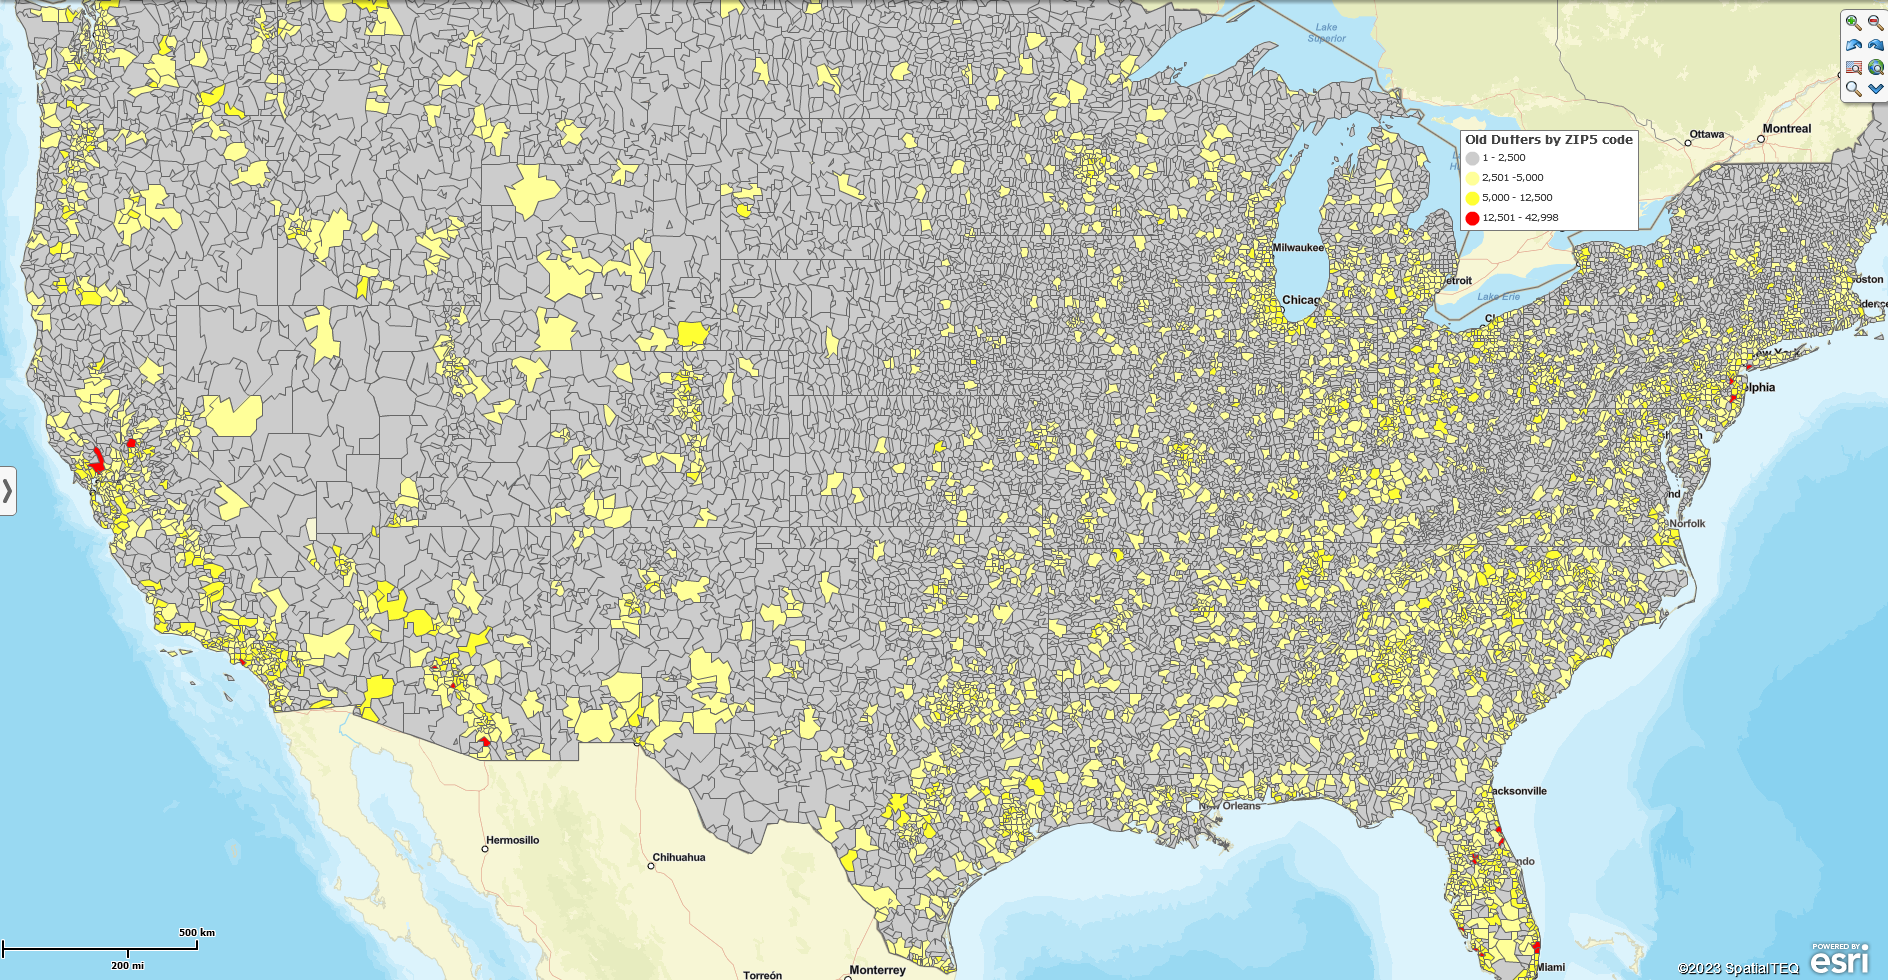
My final Older Americans Map:

Population of Older Americans by ZIP Code.

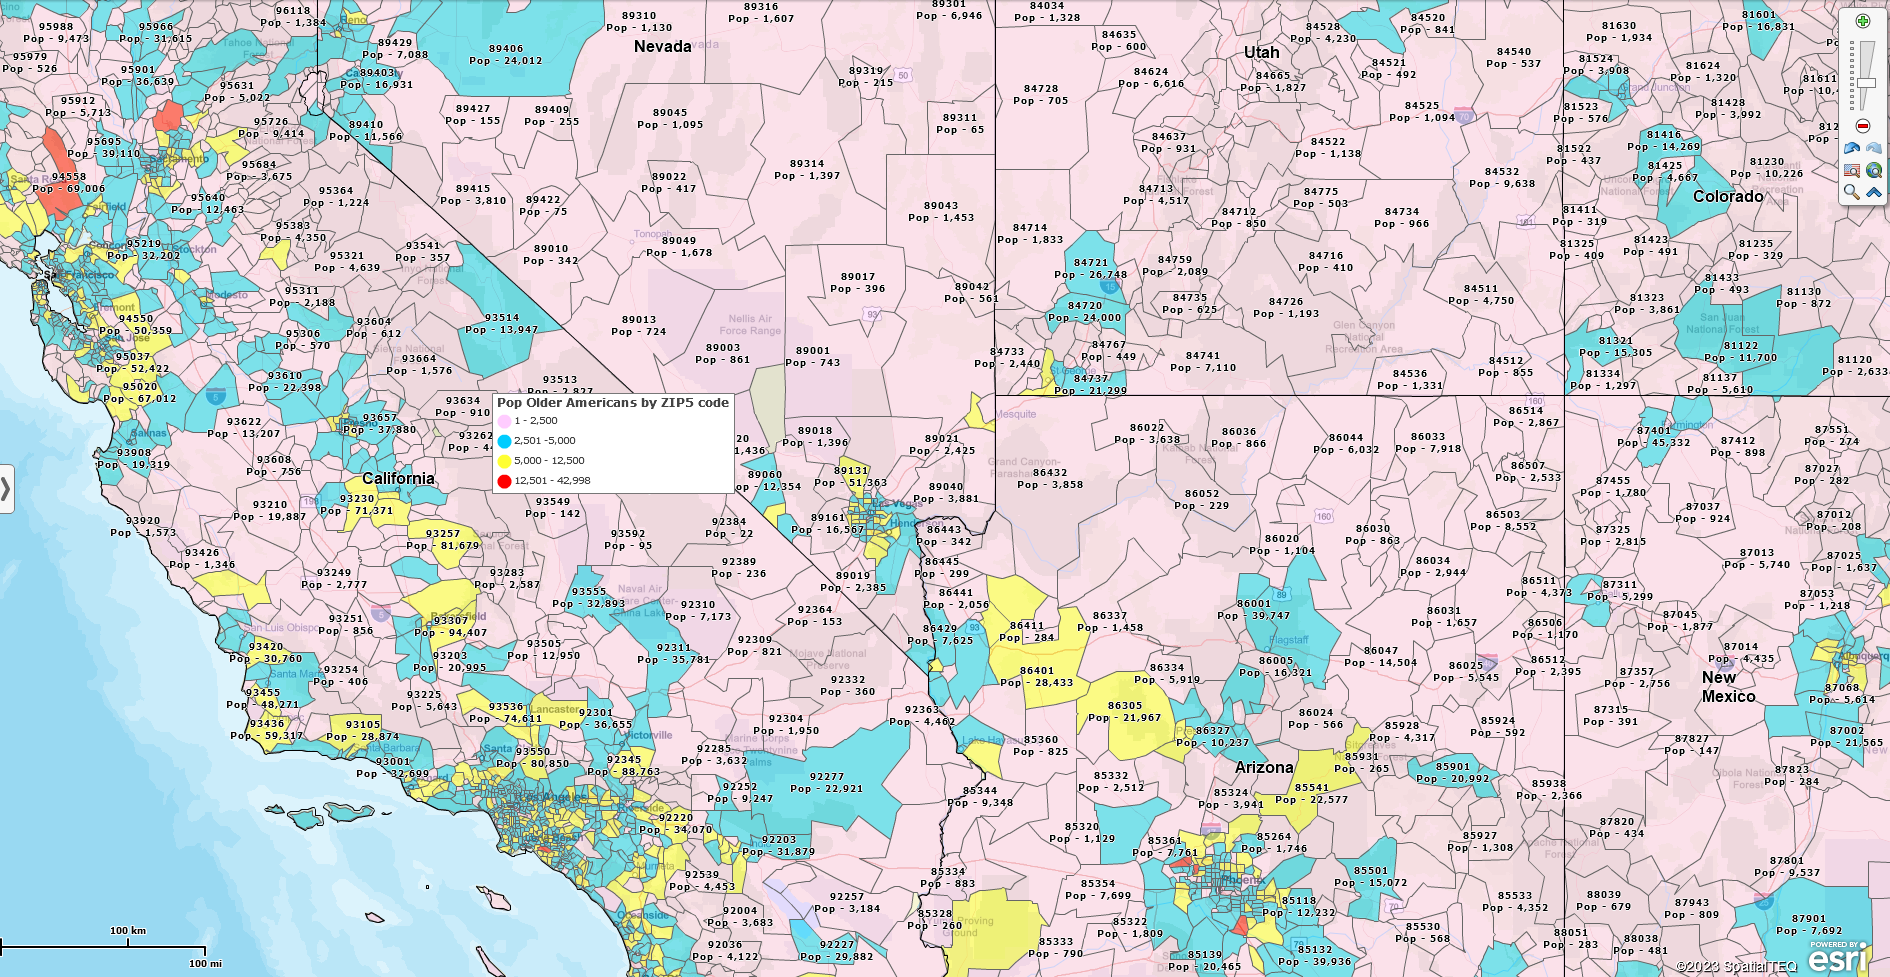
After a few more color adjustments, a few labels, and zooming into California,
And that is how you use Calculated Data Columns in MapBusinessOnline.com.
