
So, you are a new map creator. Congratulations! Or perhaps you’ve been creating maps for your business or several businesses for some time now. Have you established a regular workflow for your business mapping projects? It’s worth thinking about for several reasons:
- Map project requests will often require the same or similar map solutions used on previous maps, which means you could leverage work you’ve already accomplished toward a new map project.
- Often, it’s a good idea to stop working on a map project and walk away for a day or so. Returning to the project with fresh eyes can reveal new pathways to success. Remember, maps are a visual medium.
- Carefully save your map projects within MapBusinessOnline using the Save button on the Master Toolbar. The Save function provides a portfolio library for your occasional review.
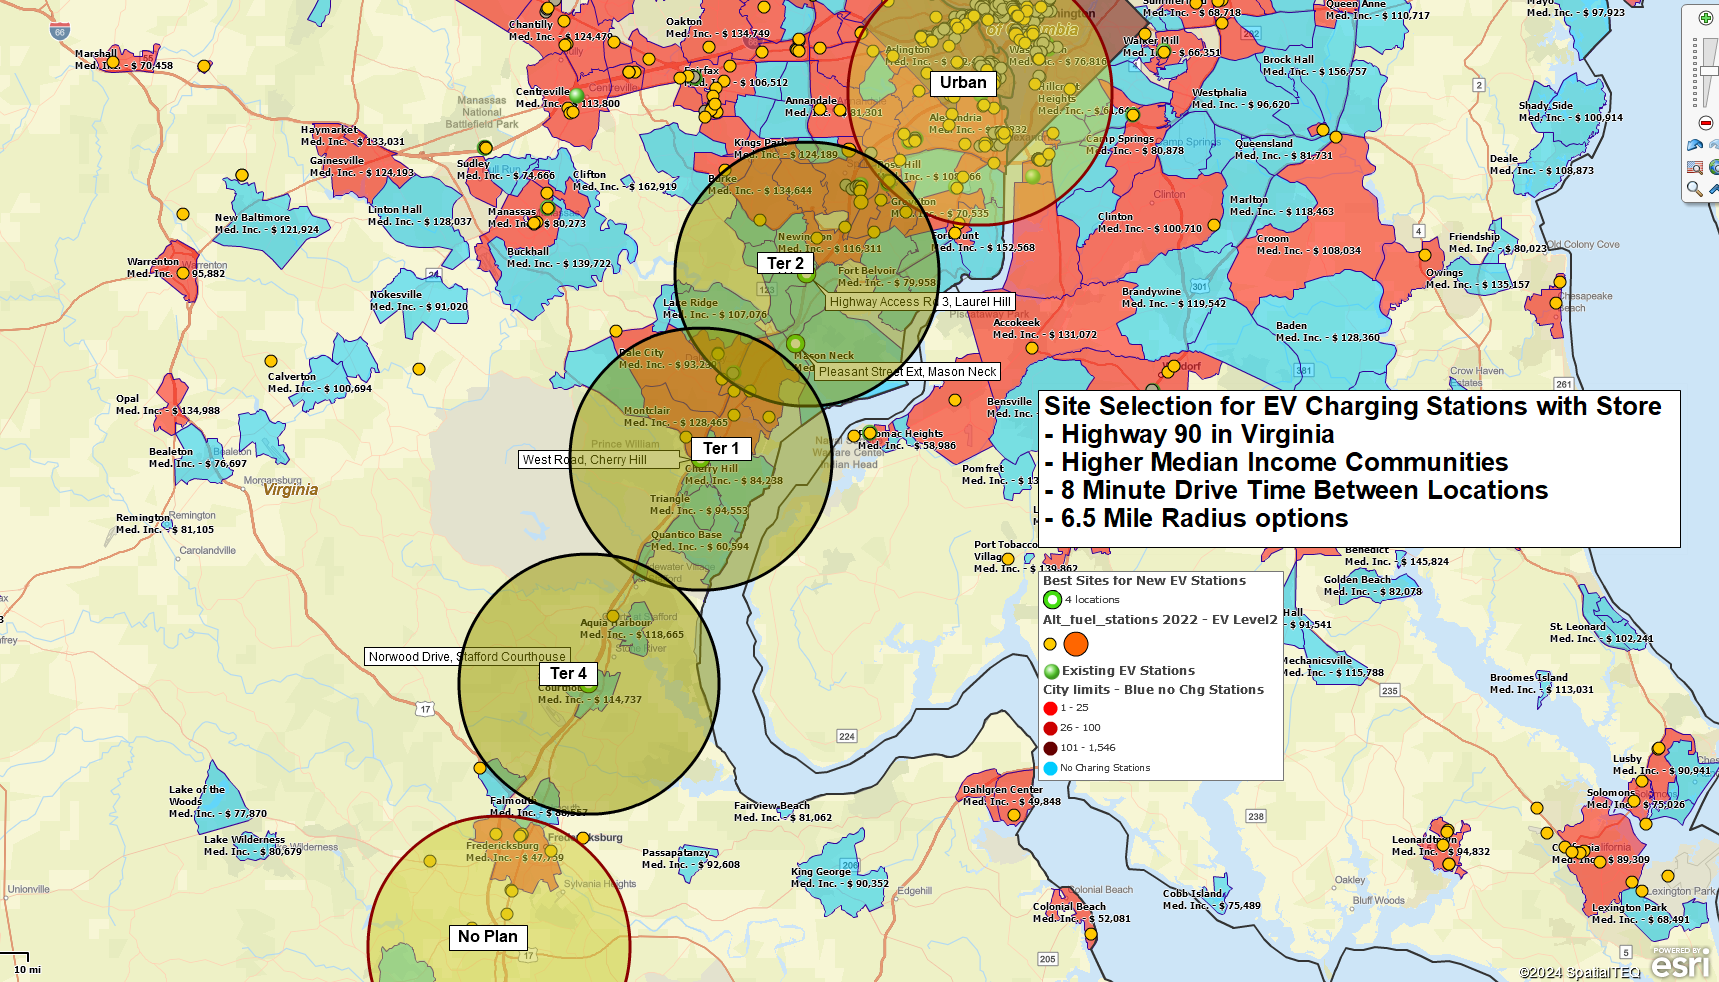
Radius-based territory mapping for business expansion planning.
Any map project, like other work or even home projects, will entail a series of steps to completion:
- Gather the requirements for your map project.
- Establish the goal of the map project. What business problem or process does it address?
- How will your project be measured? What measurement criteria will indicate that the map project is successful?
- What location data sources are available to support your map project, and where are they located? All map projects need location data. That’s how maps convey meaningful and relevant ideas. Make sure you have access to the necessary files.
- Understand your map project audience. Who will view and consider the map?
- Map projects reviewed by management or the executive office will impact your reputation. Keep this in mind as you develop your map project.
- Consider the map’s audience as you develop the project. Keep the map focused, uncluttered, easy on the eyes for executive team presentations, and well spell-checked.
- Decide what business or organizational topics are best presented by a business map.
- Review collected location data and all the associated data columns to determine which datasets import well and provide a relevant story or path to a solution via a map presentation.
- Determine which administrative map layers best support the map story – ZIP code, City Limit, County, or others.
- Are there saved map projects that approximate the project you’re about to create? If there are, open them, save them under a new filename, and proceed.
- Consider the ancillary datasets available within MapBusinessOnline that may be able to add value to your map project:
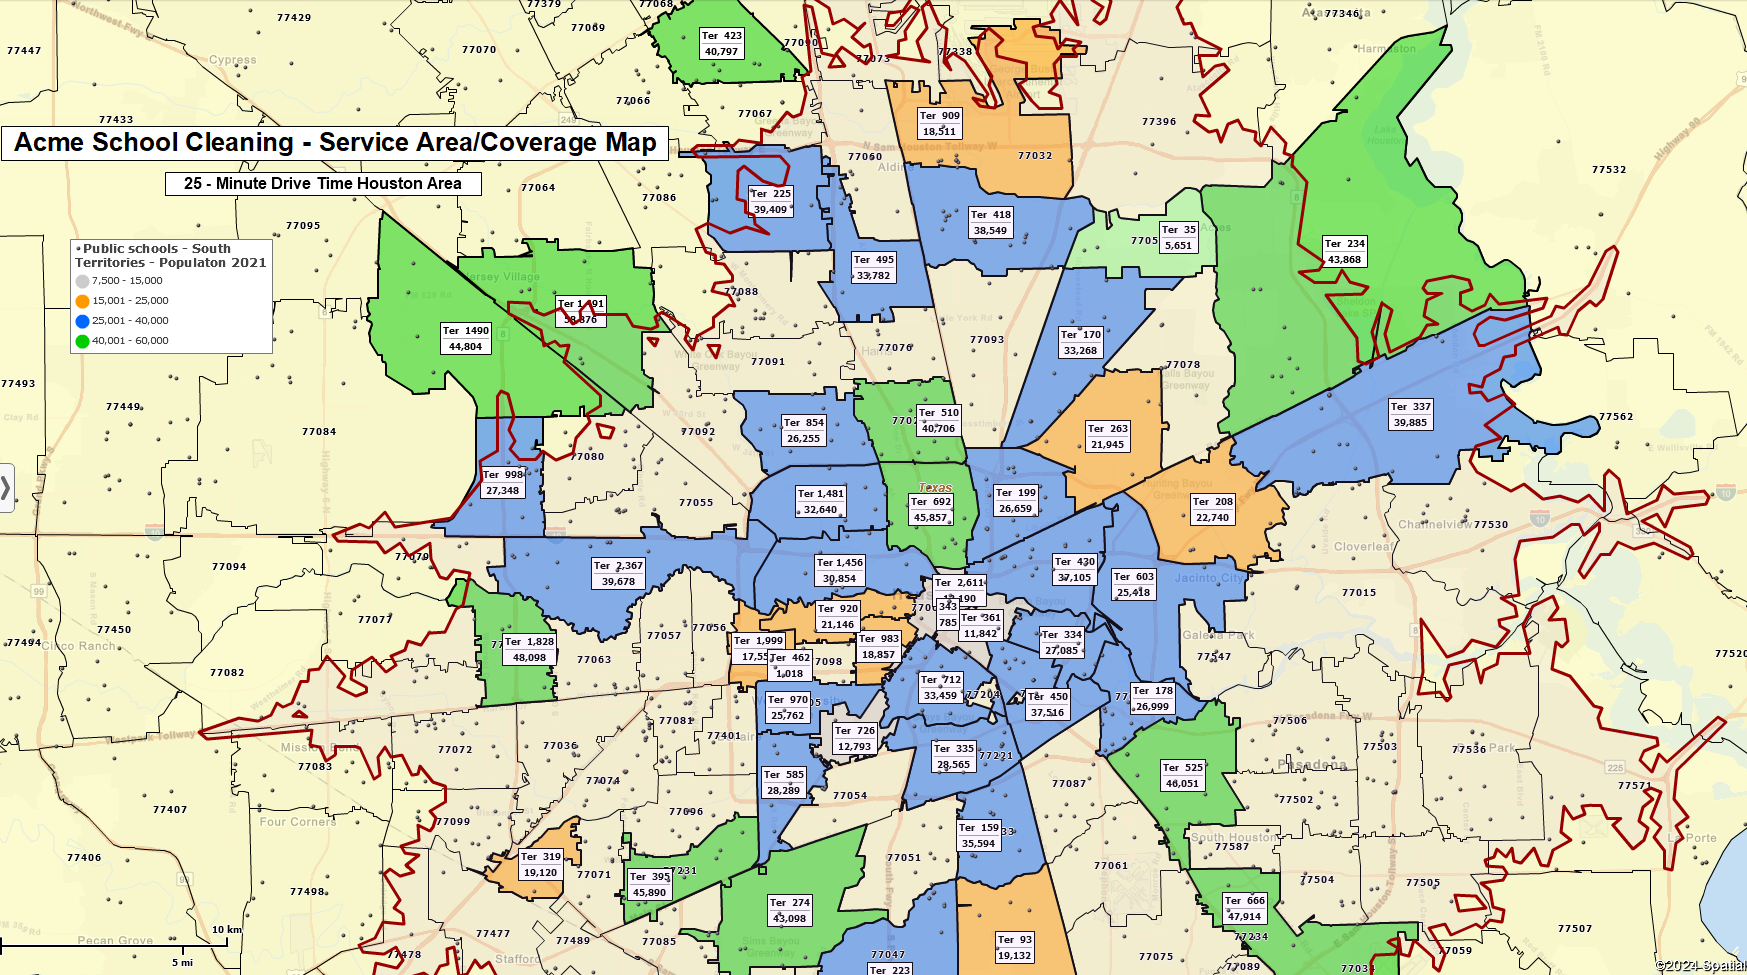
A service territory coverage map created using MapBusinessOnline.
Optimizing Your Map
Once you’ve imported your datasets over the map view, you can start honing your map to match the task. Create a first-pass MapBusinessOnline map with imported location datasets. Match the business map layers with your understanding of the problem or situation the map is supposed to address. Remembering the goal of your map project, look at the data layers. Ask yourself, do all the imported datasets add value to the map? Which datasets are critical to supporting the map’s intent?
MapBusinessOnline’s Map and Data box shows all your imported datasets and map layers. You can check off imported datasets and map layers one at a time. Find the datasets and map layers most critical to your map’s intent. Turn the other layers off. The map creator can always turn datasets and layers on to answer questions or make points.
Are the map layers you’ve selected relevant to the problem? For example, if you are exploring the reasons for repeated late deliveries to certain ZIP 3 codes, you probably do not need to show ZIP 5 codes or Counties on the map. Turn off the layers you do not need.
Generally, two map layers are enough to support a business map. Usually, ZIP 5 Code and State layers are turned on. Depending upon the distribution of your data, ZIP codes and City Limits can be applied. Do this judiciously. Only use map layers and datasets that add value to the presentation.
MapBusinessOnline provides the map creator with controls over the look and feel of the map. Map creators can adjust the following:
Map Layers – ZIP code, City Limit, County, State.
- Fill – On/off, color.
- Line – On/off, thickness, color.
Symbols
- Symbol – Symbol option, color, size.
- Heat map – Weather map intensity area based on numeric values.
- Circles with numbers – Circle color, size, and numeric value.
- Charts – Use chart or graph-style symbolization.
Learn more about adjusting the map look and feel.
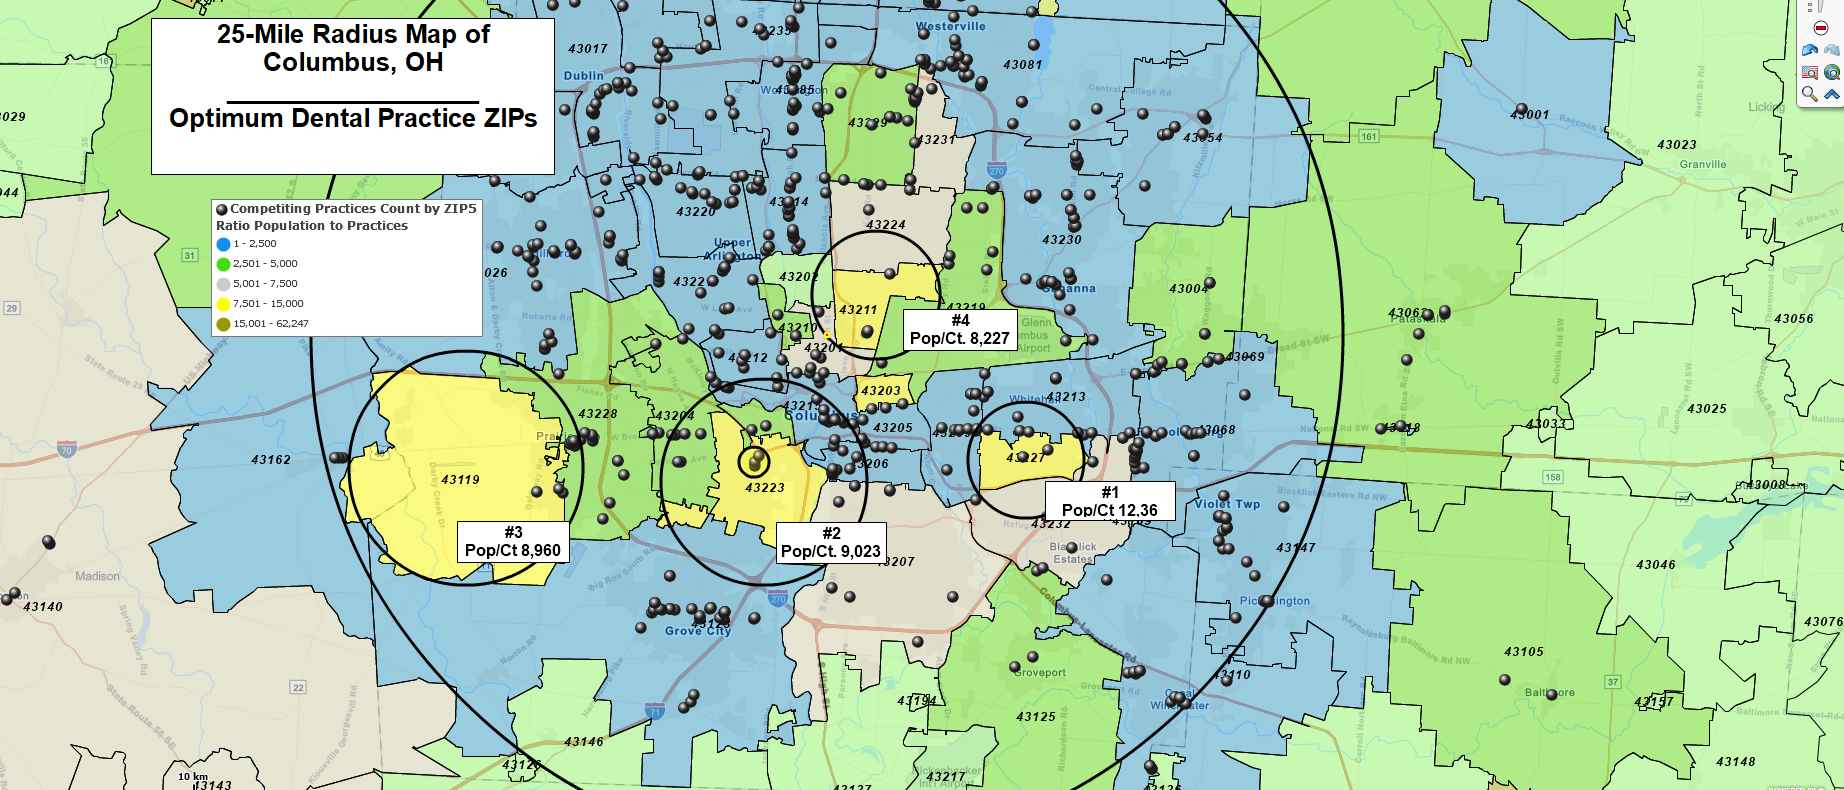
Identifying the top four best areas by ZIP code for a new dental practice in suburban Columbus, OH.
Saving Your Map Project
Over time, you will generate more business map projects for your organization. You must keep your map projects saved and organized.
Remember to save your map project with a name that describes the purpose or geographic design. Some examples of descriptive project save names:
- CongressionalDistrictPopulation2024
- ZIP3MailAnalysisHomeDepot
- CountyHHInc2023MADeputyAssoc
When creating a new map project, it is a good idea to review your previous work to see if there are similar projects you can leverage.
If you find a previous map project that might fit your latest project, open the map file and save it under a different name. Remove previous datasets and import relevant data. Now, start optimizing your map project to your liking.
When you near completion of your map project, keep these final steps in mind:
- Ask a trusted associate to review your map work.
- Do a final spell check. Remember to look at map titles, the saved map name, and any text boxes you’ve placed on the map.
- Save your map project as a My Template in the MapBusinessOnline save option. Saving the map in the My Template folder will prevent you from overwriting, deleting, or sharing the map inadvertently.
Think of MapBusinessOnline as your geographic project portfolio. And think of yourself as a certified map geek – which is an excellent thing!