How Do I Automate Imported Location-Data Updates?

Location-based address or latitude-longitude datasets are a vital element of business mapping. Map creators import location data to display relevant points of interest, define areas of interest, or add relevant resources to a business map.

Imported location datasets can be color-coded and symbolized in ways that add value to your map. These symbolized plotted points might define territory areas customer locations or depict the density of physical placements by subject.

But imported data means, sooner or later, the map creator must consider updating the data or reimporting the data because, just like the weather, data changes.

MapBusinessOnline has a map plotting feature that lets users import an address or latitude-longitude spreadsheet onto the map. The business mapping software provides a datasheet view in the Data Window. It offers a variety of symbology and color-coding options to maximize the map creator’s impact on her target map viewer.

But what of data updates? Imported data ages. Location records are added, deleted, and changed. How can you avoid a reimport process and automate the update process for imported location datasets?

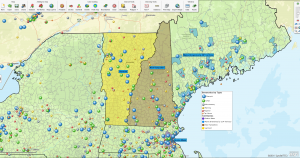
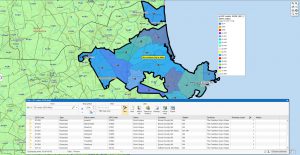
Northern NE Territory Maps for One-Stop Brewery Depot

A few years back, MapBusinessOnline started supporting data updates by allowing users to select or create a Unique ID column in their imported data. The application would use that Unique ID to facilitate updating imported location data accurately. But the process required the map user to process the update. You had to click a button.

Automatic Updates

Our development team recently added several controls that enable full automation of location data updates. The user must store the data at its original location and assign a Unique ID column.

A map creator has two places to adjust settings to make this update process happen. The first control sets up automatic updates to occur or not. Both of these update controls are in Map and Data.

Updates Allowed

  1. In Map and Data, click the Map Options button at the top of the front menu.
  2. Choose the Map Updates tab.
  3. At the bottom of the Map Updates dialogue, check on the box labeled Update Datasets  This means updates to imported data layers are allowed.

Updates Enabled

Next, return to the front page of Map and Data. Here we will address the specific process for updating imported data layers.

  1. Hover over the imported dataset layer and click the Edit Map Layer Properties
  2. On the dialogue page, navigate to the third-lowest section focused on Updates.
  3. Click the Options button:
    1. Use this button to assign a Unique ID. It could be a unique ID column you added or a unique ID column included with the data.
    2. If you already have a Unique ID column assigned, go to the next step.
  4. For general data updates, click the Quick Update. If you’ve already adjusted your Update Datasets button as described in the top section above, you’re all set for MapBusinessOnline to automatically update your location dataset.

Now, take the rest of the day off.

Automatic data updates are convenient, saving the user time. Automatic updates also assure enhanced accuracy as your imported data can be relied upon to be up-to-date.

Read more about imported data:

_______________________________________________

Find out why over 25,000 business users log into www.MapBusinessOnline.com for their business mapping software and advanced sales territory mapping solution. The best replacement for Microsoft MapPoint happens to be the most affordable.

To access MapBusinessOnline, please register and download the Map App from the website – https://www.mapbusinessonline.com/App-Download.aspx.

After installing the Map App, the MapBusinessOnline launch button will be in the Windows Start Menu or Mac Application folder. Find the MapBusinessOnline folder in the Start Menu scrollbar. Click the folder’s dropdown arrow and choose the MapBusinessOnline option.

The Map App includes the Map Viewer app for free non-subscriber map sharing.

Please read customer reviews or review us at Capterra or g2crowd.

Contact: Geoffrey Ives geoffives@spatialteq.com or Jason Henderson jhenderson@spatialteq.com

*Yeah. You got Rick Rolled.

Posted in Business Mapping Software blog post, How to instruction | Tagged , , , | Leave a comment

MapBusinessOnline Base Map Layers to Transition to Vector Tiles on April 30, 2022

Effective April 30, 2022, MapBusinessOnline business mapping software will change its base map (background) layer format. MapBusinessOnline will be transitioning to vector tile-based map backgrounds.

Why is this Change Taking Place?

This adjustment is occurring due to changes in background map tiling formats. Raster imagery base maps will no longer be available, except for the ‘Satellite imagery’ map background option. “We will be deprecating current raster base map layers and upgrading the maps to use vector base map layers instead,” said MapBusinessOnline President Geoffrey Ives.

Vector tiles offer significant advantages over the raster-based geographic map views:

  • Vector tiles provide higher resolution map visualizations at specific scales.
  • Vector tiles provide higher resolution maps for user exported PDF, Jpeg, and PNG files used for printing and image placement.

These advantages will improve the overall performance of map background layers in MapBusinessOnline.

How Can the Map User View the Difference Between Raster and Vector Tiles?

In the current version of MapBusinessOnline, users can view vector tiles and turn them on and off.

  • Go to Map and Data.
  • Hover your cursor over the Streets background layer (the bottom option) and click the Edit the Map Layer Properties gear.
  • Check on the Vector Tiles checkbox to view vector tile base maps and check off to view raster base map backgrounds.

No vector tiles

Vector tiles

How Will This Impact User Saved Map Projects?

Certain MapBusinessOnline base map layers will no longer be available for map styling after April 30, 2022. The new base map layer options will automatically apply to existing map projects at that time and as noted below:

  • The Streets base map layer will remain, but only the vector tile version will be available. MapBusinessOnline customer map projects using this layer will automatically start using the vector tile version.
  • The Satellite imagery base map layer will not change. MapBusinessOnline customer map projects using this layer will not be impacted.
  • Imagery & streets base map layer will remain, but only the vector tile version will be available. MapBusinessOnline customer map projects using this layer will automatically start using the vector tile version.
  • The National Geographic base map layer will be removed. MapBusinessOnline customer maps using this layer will automatically transition to the vector tile version of the Streets base map layer.
  • The Topographic base map layer will be removed. MapBusinessOnline customer maps using this layer will automatically transition to the vector tile version of the Streets base map layer.

This change in background map layer presentation will not impact customer imported data, territory map layers, other map layers such as ZIP codes, counties, and states, or other map objects.

Please get in touch with us with any questions or concerns about this change.

Geoffrey Ives geoffives@spatialteq.com or Jason Henderson jhenderson@spatialteq.com

Or use the Contact Us Button or Chat option on the website.

Posted in Business Mapping Software blog post, How to instruction | Tagged , , , | Leave a comment

Go to the Geo-Super Bowl with MapBusinessOnline – Pro

The subscription purchases of MapBusinessOnline Pro have been on the rise. Some purchasers of Pro are new users of MapBusinessOnline entirely; others are upgraders from the Standard subscription. Most users usually choose the USA Map Data, and some select to include Canada.

MapBusinessOnline Pro offers a specific set of features that can be very helpful for sales and marketing teams, financial investment managers, and field service organizations. In its own way, Pro takes us to the Super Bowl of business mapping software.

MapBusinessOnline Pro extends the location-based analysis capabilities of MapBusinessOnline Standard in multiple ways.

  • Import up to 250,000 location records – Cloud-based services like MapBusinessOnline offer access to advanced database management tools. Broadband throughput capability for large datasets has improved tremendously over the last decade. MapBusinessOnline Pro leverages these Internet-based technology advancements to enable more data processing faster. It means your organization can apply location-based queries to large geodata samples and get results in minutes. Big data users like subscription managers, database analysts, and marketing managers love the expanded data limits. MapBusinessOnline Pro is Pro ball – huddle with your team and make a plan.
  • Conduct drive-time analysis across multiple center points – This is no small feat. Driving time and distance queries are complex even when applied to just one point, let alone a thousand. These driving time and distance queries entail analyzing a road network in all possible directions. The further the distance, the more intensive the driving time query becomes. MapBusinessOnline Pro enables drive-time analysis across one or two datasets of many location points. It considers thousands of center points. MapBusinessOnline Pro is the Tom Brady of spatial queries.

Search & Segment Multiple Points by Driving Time

  • Extensive ZIP code Mapping – Large drive time queries applied to a group of ZIP codes opens up an entirely new dimension of analysis. Imagine a set of 200 address locations queried for a driving time of 2.5 hours at once. Those results are convertible to sales territories or demographic analysis areas – to name just two possible spatial subjects. ZIP codes are a demographic goldmine, offering extensive marketing and financial insight into critical areas of interest for investors, insurance companies, and manufacturing concerns. The NFL could conduct market analysis on all NFL stadiums out 50 miles, in all directions. Touchdown!
  • Powerful sales territory management tools – While MapBusinessOnline Standard provides thousands of businesses with easy and advanced sales territory management tools, MapBusinessOnline Pro enables fast multiple territory creation possibilities. For instance, create one hundred territories based on one drive time analysis query. Or perhaps your business manages their fieldwork through territory hierarchies. Pro enables the creation of Regions and Divisions out of a territory network. These are powerful tools for organizing sales and field accountability, as well as for tracking purposes. Armed with control over territory hierarchies, your team will drive down the field for seven points every time.

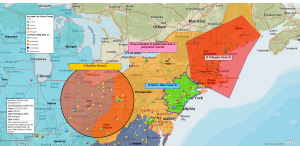
Northern NE Territory Maps for One-Stop Brewery Depot

  • Batch calculate distances and times – A basic address spreadsheet with thousands of records can be imported into MapBusinessOnline Pro and have distances or time calculations applied across all points. The results are appended to the original dataset for export. Or compare two datasets and append all the distances between stops to both datasets. All this in minutes. Exportable as CSV files, these advanced queries come in super handy for businesses that require them – you know who you are. Transportation firms, insurance companies, large sales organizations, and database analysts. Nobody’s retiring with MapBusinessOnline Pro around to sweeten the seal.
  • Enrich Your Spreadsheet with Demographic and Geographic data – MapBusinessOnline Pro, like MapBusinessOnline Standard, provides access to all demographic and geographic data layers. Pro lets map creators update imported spreadsheets with relevant demographic and geographic data columns. Subscribers can query these datasets and export the results. Your ZIP code or Cities spreadsheet suddenly has all the associated population, income, and ethnicity fields you dreamed of sharing. Answer questions about your user base, customer base, site selection options, or store expansion plans. Every play with MapBusinessOnline Pro achieves a first down.

So, whether or not your business is headed to the Super Bowl, turn to MapBusinessOnline Pro for the best and most affordable advanced spatial analysis software on the market, as long as Brady stays retired.

Find out why over 25,000 business users log into www.MapBusinessOnline.com for their business mapping software and advanced sales territory mapping solution. The best replacement for Microsoft MapPoint happens to be the most affordable.

To access MapBusinessOnline, please register and download the Map App from the website – https://www.mapbusinessonline.com/App-Download.aspx.

After installing the Map App, the MapBusinessOnline launch button will be in the Windows Start Menu or Mac Application folder. Find the MapBusinessOnline folder in the Start Menu scrollbar. Click the folder’s dropdown arrow and choose the MapBusinessOnline option.

The Map App includes the Map Viewer app for free non-subscriber map sharing.

Please read customer reviews or review us at Capterra or g2crowd.

Contact: Geoffrey Ives geoffives@spatialteq.com or Jason Henderson jhenderson@spatialteq.com

Posted in Business Mapping Software blog post, How to instruction | Tagged , , , , | Leave a comment

Start Your Business Map with Nothing & Add Value

Click the Create New Map button on the far left of the MapBusinessOnline Master Toolbar.

Don’t even look at the map. Go to Map and Data and uncheck the background Street Layer. Now, look at the map. What do you see?

You should see a blank blue background and nothing else—a nudey-kazoo map – completely naked.

Think about your map requirement. Take a minute to gather your thoughts about what you want the map and the message you will communicate to your map audience. Next, just breathe. Good thing I reminded you to do that, huh?

“Blue. Blue. My Map is Blue.”

Business Mapping Software offers a geographic toolkit that a subscriber uses to develop a map-based message for her map viewers. We are forced to consider what layers are most appropriate for the map project at hand by starting with nothing.

Select a Map Layer

Map and Data is the gray box that hovers over your blank blue field of view. Map and Data provides checkboxes that turn on the various layers that constitute your business map.

Turn on the ZIP Code layer only.

Your field of view should now display the complete boundary ZIP code layer of the contiguous United States. Boundary ZIP codes account for most of the ZIP codes – but not all. Read more here.

Demographic mapping and ZIP code mapping add value to a business map. At the full USA Zoom view level, ZIP codes do not provide a lot of value because each ZIP code represents a small area. So, zoom in to a section relevant to your map’s purpose. Consider color-coding the ZIP codes based on a demographic category of data related to your subject matter.

Color-code Boundaries

If your map is retail-related, select a Consumer Expenditure category like Housekeeping Supplies, which estimates the average household’s dollar value spent per year on cleaning supplies. Color code the map using that category. For instance, click the Border button under Color-coding, select the ZIP code layer, and scroll through the categories of demographic layers.

As you process the color-coding, select a range number set between 3 and 5—no reason to start higher unless you have a particular color analysis in mind. Too many colors will tend to detract from your map’s purpose.

Choose a few color gradations that suit your map with your range number presented. It’s easy to reprocess, so jump right in. MapBusinessOnline prefills the range numbers to show a spread between zero and the largest value associated with a ZIP code. I usually reset the numbers to reflect more standard numeric ranges such as:

  • 1 to 250
  • 251 to 500
  • 501 to 1000
  • 1001 to 2500
  • 2501 to 5000

Try the above range and get a sense of how that scheme appears on the map. Look for differentiating factors. For instance, I chose 5 ranges at first in shades of orange to red. But upon reflection, I went back and decreased to 4 ranges splitting it thus:

  • 1 to 500
  • 501 to 1500
  • 1501 to 2500
  • 2501 to 3000

This range offered more meaning for me as a map viewer than the first view. If you were an expert on the retail household supply business, you’d adjust those ranges and colors based on your awareness of the market.

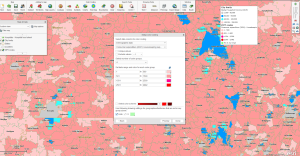
Color-coding ZIP codes based on Demographic Data in MapBusinessOnline

By the way, the Map Legend on your map will now reflect your color-coding selection. You will notice a section in the legend for Not in Any Range. I usually just erase that in the Map Legend. But you could also remove it at the bottom of the Boundaries Color-coding dialogue. Select Hide. Of course, you could also leave it there if you think that it adds value to the map.

Hint: Always be accessing the value of your map. Consider the value of every aspect of your map. Does your map communicate the right message to the map viewer?

Additional map layer options are available in the Map Layer button under Adding to Map. Check out census tracts, city limits, MSA (Census Bureau Metropolitan Statistical Areas), and ZIP 3 codes. Perhaps not one of them enhances your business map. In which case, you should import some relevant location data.

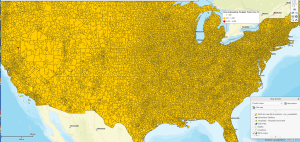
Here, the color scheme doesn’t tell us much about housekeeping supplies

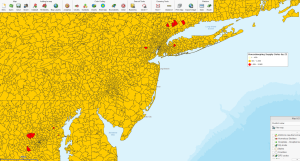
Zoomed in however we see some serious housekeeping action in a few ZIPs. Weird.

Import Relevant Location Data

You are creating a business map that defines or helps identify problems. Location data imported into a business map can provide insights into the roots of a business problem. Hopefully, the genius who appointed you is also providing some location data to support your project.

A simple example could be a business map describing sales declines. Revenue totals by account address are imported onto the map. Map viewers can examine year-over-year sales. All declining year-over-year trends are colored red. All increasing sales are colored black. All accounts holding steady are blue. The map reveals almost all areas as staying steading or increasing except for one area of decreasing sales, which turns out to be the largest account of all. Problem identified.

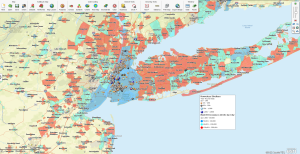
A Zoomed-in Relevant Map

Search for relevant location data online. Industry groups and non-profit organizations often share resource location datasets. Look for datasets with full addresses or latitude-longitude coordinates – not just ZIP codes. Where possible, select data that includes columns of relevant associated data like sales, hospital beds, and trends up or down. MapBusinessOnline always provides a count.

With relevant location data imported onto the map, the map creator should focus on making sure that imported data supports the map purpose. Check symbology options and color-code those points in a meaningful way.

These are your primary tools for creating a business map that sings.

  • Select a map layer that supports your map’s intent.
  • Color-code the map layer(s) with demographic data.
  • Import relevant location data over the map layers.
  • Optimize to your taste, and serve.

Find out why over 25,000 business users log into www.MapBusinessOnline.com for their business mapping software and advanced sales territory mapping solution. The best replacement for Microsoft MapPoint happens to be the most affordable.

To access MapBusinessOnline, please register and then download the Map App from the website – https://www.mapbusinessonline.com/App-Download.aspx.

After installing the Map App, the MapBusinessOnline launch button will be in the Windows Start Menu or Mac Application folder. Find the MapBusinessOnline folder in the Start Menu scrollbar. Click the folder’s dropdown arrow and choose the MapBusinessOnline option.

The Map App includes the Map Viewer app for free non-subscriber map sharing.

Please read customer reviews or review us at Capterra, or g2crowd.

Contact: Geoffrey Ives geoffives@spatialteq.com or Jason Henderson jhenderson@spatialteq.com

Posted in Business Mapping Software blog post, How to instruction | Tagged , , , , | Leave a comment

MapBusinessOnline Standard’s Recent Enhancements

MapBusinessOnline software development is constantly putting new features into the product. Not every feature warrants a press release. We try to keep the user-base notified of new features as they happen. But sometimes, in the fog of daily business, we may miss a minor feature or two.

Below are some of the features you may or may not be aware of:

Map App Related Features

Throughout 2021 MapBusinessOnline business mapping software transitioned from a Flash Player-based world to the downloadable Map App. The Map App, housed in the Windows Start Menu, is the list of launch buttons, including the MapBusinessOnline Updater.

For the most part, when you launch MapBusinessOnline, an update to the most recent release of software occurs automatically. But some of us, myself included, might go a day or two without shutting down, which can lead to delayed updates.

My only point in mentioning this is to suggest that if the application presents strange behavior, something out of the ordinary, try running the updater from the Map App in either the Windows Menu or the Mac Application folder. And if that doesn’t work, Chat us up, and we’ll hold a web share séance to assess the problem.

________________________________________________________

Business Listings Features

MapBusinessOnline has offered purchasable business listings for a few years now. In addition to being able to search for listings by industry, polygon, circle, city, state, and ZIP code, we’ve added a few features, including:

  • Enhanced search NAICS and SIC industry code lookups.
  • Location type lookup – Search by headquarters, branches, subsidiary, and franchise status.
  • Uncheck all contacts – Allows business listings searches to be limited to specific contacts.

Business listings costs start at $0.15 each. All downloaded records are exportable. Read more here.

________________________________________________________

Map and Data Features

Callouts:  Sometimes, map editors adjust the labels or callout positions associated with a point on the map. These round-the-clock positions are changed by clicking the edit gear within the label itself. Additional callout controls are available through Map and Data. Click the Edit  Properties gear of the point layer. Under Callouts, there are now options controlling which group of points in the layer is turned on or off.

Mapset Imported Data Updates: Cloud-based mapping services have occasional updates like all cloud-based software. For MapBusinessOnline, those updates can impact USPS ZIP code changes, demographic data releases, and imported location data updates. New this month, the Map Update tab controls how your MapBusinessOnline subscription handles updates. Look at the Map Updates folder under Map Options in Map and Data. Here you will find:

  • How often to prompt for updates.
  • How Mapset (ZIP code) updates are applied.
  • Automatic updates of imported location data, controlled in MapBusinessOnline by the Unique ID column. Apply Unique ID controls to your imported data and select some update options.

Read more about data updates.

________________________________________________________

Territory Management

Those using the tool for sales territory creations and editing will have noticed new options when selecting map layer objects like ZIP codes. Now when choosing a group of ZIP codes, the operation options list includes Move To in addition to Add To and Remove From. Add To and Remove From is exactly what Move To accomplishes. Move To is the fast way to shift map layer objects from one territory to another.

Read more about territory management in MapBusinessOnline here.

A MapBusinessOnline Territory Map View

______________________________________________________________

Data Window Features

Exporting ZIP Codes & Territories: We’ve made it wicked easy (Yes, I grew up in Mass) to export:

  • Territories with a list of ZIP codes or other map layer objects.
  • A complete list of ZIP codes (Point and Boundary), users no longer need to upload the public data ZIP code list.
  • A segmented list of territories.

To export these various options in the Data Window select the map layer or interest (usually ZIP codes) and click the Export button on the far right of the Data Window toolbar. Then read and choose from the options listed. You should find all the options listed above clearly laid out for you in simple checkboxes.

Configurable PDF Legend – PDF file management is found in the MapBusinessOnline Print button. A map file saved as a PDF (large format) can be printed on a plotter for large wall maps. Recently we made the PDF map’s legend configurable. When generating a map PDF file, you will find a section in the upper left controlling the legend in the second dialogue page. Here you can adjust the font size, color, and position. Read more here.

To further reduce the size of your legend, be sure to go back to the map and edit that legend for succinctness. Eliminate unnecessary legend lines, shorten layer names, and generally tighten up that legend text to focus the legend content on the map’s intent.

Filter Map View Options – A Filter window lets the map user key in name words or letters and search for records in the Data Window. Just below that input window is a Checkbox Dropdown with options:

  • Filter by Content
  • Filter by Selection

Filter by content will display on the map records filtered by name column text. Filter by selection will show records on the map filter by selection. Selection records are cursor selected in the data window, holding down the shift or control key to select additional records.

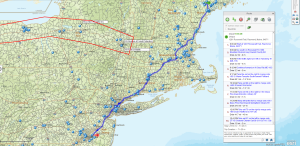
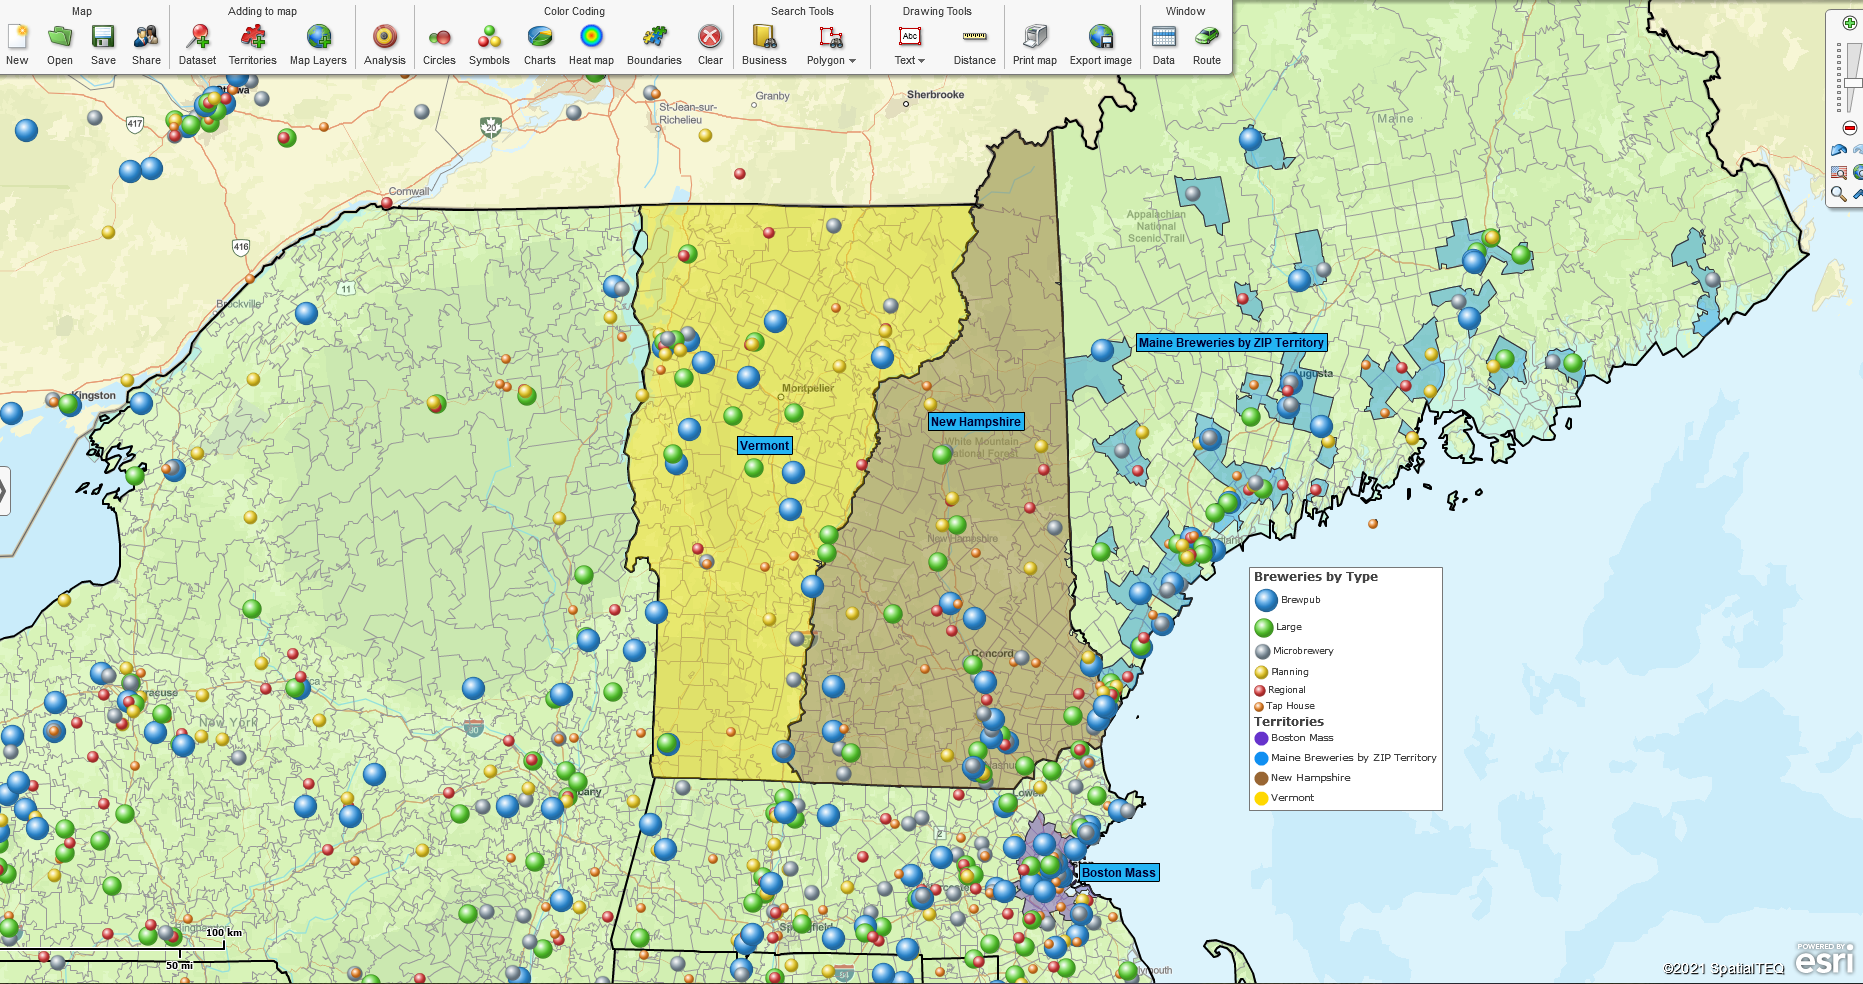
Northern NE Territory Map

Remember you have those Data Window toolbar options to create Marketing Lists out of records filtered and displayed. Read more about marketing lists.

Spatial Query Options

A few years back, we added an extra check box to the Radius Query process in MapBusinessOnline. When a circle appears on the map, the Search Data selection box appears. A Checkbox appears at the bottom for Radius search queries only to search for the nearest 100 records by a straight-distance line. Check that box, and the Data Window presents all the records with an additional column for ‘distance from the center point.’ Export and enjoy!

________________________________________________________

Recent Map Folder – When pressing the Create New Map or Open Map buttons, a relatively new option is to look at the folder labeled Recent Maps. I usually have four or five maps I’m spending most of my time on. Clicking the Recent Map folder lets me conveniently access my most recent maps.

Regular demographic data and ZIP code updates occur at least once a year. The most recent updates took place in December 2021.

MapBusinessOnline announces significant new features in the newsletter and through press releases. We accept suggestions for new features via email – click the Contact US button and suggest a feature. The more requests we get, the more likely the feature will happen.

_______________________________________________

Find out why over 25,000 business users log into www.MapBusinessOnline.com for their business mapping software and advanced sales territory mapping solution. The best replacement for Microsoft MapPoint happens to be the most affordable.

To access MapBusinessOnline, please register and download the Map App from the website – https://www.mapbusinessonline.com/App-Download.aspx.

After installing the Map App, the MapBusinessOnline launch button will be in the Windows Start Menu or Mac Application folder. Find the MapBusinessOnline folder in the Start Menu scrollbar. Click the folder’s dropdown arrow and choose the MapBusinessOnline option.

The Map App includes the Map Viewer app for free non-subscriber map sharing.

Please read customer reviews or review us at Capterra or g2crowd.

Contact: Geoffrey Ives geoffives@spatialteq.com or Jason Henderson jhenderson@spatialteq.com

Posted in Business Mapping Software blog post, How to instruction | Tagged , , , | Leave a comment

How Do I Optimize and Search Location Data?

Before 1995 map data import was quite the magic trick. Using MapBusinessOnline, a subscriber can import an address list of business locations, and map points will magically appear on the map at those exact locations. We take this for granted today.

That initial location data spreadsheet could represent almost anything:

  • A list of customers or prospects.
  • A donor list for a non-profit.
  • A list of client home addresses for a home care company.
  • A resource latitude longitude list for a construction business.
  • A location record of advertisements by specific billboards.
  • A record of all criminal activities by area.
  • Remote latitude longitude points for wind turbines.

I think you get the picture. Import your spreadsheet and view those addresses and coordinates on the map. Symbolize, color-code, and label those records so that the points on the map convey more information to the map viewer. Read more about importing data here.

Business Mapping Software Location Data

Imported data can be queried and segmented for export or analysis. We here at MapBusinessOnline refer to those segmented results as a Marketing List. We call it a marketing list because sales and marketing pros often use those query results for marketing and sales campaigns. But in reality, marketing lists are used for various reasons; some outlined above. So substitute your action word for ‘marketing’ depending on your work, such as strategic planning list, follow-up list, or list of friends I’ll call when I’m stuck at home with COVID.

Importing business location data into MapBusinessOnline is a core use case for the product. Once imported into a business map, map editors can optimize the location data to maximize the map’s benefit to all map users and viewers. Optimization of imported business mapping data occurs through these mapping operations:

  • Symbolization – The assignment of symbols to imported data points. Think circles, pins, dots, triangles, and more. MapBusinessOnline offers a library of symbol images and allows the user to import their symbols, should they desire to do so. Map symbols can be size and color adjusted.
  • Color-code – Apply color-coding schemes to imported business data. Imported business data can be color-coded based on numeric data columns. Sales numbers, website metrics, crop harvest data, demographic data are all numeric data used for color-coding. Color-code symbols or color-code map layers, like ZIP codes. Read more about color-coding data.
  • Labeling – Each plotted point or symbol on a business map represents an address or latitude/longitude coordinate. Plotted points have labels that can be turned on and off. MapBusinessOnline refers to these point labels as Callouts. Typically, the point callout will include the location’s name, the full address, and five flexible additional data fields the map editor can fill with imported data. Read more about labels and callouts.

Optimizing imported location data as described above is crucial to developing an effective business map visualization. The business map, with plotted points, can be enhanced to provide the viewer with a pleasant and informative geographic experience.

Filter, Query, and Create Marketing Lists

Once business data is optimized, the map editor can use MapBusinessOnline to conduct spatial and filter queries against the imported data.

To run a Spatial query, use the search tools – polygon, free form, and radius search tools are listed in the middle of the Master Toolbar:

  1. Select a search tool from the options listed.
  2. Draw the search areas on the map.
  3. Choose a data layer to search from the layer options, in this case, selecting your imported data for querying.
  4. Name the query results and view the new Marketing List in the Data Window.

Read more about spatial queries.

Choose Your Spatial Search Approach

Routing Capabilities

The spatial queries display as ‘marketing lists’ in the Data Window. These query results are exportable and routable.

Professionals use segmented or filtered marketing lists to:

  • Plan sales trips and other sales activities.
  • Support marketing campaigns.
  • Track coupon redemption in retail stores.
  • Organize pick-up and delivery schedules.
  • Create optimized vehicle routes for busses and vans.

MapBusinessOnline marketing lists convert into a route stop file at the click of a button, specifically the Add to Route button on the Data Window toolbar. The Route Window will open, and the marketing list addresses will now show as a list of stops. The vehicle route, once processed, will display on the map as a blue line. Turn-by-turn directions are available for printing, as is a route stop list.

Marketing list and route work in MapBusinessOnline

A map creator can also share the map publicly with constituents. Click the Share button on the master Toolbar and follow the instructions for sharing a public map. Password protection is an option. Please copy the link and paste it into an email for distribution. Read more about map sharing.

The map viewers of publicly shared maps are not required to be subscribers to MapBusinessOnline. Yet they still receive map functionality:

  • Create vehicle routes on the shared map.
  • Measure distances.
  • Save image file views as Jpegs or PNG files.
  • Conduct spatial queries and save results and an exportable marketing list.

Marketing lists are editable in the Data Window and Map and Data.

In the Data Window, selected marketing lists are edited by data field:

  • Edit record fields one-by-one.
  • Delete records one-by-one or multi-select.
  • Manipulate marketing lists – create new, remove, update.
  • Export for use outside the application.

Map and Data provide number and text formats controls:

  • Adjust column formats.
  • Add and remove columns.
  • Add calculated data columns or formulas.

Business mapping is powerful. Become familiar with the process and enhance your ability to solve problems using business mapping software. Marketing lists in MapBusinessOnline help the map user manipulate data for analysis, routing, and export.

Seek out the Map Geek in you. Or not. I’m not sure if Map Geeks are in or out right now.

Find out why over 25,000 business users log into www.MapBusinessOnline.com for their business mapping software and advanced sales territory mapping solution. The best replacement for Microsoft MapPoint happens to be the most affordable.

To access MapBusinessOnline, please register and download the Map App from the website – https://www.mapbusinessonline.com/App-Download.aspx.

After installing the Map App, the MapBusinessOnline launch button will be in the Windows Start Menu or Mac Application folder. Find the MapBusinessOnline folder in the Start Menu scrollbar. Click the folder’s dropdown arrow and choose the MapBusinessOnline option.

The Map App includes the Map Viewer app for free non-subscriber map sharing.

Please read customer reviews or review us at Capterra or g2crowd.

Contact: Geoffrey Ives geoffives@spatialteq.com or Jason Henderson jhenderson@spatialteq.com

Posted in Business Mapping Software blog post, Sales and marketing | Leave a comment

Business Mapping Solutions for Business Problems

In professional life, business challenges occur every day. These bumps in the road may indicate a need for business mapping. Business problems are often location-related to an address, ZIP code, or county.

For example, COVID-19 is a business problem that has an associated location in Wuhan, China. Any COVID-19 related problem will have a location component.

Business challenges can be large or small. Maybe your business is facing an expansion requirement. Or perhaps your business is replacing a long-term sales associate, and it’s time to rethink territory arrangements.

Problems can be new or old. It could be your business needs to adjust its revenue expectations in the face of rising competition. Or maybe there’s a recently hired, fired-up vice–president of sales looking for new ideas.

In any case, problems are what business mapping software eats for breakfast.

Delivery and Field Service Orgs

Perhaps you run a delivery service, and your business-related travel expenses have recently skyrocketed. Sure, gas prices are up, but your expense reports indicate your traveling associates have racked up increased mileage over the last three months.

The solution to this travel expense problem is going to include several suggestions:

  • Lower travel costs – Use business mapping software to generate optimized routes that provide the most efficient travel.
  • Efficiency studies – Use business mapping software to analyze where your traveling associates begin their day and the roads they travel over their day. View multiple associate delivery stop lists against a map of your delivery areas. Look for and eliminate overlapping travel routes and stops. Out-of-control expenses are usually the result of crisscrossing travelers.
  • Sales territory management – Establish territories for deliveries and service calls, with clearly defined rules of operation. Read more about territories here.
  • Share maps that describe areas of responsibility – Stick to the rules. It turns out following the rules is a tricky part of the solution. Insisting on specific travel routes and stops can be difficult to enforce, but that’s where the savings are. Read about map Sharing in MapBusinessOnline.

Routing Solution

Apply business mapping software to delivery challenges to expose repetitive delivery addresses, route-avoid patterns, and the most efficient delivery routes. Look for patterns and opportunities that point out inefficiencies in traveler habits. Implement those changes.


Construction Businesses

Jobsites require planning. Business mapping software can provide a construction job site manager with a platform for viewing all job sites at once. While MapBusinessOnline is not a survey-accurate mapping application, it does offer solutions for the construction industry. Construction business mapping applications might include:

  • Color-code Job site map markers by weekly or daily activity stages. Green for fully staffed and materials delivered. Orange for material shortages. Red for wholly stopped due to city inspection approvals.
  • Site selection maps – Preconstruction demographic analysis supports project marketing and sales. Determine the optimum building sites by comparing investment requirements, costs of updates, access to resources, and rental and retail opportunities. Become more aware of your construction site’s surrounding areas.
  • Explore and map business listings for future building projects, competitor analysis, or resource awareness.

Law Firms

We’re speaking with more and more law firms seeking business mapping support. Lawyers come across many requirements for mapping services. Like almost any other company, law firms have sales and marketing teams. Sales territory mapping and location-based market analysis are regularly applied. But more industry-specific requirements occur as well:

  • Crime location analysis – Whether you’re defending a client accused of serial robberies or prosecuting a known suspect, viewing all the crimes by location against an accurate map of the area is both enlightening and helpful.
  • Law firm visualizations – Import an address database of all law firms within a region for tracking. Color code and symbolize firms by core competencies, legal specialties, or case wins.
  • Map visualizations – Criminal trials and civil and personal injury lawsuits often carry location components. The ability to process a focused and clear map visualization of places or events can be part of a winning strategy for a savvy attorney.
  • Demographic analysis maps – Sometimes, demographic characteristics explain a lot about a neighborhood, a city, or a region. Maps provide visualizations of ethnicities, income levels, and a host of other Census Bureau categories. While not always evidentiary, they can provide excellent background.

A Crime Map – Serial Robberies

Accurate maps rarely lie. If the truth is on your side, a map visualization can be convincing and informative. Over and over time-stamped location placements have made a case for location-aware legal teams.

Manufacturing Concerns

Small to large manufacturing operations make up the backbone of the USA economy. Urban and rural areas depend on factories and machine shops for employment and taxes. While MapBusinessOnline can’t claim applications on the plant floor, we provide a myriad of services for the operations, marketing, and sales departments associated with manufacturing concerns.

  • Sales territory management – Create and edit complex territories, regions, and divisions supporting direct sales, manufacturing representatives, and nationwide distributor networks. Define sales accountability, track progress against goals, and focus on sales maps for sales meetings. Watch your productivity and sales revenue increase.
  • Marketing analysis – MapBusinessOnline includes multiple tools that support a variety of assessments, including driving time and distance analysis, demographic map visualizations, and explorations of areas of interest. Expansion planning, competitor analysis, and resource allocations are just a few critical map-based analyses supporting the marketing and sales of manufactured goods.
  • Plant Relocation – Don’t bother considering building and equipping a new manufacturing facility without a location-based analysis of feasible plant location options. Map visualizations can expose both opportunities and risks associated with new areas. Consider map views of labor demographics. Develop efficient routes for supplier and customer shipments. Expose resources that support working families. Build your plant in fertile soil exposed through the application of business map visualizations.

A Manufacturing Concern Map

Online business mapping software is accessible through the Cloud and is imminently affordable for any organization. Will your company use the tool every day? Maybe. Maybe not. But when you’re searching for solutions to business problems, location analysis may be just the new perspective you’re looking for.

If a picture is worth a thousand words, a business map is worth a million.

Find out why over 25,000 business users log into www.MapBusinessOnline.com for their business mapping software and advanced sales territory mapping solution. The best replacement for Microsoft MapPoint happens to be the most affordable.

To access MapBusinessOnline, please register and download the Map App from the website – https://www.mapbusinessonline.com/App-Download.aspx.

After installing the Map App, the MapBusinessOnline launch button will be in the Windows Start Menu or Mac Application folder. Find the MapBusinessOnline folder in the Start Menu scrollbar. Click the folder’s dropdown arrow and choose the MapBusinessOnline option.

The Map App includes the Map Viewer app for free non-subscriber map sharing.

Please read customer reviews or review us at Capterra or g2crowd.

Contact: Geoffrey Ives geoffives@spatialteq.com or Jason Henderson jhenderson@spatialteq.com

Posted in Business Mapping Software blog post, How to instruction | Tagged , , , , | Leave a comment

Adding Demographic Data to Map Layer Labels Using MapBusinessOnline

Demographic Data is such a fun digital tool to play within business mapping software. MapBusinessOnline subscriptions include access to the most popular categories of USA demographic data available from the US Census Bureau. Canadian data is available for our northern neighbor’s geographies, but the category count is much less. Canada is stingy with its demographic data releases.

I’ve written before about building a demographic map using USA data and map layer geographies like ZIP codes and counties. But for today’s blog, let’s discuss creating a business map using map layer labeling.

Map layers are the jurisdiction layers such as ZIP codes, Counties, States, or City Limits included in MapBusinessOnline subscriptions. Each object (ZIP code, county, or state) in a map layer has a label. These labels can be turned on or off en mass and can have additional data appended to the labels. There are five flexible data fields available with each map layer label set.

Create a New Map

Click the new map button on the Master Toolbar and create a fresh new map of the USA. To simplify our base map, go to Map and Data and turn off or uncheck the ‘Street’ background map check box.  There’s no written rule that you have to use a background map as an aside.

While you’re at Map and Data, check on the State Layer. Your new map should have nothing but the 48 contiguous states showing against the blue background. (BTW, you can adjust the color to something other than blue in Map and Data Map Options.)

 Append Map Layer Labels with Demographic Data

In Map and Data, hover over the State map layer. Click the Edit Map Properties Button and click the Labels tab along the right side. Next, make sure you click into Auto Label instead of Customer Label. Custom labels are labels that pop up when you hover over a map object with your mouse. Custom labels are set up just like auto labels.  Custom labels are cool but not what we’re after right now.

Clicked into Auto Label, scroll down through the label append options shown to # 1. You should find the Demographic Data prepopulated in the top dropdown and Population populated in the bottom dropdown. Ensure that the category option is for the year 2019 – the most recent Census Bureau release.

In MapBusinessOnline Demographic data, the most recent two years listed represent third-party projection estimates. As of mid-December 2021, the most recent Census Bureau Demographic estimates are for 2019. 2019 estimates are not based on the decennial 2020 Census Count. Neither are the two projection years.  Look for decennial Census data in the spring of 2022. That is per the Census Bureau.

With the Population 2019 selected, add a short text preheader for the label in the top field. I usually type in ‘Pop –.’ But you could be more specific and type in ‘Pop 2019 – .’ Include the dash. You could also spell out the word: population. It is up to you. I generally lean toward brevity and clarity when placing text on a business map.

There are four more flexible label fields you may add to the map from Auto Labels. Let’s do one more using Calculated Data Columns as a data source for labeling.

Calculated Data Columns for Labeling

Calculated Data Columns is the way you create basic formulas out of demographic data and imported numeric data in MapBusinessOnline. Don’t be intimidated; learn to love Calculated Data Columns.

Because we are appending the State map layer labels in our map, we need to create our Calculated Data Column in the State layer in Map and Data. Close the label function we’ve been using and return to Editing the State map layer properties.

Each Calculated Data Column setup is tied to a specific map layer. The Calculated Data must be constructed on the ZIP code map layer if the map creator works with ZIP codes. The same would apply to counties or states.

On the first page of the State layer’s Edit Map Layer Properties dialogue, you will find a button labeled Manage Calculated Data Columns at the bottom section.  Click it.

You’ll find the ‘Date column category‘ shown as Calculated in the dialogue that opens.  That means when you search for data to append to your labeling. The dropdown list will now include ‘Calculated‘ for any calculated formula options you’ve created at the State Map Layer level.

  1. Click Add a Data Column.
  2. Name the Data Column. For example: ‘Pacific Islander Kids.’ We’re going to calculate the estimates for Pacific Islander Children by state.
  3. Select any number formating you’d like to apply (%, $, decimal places.) No decimals are required for our calculation.
  4. Choose Formula Options and then Simple Formula.
    1. Select the dataset you’d like to pull from – in this case, Demographic data.
    2. Because for this blog, I’m interested in displaying a Pacific Islander Population label, scroll down until you reach a pertinent year and the categories describing the Pacific Islander population. You can select one category at a time, moving the yellow selection to the right using the top blue arrow set, or hold the shift key and grab a bunch and move them all to the right. The top section will sum your column totals.
    3. With your selection moved to the Formula, click Add in the lower right
  5. You may now close the Formula section. Your calculated data column is complete.

Please note that subtract and divide operations are also available in the formula.

Percentages calculations are managed within the number format option. In Formula, I would move a column to the top and one to the bottom to develop a ratio and then format the number for percent.

Back to labeling.  With your Calculated Data Column created, go back to the Map and Data State Map Layer Edit Map Properties button. Click into Format Labels and Auto Labels again.  Now scroll down to Auto Label option #3. In the upper dropdown, select ‘Calculated.’ In the text section, type in “Pac Island Kids –.”

Now your map displays some pertinent demographic data by state, including the number of Pacific Islander Kids in your State. Maine has 7. Wyoming has 3. Chalk up another win for Maine.

Optimize the Map Look & Feel

Finally, with my demographic labels finished, I take a step back and optimize my map a bit:

  • I like darker borders on my states.
  • I add a color of choice for the state fill.
  • I adjust my Auto Label text color to something dark, and I click off Italics and the white shadow option.
  • I then play with the Zoom tool in the navigation scrollbar in the upper right. That’s the magnifying glass button. I run that Zoom rectangle just inside the USA border to maximize the map extent and show as many labels as possible.

Then I get my Mom and show her my map. She’s a Pacific Islander, so she can check for errors. Turns out Maine has four.

_______________________________________________

Find out why over 25,000 business users log into www.MapBusinessOnline.com for their business mapping software and advanced sales territory mapping solution. The best replacement for Microsoft MapPoint happens to be the most affordable.

To access MapBusinessOnline, please register and then download the Map App from the website – https://www.mapbusinessonline.com/App-Download.aspx.

After installing the Map App, the MapBusinessOnline launch button will be in the Windows Start Menu or Mac Application folder. Find the MapBusinessOnline folder in the Start Menu scrollbar. Click the folder’s dropdown arrow and choose the MapBusinessOnline option.

The Map App includes the Map Viewer app for free non-subscriber map sharing.

Please read customer reviews or review us at Capterra, or g2crowd.

Contact: Geoffrey Ives geoffives@spatialteq.com or Jason Henderson jhenderson@spatialteq.com

Posted in Business Mapping Software blog post, How to instruction | Leave a comment

Which State is Safer – Maine or Wyoming?

A Tale of Two States

We’ve been publishing daily, bi-weekly, and now weekly business map snapshots of the COVID-19 virus epidemic and the COVID vaccination status by the state since March of 2020.

These shared maps have been visual representations of where we stand as a nation in dealing with the virus. That’s what business maps do for problems like epidemics, crime trends, political trends, or general business challenges that have a location component associated with them.

But as the COVID variants continue to pop up, bringing our social lives and our economy to a grinding halt, or at least a severe slow-down, it strikes me as valid to take a hard look at the virus solutions provided and assess their value.

Today we’ll take a break from discussing sales territory mapping and how to optimize your ZIP code map visualization. Instead, we’ll visit two places where the buffalo and lobster roam.

When a Business Map is Telling You Something

Over time, I realized that our State-by-State map analysis of the crisis told us something. That, after all, is what maps do. Maps communicate problems and suggest solutions. We see this all the time across our network of business mapping software customers.

Two states, in particular, are of interest here – Maine and Wyoming.

Both states are rural, northern states with relatively small total populations. We show Wyoming’s population at 581,836 according to the Census Bureau’s American Community Survey (ACS). The ACS happens to be the demographic source for MapBusinessOnline demographic categories.

The same Census Bureau release listed Maine’s population as 1,332,813. In which case, Wyoming has a population equivalent to roughly 45% of Maine’s population. Both states have ample open space sections that are sparsely populated.

Both Wyoming and Maine show reasonably similar population segments for the elderly – ages 65 years and up. Approximately 10% of the population for both Maine and Wyoming are older citizens. As an aside, I will be joining that crowd of fine folks here in Maine in less than three years. Please save me some Meloxicam.

The median income for the two states is relatively equal, with Wyoming leading by about $6,000, which I attribute to the oil and gas sector of the state’s economy. It isn’t easy to match those barrels of black gold (Texas tea) with lobsters, clams, and Downeast humor royalties.

Maine vs. Wyoming in Total Pandemic COVID Deaths

But where the map got most interesting was comparing the two states’ statistics on:

  1. COVID-19 related deaths and
  2. The % fully vaccinated against COVID.
Maine Wyoming
Population 1,332,813 581,836
Number of Deaths 1,428 1,347
% Fully Vaccinated 73 % 46 %
No. of Deaths per 100,000 Since Pandemic Start 100 245
Number of 65+ 158,254 56,686

Statistics referenced are from USAFacts.org.

The glaringly obvious fact is the low level of fully vaccinated people in Wyoming. Wyoming, a state with less than half the population of Maine, has twice the number of deaths per hundred thousand people. Wyoming is tied for last place, with Alabama having the lowest percentage of the fully vaccinated population.

Politics aside, conspiracy theories put on hold, and talk of vax mandates forbidden – these are simple numbers tracked for more than a year and suggest that vaccinations save lives.

This 27% difference in Maine vaccination rates compared to Wyoming rates may have saved 135 lives for every 100,000 people. Extrapolate that number to the entire USA. That additional vax percentage could mean a hundred thousand or more lives saved from a COVID-19 death just by getting more citizens to accept the CDC recommended vaccinations. It could be more, and I suppose it could be less.

  • This many people from a COVID death would be like saving the entire city of Portland, Maine.
  • Or, if viewed negatively, like losing all the attendees at an NFL playoff game.
  • Or all 107,000 attendees at the Grateful Dead’s largest turnout – Raceway Park, Englishtown, NY in 1977.

Business Map Derived Information is not Always Welcomed

I’m all for saving hundreds of thousands of lives, especially if my family and friends are protected. The last time I checked, losing a hundred thousand people was considered a mass causality event – not thought to be a good thing. But I guess I haven’t checked in a while.

The nation lost 2,966 souls to the terrorist attacks of September 11, 2001, and we went to war over it, a war that lasted twenty years. Oddly, many thousands die of preventable COVID today, and that’s cool with some elements.

I think what’s important is that people look closely at the available scientific vaccine information.  Consider facts based on the numbers. It is too easy for a jamoke like me to publish a blog on social media and claim to know something about healthcare. I’m not a scientist – I blew my Calculus III class at Colby back in 1979, thus ending my career in science.

The CDC and NIH are organizations that exist for a reason – to report on healthcare issues. Please pay attention to people trained in healthcare and be discerning when reading social media posts from self-appointed online influencers like me.

In my simple world, I search for high authority sites like the CDC’s Vaccine Adverse Event Reporting System (VAERS), and I think about the data I’m viewing. I have suffered more ‘Fauci ouchies’ this year than I care to remember. Three COVID shots, two for the flu, and one for pneumonia. I feel like a pincushion. But I’ve also got asthma, and I know what it’s like to struggle for a breath. No part of me wants COVID. I can’t afford to count on alleged natural immunity. It’s too risky for me.

The Side-effects Excuse

When I looked at the compiled data for the Pfizer vaccine, I arranged the side-effect stats from highest to lowest. The highest number for a side effect was for headache. The number of reported headaches is 50,953. This number represents anyone taking the vaccine and reporting a headache on that day or the following days, regardless of the headache source. So, the reason for the headache side-effect could have included:

  • A cold
  • A hangover
  • Too much nitrous oxide
  • A head injury
  • Some other medication’s side-effect
  • Having children

The tracked data is, in my opinion, overly thorough. Total applications of the Pfizer vaccine as of the date of this writing are reported online as 269,846,851. The VAERS reporting covers 1,418,834 total vaccination events. The viewer must seek to understand how the data is collected and reported.

The report listed many side effects, but most were one-off side-effects new to me. One hundred and ninety-four side effects had more than 1,000 occurrences. Some of the side-effects tracked were superfluous, IMHO:

  • Fifteen thousand five hundred forty-three listed COVID-19 as their side-effect.
  • Eleven thousand seven hundred eight sited ‘injection site pain.’
  • You’ll be relieved to read that not one person reported any “abdomen crushing,” just one of the thousands of side-effect listed.

We vaccinate to save lives, and we see that vaccinations are doing just that, with minimal harmful effects. Maybe the choice should be, ‘take the vaccine or move to Wyoming.’ The mandated move would certainly help our health numbers look better here in Maine.

There are certainly some people who should not take the vaccine. But those people do not make up a large percent of the general population. I like the Mayo Clinic site for medical advice on vaccinations.

But then I’m just a blogger. My job is to discuss how business maps help expose problems and solutions. To me, the COVID map of Wyoming suggests a problem, and that of Maine, a solution. What our customers do with their business maps is up to them. Still, the adage ‘As Maine goes, so goes the nation,’ may still ring true.

Related reading: Here’s a recent article on the reasons for vaccine hesitancy.

_______________________________________________

Find out why over 25,000 business users log into www.MapBusinessOnline.com for their business mapping software and advanced sales territory mapping solution. The best replacement for Microsoft MapPoint happens to be the most affordable.

To access MapBusinessOnline, please register and then download the Map App from the website – https://www.mapbusinessonline.com/App-Download.aspx.

After installing the Map App, the MapBusinessOnline launch button will be in the Windows Start Menu or Mac Application folder. Find the MapBusinessOnline folder in the Start Menu scrollbar. Click the folder’s dropdown arrow and choose the MapBusinessOnline option.

The Map App includes the Map Viewer app for free non-subscriber map sharing.

Please read customer reviews or review us at Capterra, or g2crowd.

Contact: Geoffrey Ives geoffives@spatialteq.com or Jason Henderson jhenderson@spatialteq.com
Posted in A story, Business Mapping Software blog post | Tagged | Leave a comment

Quickly Calculating Driving Distances & Times from One-to-Many Location Points

Below is a description of a straightforward solution to a typical driving time or driving distance problem. The capability is built right into MapBusinessOnline Pro.

Suppose you’ve got Dataset X that contains hundreds or thousands of points, and you would like to know the distances from one additional location to all the address points in Dataset X. In that case, you can get that solution quickly from MapBusinessOnline Pro.

MapBusinessOnline business mapping software comes in three flavors:

MapBusinessOnline Standard:

  • Import 50,000 records per map.
  • Create and manage sales territories.
  • Conduct market, demographic, and strategic analysis based on location data.
  • Build competitor maps, customer maps, demographic maps, expansion plans, market analysis, optimized travel routes, territory maps, ZIP code maps, and more.
  • Share maps with constituents.

MapBusinessOnline Pro:

  • Import 250,000 records per map.
  • All the functionality of MapBusinessOnline Standard
  • Create sales regions and divisions.
  • Advanced cross-dataset driving time and distance queries.
  • Enrich imported location datasets with geographic and demographic data.

MapBusinessOnline Team Sharing:

  • All the functionality of MapBusinessOnline Standard
  • Achieve collaborative team editing.
  • Admin controls of teams, editors, and viewers.

Examples of why anyone would require the above-mentioned multipoint driving distance and time solution include:

  • A device business sends technicians out for maintenance jobs and needs to understand the driving distances between all points to estimate travel expenses for repairs at known product installations.
  • Rescue services want to run the driving time analysis across a point network to assess response times for future equipment purchases or personnel hire justifications.
  • Marketing pros use mass driving time analysis to gauge mail delivery times across states before coupon redemptions at store locations.
  • Real estate agencies find it advantageous to publish driving times from specific home locations to retail store and public resource locations to entice homebuyers with access to conveniences from their future home.
  • Logistics managers use multipoint distance spatial queries to track fuel and travel expenses and estimate delivery times.

Calculate Driving Distances or Times from One-to-Many Addresses

MapBusinessOnline Pro makes this time and distance analysis across a complex set of locations incredibly straightforward:

  1. Pro users enter a destination address in the Address Bar in the upper left corner of the application. Follow the address protocol of Address, City, ST. or input a latitude-longitude coordinate. Click the Binocular icon button to the right of the Address Bar to place the point on the map.
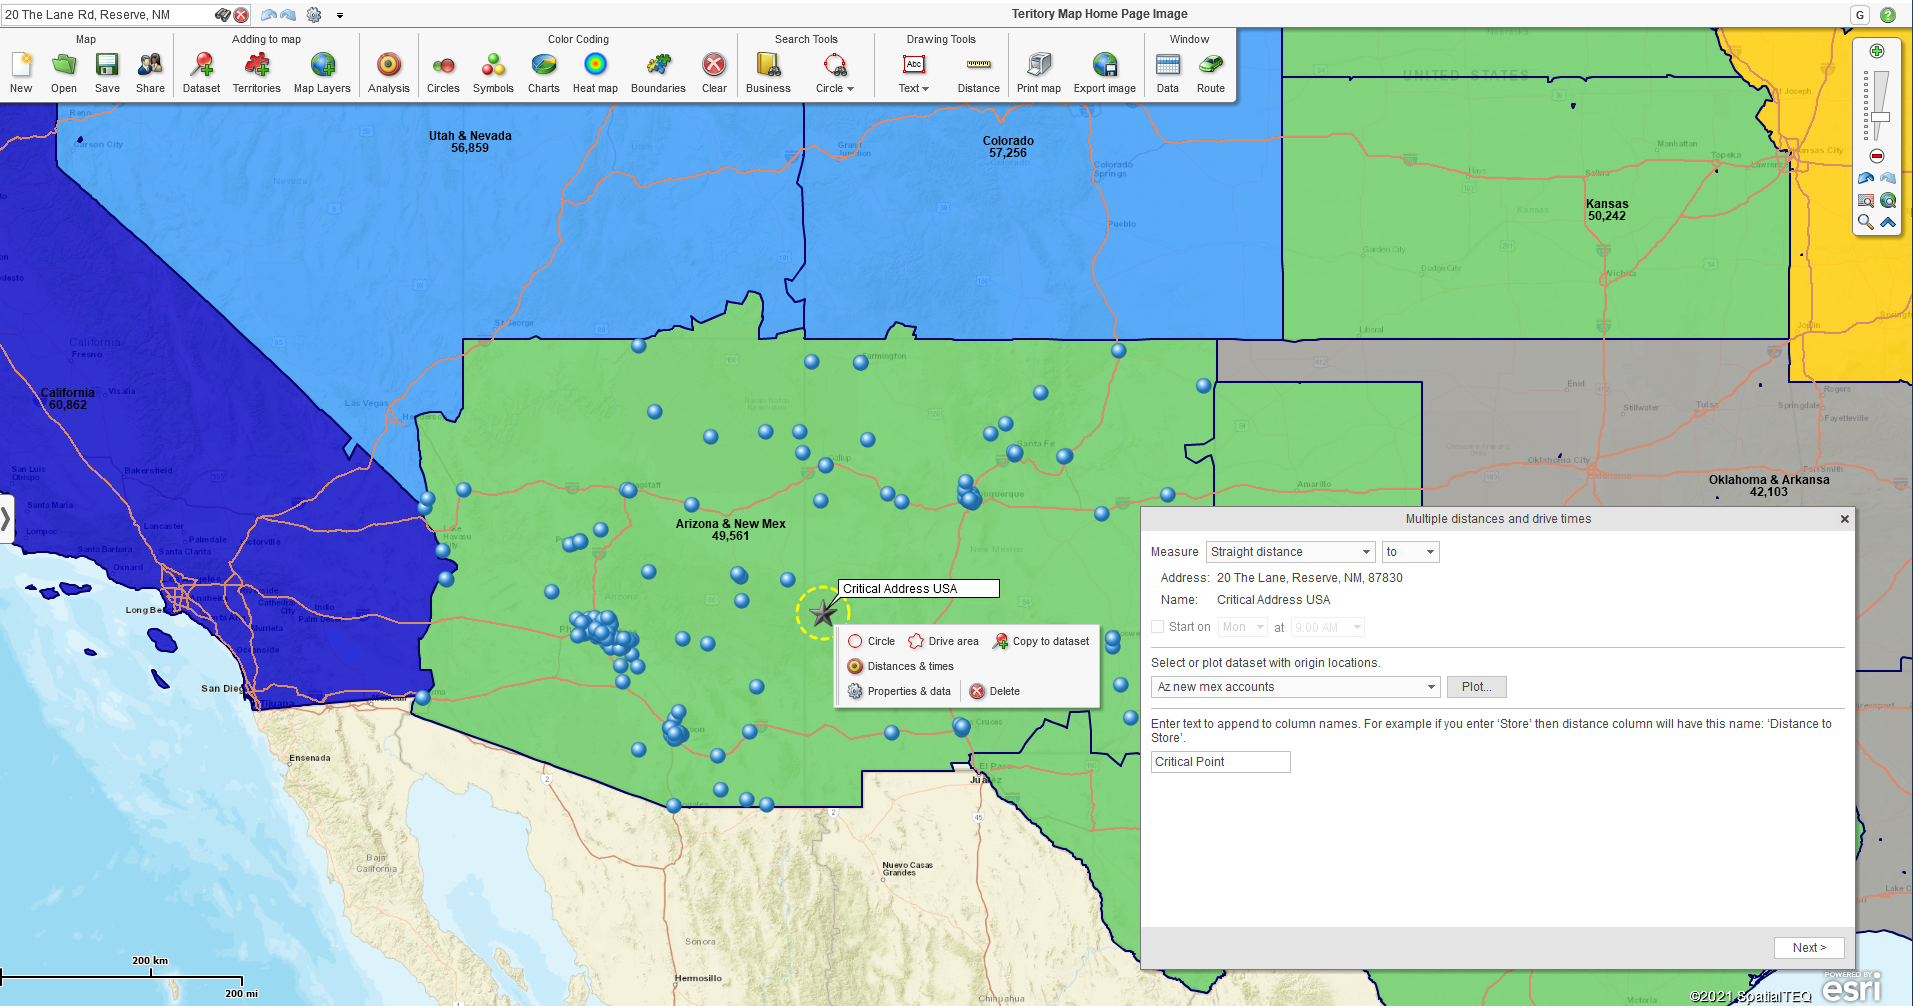
  2. The plotted single point will appear on the map, with the map extent Zoomed into the immediate area surrounding the point. A small menu or dialogue box will be associated with that point. In the dialogue box, select Labeled ‘Distances and Times.’ This option only appears if you have a subscription to MapBusinessOnline Pro.
  3. A new dialogue box opens, requiring some input from the map user:
    1. In the top-left dropdown, select from the distance options provided. The possibilities include Straight Distance, Driving Distance, Driving Time, or combinations of these options.
    2. In the top-right dropdown, select either From or To.
    3. In the next section, select an imported dataset or plot the imported dataset of interest.
    4. Finally, in the bottom section, provide the column header text you desire to see in the Data Window output—for example, Driving Distance to Center Point.

The driving time/distance analysis calculates the distance or driving time from point A to every point in the submitted dataset. The user decides if that distance is a straight line or the distance along the road network. Of course, the user could also select driving time instead of driving distance.  You get to choose.

Distance & Time Calculation Dialogues in MapBusinessOnline Pro

MapBusinessOnline driving time calculations take into consideration: road classifications, speed limits, turn restrictions, one-way/two-way, and even historical traffic by time of day.

The query results appear in the MapBusinessOnline Data Window as a tabular spreadsheet. The business map user could also choose to have two options calculated:

  • Straight line and driving distance.
  • Driving distances and time.
  • All distances and times.

The results of the query add additional columns to the imported dataset. All resultant spreadsheets are exportable to a CSV file format by clicking the Export button on the far right of the Data Window toolbar.

Experiment with the Distances and Times calculation in MapBusinessOnline Pro using a client or business resource address list. This calculation could be beneficial for businesses managing:

  • Field installation and repair networks.
  • Banks and financial field assets.
  • Long-term home care client networks.
  • Mobile social services that cater to rural at-home clients.
  • Field sales groups that manage and balance sales territories.

MapBusinessOnline Standard and Pro provide optimized routing for traveling businesspeople, including turn-by-turn directions. Couple that with business map views, market analysis, and sales territory management, and you’ve got a full-featured geographic profile of your business.

Explore the geographic elements available in MapBusinessOnline Pro and Standard today. It’s never too soon to leverage the power of location for business improvement.

_______________________________________________

Discover why over 25,000 business users log into www.MapBusinessOnline.com for their business mapping software and advanced sales territory mapping solution. The best replacement for Microsoft MapPoint happens to be the most affordable.

To access MapBusinessOnline, please register and download the Map App from the website – https://www.mapbusinessonline.com/App-Download.aspx.

After installing the Map App, the MapBusinessOnline launch button will be in the Windows Start Menu or Mac Application folder. Find the MapBusinessOnline folder in the Start Menu scrollbar. Click the folder’s dropdown arrow and choose the MapBusinessOnline option.

The Map App includes the Map Viewer app for free non-subscriber map sharing.

Please read customer reviews or review us at Capterra or g2crowd.

Contact: Geoffrey Ives geoffives@spatialteq.com or Jason Henderson jhenderson@spatialteq.com

Posted in Business Mapping Software blog post, How to instruction, Sales and marketing | Tagged , , , , , , | Leave a comment