I’ve Just Been Made the Business Map Maker – Help!

“OMG!” BTW that is netspeak, and it stands for ‘Oh My God.’ It’s an Internet/social media acronym used to abbreviate common phrases for short messages and texts – similar to LOL for ‘Laugh Out Loud’ or WTF for ‘Why The Face?’

You’re welcome. Sometimes it helps to have a Baby Boomer around to mansplain things.

Well, anyway, the OMG! Exclamation is because you just found out your MapBusinessOnline company map creator has left the company, and you are now in charge of managing the maps he had created. Congratulations! The person directly responsible for developing business maps for the company is you.

The boss made it clear. He wants you to, ‘Clean up those maps we’re using and learn how to create new maps using MapBusinessOnline.’ You’re new to business mapping software and more than a little nervous about taking on business mapping in addition to your other duties.

Relax. We can help.

And keep in mind, business maps are critical to business analysis for many companies. They provide an array of business analyses that can give your organization a competitive edge:

Location-based business analysis is valuable for any business. And that makes your efforts towards creating clear and concise business maps useful as well. Be sure to include business mapping skills as a bullet on your resume or CV. It matters.

And – because MapBusinessOnline is a cloud service, business maps are easily managed in a work-from-home environment. In your PJ’s, no less.

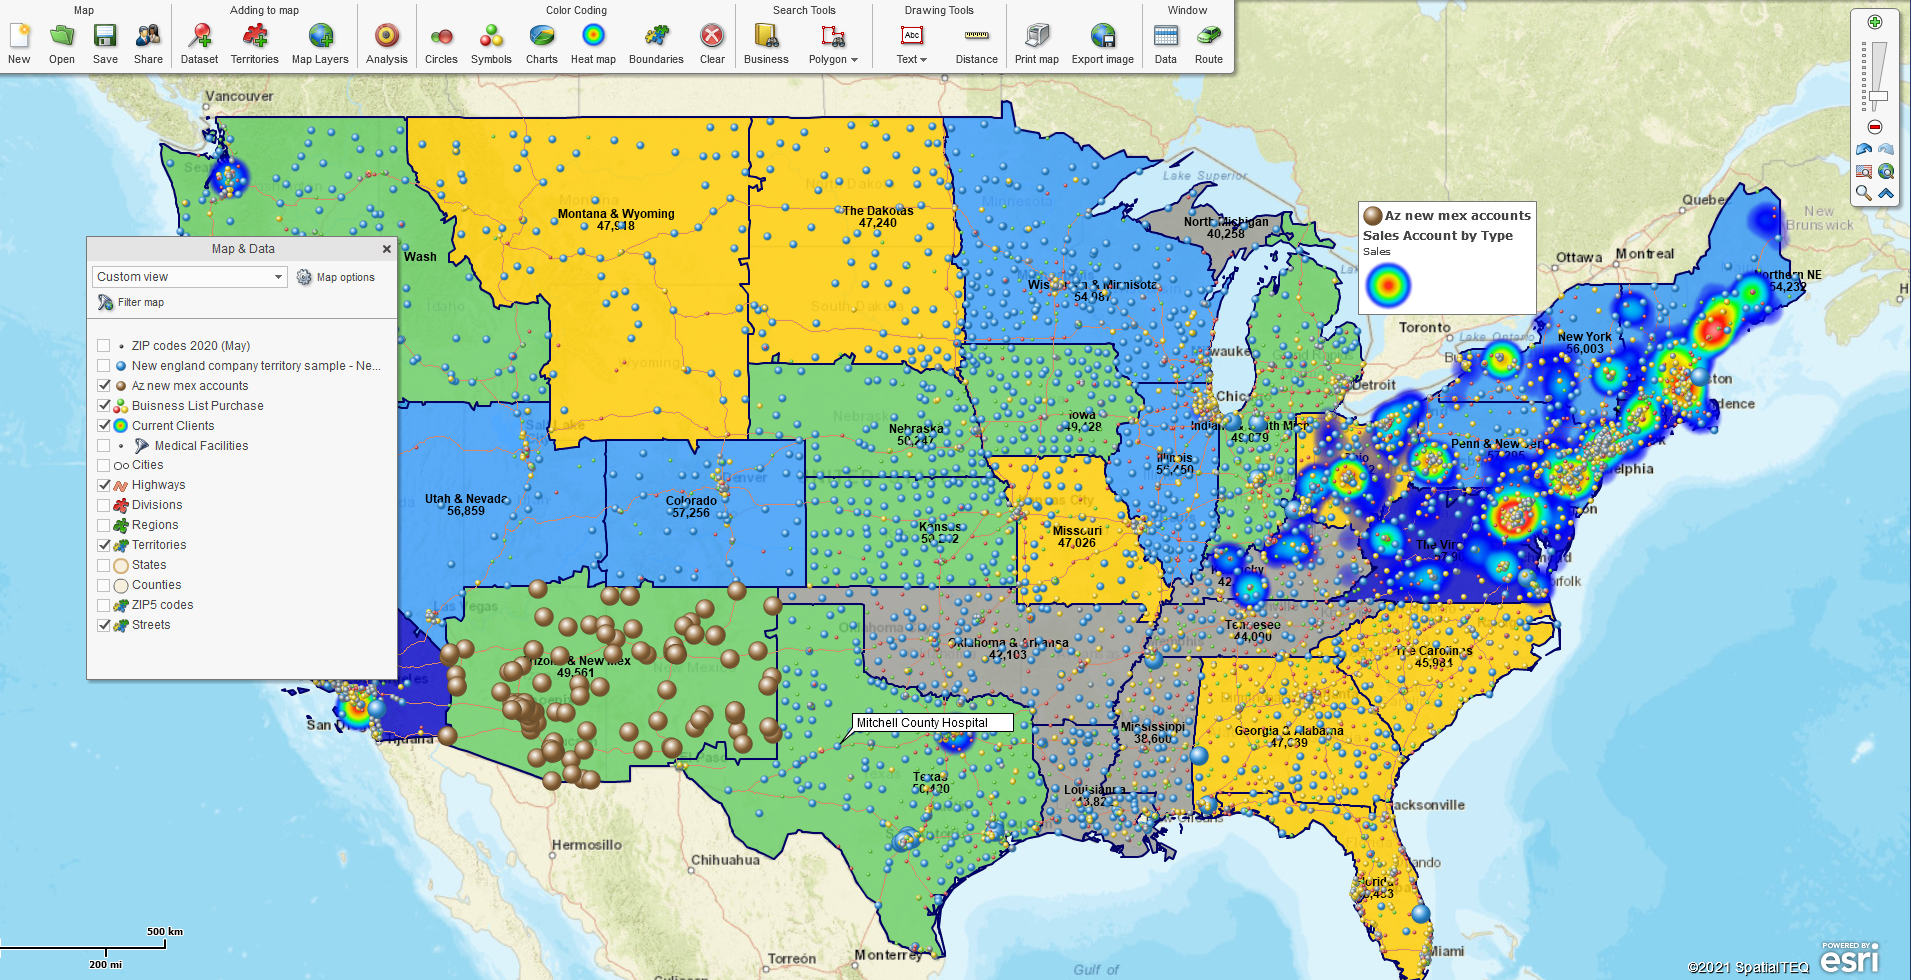
This Could be Your Inherited Map

Help Getting Started

We have a bunch of articles on how to create new maps. Here’s a quick list of sources you can pull up from the MapBusinessOnlin blog, specifically designed to help new users get started mapping and how to optimize their business map:

You’re thinking, ‘But what happens when you inherit business mapping responsibility? Because the previous map gal has left the company. I can’t ask her.  The boss has designated me as the New Map Geek.’ No sweat. Read on.

Watch a web demo video and maybe take a stab at creating a business map – How Do I Create My First Business Map?

Account Ownership

Each MapBusinessOnline Standard subscription is for one user only. If there is an existing subscription and you can log in, use the Help Documentation to explore updating the email for your access only. If you require help from us to reassign subscription access, please get in touch with us via email. Please send an email to a MapBusinessOnline salesperson or reach out to us through the Contact button. Requests for us to adjust account settings must be in email form for privacy protection. Chat and phone do not protect your company’s privacy.

For general help, click the Help ‘?’ button in the upper righthand corner of the map. Also, use the topic lookup in the Blog.

Working with Existing Maps

Your predecessor probably created a few maps. Those maps may be overwhelming for you at first, especially if you’ve never worked with online maps before.

Saved maps are stored in the Open Map button on the left side of the Master Toolbar. Here you will find the My Maps folder filled with basic business maps related to your place of business somehow. You’ll also find the My Templates folder. These are maps of high importance – at least important enough to be isolated in the Templates folder safe from editing by others.

My Template maps are a safe place to store maps that took a long time to build or contain business data critical to company processes. You can open a My Template map, do some work, and then save it as a My Map. From the My Maps folder, you can share new maps with others. Templating protects the original work from accidental editing.

Open an existing map from either folder – My Maps, Recent Maps, or My Templates. The map will display some representation of your company’s business. It will have several components to the map view:

  • A background map layer is usually present.
  • A map layer of states, counties, ZIP codes, or a combination of these layers, is often included.
  • You may also notice imported business data on the map. Imported data will display as colored points or symbols on the map. These user imported points may have been converted into a heat map layer to show intensity.
  • Many territory maps are based on  ZIP codes. You can edit these layers by selecting ZIP codes and adjusting the territories accordingly. Read about editing existing maps here.

Tip: If you’ve edited a few things on the map and you decide to revert to the original map, click New Map on the toolbar and do not save the changes you made. 

Before you know it, you’ll be creating and editing maps with ease.

Take another look at the Recent Maps folder in the Open Map function. These are the maps worked on most recently. Open them up and view them. Think about how they relate to your business.

  • Are they pleasing to view?
  • Do you understand their purpose?
  • Or do they confuse you?

If the maps are not pleasing, that’s good news for you and your company. It means you will be improving those maps, and the company will benefit from your work And you will too, as lead Map Geek.

What does a Map Geek look like?

Actual Map Geek in the Captivity

But it could also be this:

Actual Map Geek in the Wild (me in 1959 with our dog Sneakers.)


Play with Map and Data

Map and Data tools control the look and feel of map layers in MapBusinessOnline. When Map and Data is engaged, it is a gray box that hovers over the map. Map and Data displays a checkbox for map layers and imported data layers.

If Map and Data is turned off, move your cursor to the far-left side of the map frame to halfway up. Click the small gray arrow button there to reengage Map and Data.

Using Map and Data, uncheck and check on the various jurisdiction map layers and imported data layers. Adjusting a few layers will give you a sense of how the tool works what data layers seemed most important to the previous map creator. Read more about Map and Data.

As you get familiar with the map layers, think about your people’s comments and suggestions regarding mapping.

  • What are they complaining about?
  • What’s the main reason your company uses business maps?
  • What improvements are they requesting?

If you are looking to make some quick fixes, look to the Map Legend. Map creators often leave the Map Legend unedited, which is a mistake. Map viewers naturally look to the Map Legend to understand the critical map layers. Get rid of reference layers like the State layer, which is an unnecessary legend line.  Edit legend labels to reflect correct layer names. Use names that your people will understand. Read more about Map Legend control here.

Consider requesting a Web Demo through the Contact button on the website or watch a web demo video.

Whatever you do, you should look forward to working with MapBusinessOnline and becoming a map expert for your business. You’ll be TCFS.

_______________________________________________

Find out why over 25,000 business users log into www.MapBusinessOnline.com for their business mapping software and advanced sales territory mapping solution. The best replacement for Microsoft MapPoint happens to be the most affordable.

To access MapBusinessOnline, please register and then download the Map App from the website – https://www.mapbusinessonline.com/App-Download.aspx.

After installing the Map App, the MapBusinessOnline launch button will be in the Windows Start Menu or Mac Application folder. Find the MapBusinessOnline folder in the Start Menu scrollbar. Click the folder’s dropdown arrow and choose the MapBusinessOnline option.

The Map App includes the Map Viewer app for free non-subscriber map sharing.

Please read customer reviews or review us at Capterra, or g2crowd.

Contact: Geoffrey Ives geoffives@spatialteq.com or Jason Henderson jhenderson@spatialteq.com

Posted in Business Mapping Software blog post, How to instruction | Tagged , , , , | Leave a comment

Would Your Business Benefit from Business Mapping Software?

Most businesses use Microsoft Office tools and Google business tools every day. Well, maybe not every one of us, but most of us working in an office use these tools regularly—we all access writing software, spreadsheets, and database management tools to get our daily jobs done.

Many organizations apply CRM and ERP systems to manage customer interactions, sales, purchases, and reporting. Such tools are accessed every day for sales processing, inventory control, and accounting. Business mapping software, on the other hand, isn’t always accessed daily. It’s a tool a business will derive benefit from when they suddenly realize they require it. Like when the company is about to build a growth strategy, forecast sales for next year, or fix a major problem.

Let’s face it; businesses exist to solve problems. A telecom company helps people communicate better. A grocery store solves hunger and thirst problems – and maybe some other basic human needs. But solution-oriented businesses have problems too. I’m reminded of the blues song, “My Problems Got Problems.” Businesses live to solve those problems. Well, like all other businesses, online business mapping software solves problems too.

So, what kind of problems does business mapping software solve, and how does a company know when it’s time to invest in location-based business software?

It’s Time for Business Mapping When

Business mapping alarms should go off if your business is becoming focused on an area or your business challenges are often described by referencing ZIP codes, counties, or other jurisdictions. One example might be a new eldercare business. We’ll call it Old Lady Daycare (OLD for short.)

A few weeks after this healthcare service opened, business was booming, and management pulled in new hires. Client home addresses quickly became essential to the application of homecare services and efficient billing protocols.

Create ZIP Code Territory Maps

As the weeks rolled by, it became clear that tracking field staff by ZIP code made the entire workflow more manageable, effective, and efficient. Business mapping software was purchased and used to:

  • Visualize client home locations by address for visit verification and tracking.
  • Create eldercare clinician territories that assure accountability and measure business issues.
  • Develop and share emergency maps that denote vital resources in the event of power outages or disasters.

Other Healthcare businesses may encounter a need for business mapping tools to manage marketing strategies. General practitioners, dentistry, physical therapy, and optometry offices pepper the suburban landscape with business locations offering routine in-0ffice services. Each of these offices will require marketing efforts.

Business mapping is like bothering to stop and look around you and observe details. It’s one more thing for solving problems.

Dentistry seems to be an exceptionally competitive marketplace that makes aggressive marketing a necessity. MapBusinessOnline can boast of many such healthcare practices using business mapping to:

  • Manage direct mail and email marketing initiatives. ZIP 5 and ZIP 3 codes are used to track and report on marketing impact.
  • Conduct office consolidation and expansion planning.  Population and income maps help plan business expansion.
  • Develop location-based strategies and outreach programs for attracting new patients. What works best: local seminars, postcard mailers, or door-to-door selling?
  • Lookup Business Listings by ZIP code or polygon area for outbound marketing.

As healthcare providers and medical offices expand, new office locations become necessary. Map-based demographic analysis can provide unique perspectives on ZIP code areas, answering questions like:

  • Demographic fit – Which neighborhoods provide the optimum demographic populations for our practice?
  • Identifying the Elder Communities – What is the total population of people ages 65 and up by ZIP code, town, or city?
  • ‘Is it Safe?’ – What are the crime statistics for the neighborhoods firmly under consideration? How will those facts impact client and employee safety?
  • ‘Winter is Coming’ – Does climate change impact any of our proposed locations, and how? Probably a standard question for future projects.

Finance Companies Bank on Location-Based Map Views

Banks and insurance companies worry about investments and property values. Portfolios of properties improve and lose value based on where they sit. Residential housing values impact their surrounding areas in a variety of ways:

  • What are the recent selling price trends of nearby homes and businesses? Is the movement up or down?
  • What are the median household income averages for families and household earners for the neighborhoods under consideration and the surrounding areas?
  • What are the top five crime stats for the portfolio’s key ZIP codes?

For banks, loan providers, and insurance companies, the problem is controlling risk. Finance companies make profits on sure things. Hurricanes, high crime rates, and political upheavals are a drag on profits. A well-crafted business map will define asset locations, assign asset values, and describe the significant risks impacting enterprise investments.

The adage, ‘bad news early beats bad news late’ is the mantra for major financial organizations. Nobody in that business likes surprises. Finance managers use business mapping to:

  • Visualize assets and field resources through drone camera feeds and remote sensing triggers.
  • Conduct demographic studies of critical asset areas.
  • Associate profits with areas of interest.
  • Determine location placements for offices, branches, and ATMs.

Referring Customers to Fields Techs

Call centers around the world manage mobile field staff support for end-users. The pandemic has only magnified this growing and crucial business mapping use case.  Millions of these customer support calls are resolved through online chats, calls, and emails.  But many service requests require in-house support. Technicians must be contacted and physically routed to the end user’s office or home location. These technician dispatches happen hourly for hardware technology companies, appliance repair services, pool maintenance businesses, and other service organizations.

Each remote service industry will have its own set of problems that can improve with business mapping. But common problem areas include:

  • Matching the appropriate technician to each case. This process can become complex depending on the specific technical issue. Is this support call routine or advanced?
  • Notifying the technician responsible for the requirement and making sure they get to the end-users location.
  • How do we deal with cancelations and verification of presence?
  • Reporting on all technical support service events at a month or quarter-end. Maps are for sharing and learning.
  • Create Drive Time based operations maps to better assess field technician reach.

Using Drive Time Visualizations to Analyze Shipping Patterns

Business problems are in search of a solution. If the problems have location components – an address, a ZIP code, a city – and often they do, then an investment in business mapping software will provide some answers. Business maps are not a panacea, they won’t fix everything, but they’ll probably make you and your business aware of new directions to take. And before you know it, you’ll be using business mapping software every day.

_______________________________________________

Find out why over 25,000 business users log into www.MapBusinessOnline.com for their business mapping software and advanced sales territory mapping solution. The best replacement for Microsoft MapPoint happens to be the most affordable.

To access MapBusinessOnline, please register and then download the Map App from the website – https://www.mapbusinessonline.com/App-Download.aspx.

After installing the Map App, the MapBusinessOnline launch button will be in the Windows Start Menu or Mac Application folder. Find the MapBusinessOnline folder in the Start Menu scrollbar. Click the folder’s dropdown arrow and choose the MapBusinessOnline option.

The Map App includes the Map Viewer app for free non-subscriber map sharing.

Please read customer reviews or review us at Capterra or g2crowd.

Contact: Geoffrey Ives geoffives@spatialteq.com or Jason Henderson jhenderson@spatialteq.com
 

Posted in Business Mapping Software blog post, How to instruction | Tagged , , , , , | Leave a comment

Cartographic Setup within MapBusinessOnline

I’ve been building business maps for many years now and have developed my process for setting up my business mapping. But many of you may be unfamiliar with the thought process and basic steps we map geeks go through when we start a new business map.  I thought it might be valuable to share my steps towards building a pulchritudinous and business-like map using MapBusinessOnline.

Setting Up the Map

First things first.  After launching the application, click New (far left) on the master toolbar to Create a New Map. For most of you, choose the USA map template. Or, if you must, select Canada or the USA and Canada map template.

Up comes the map of the USA with Map and Data hovering over the map. The Map and Data Box displays checkboxes for the more popular map layers and backgrounds. Click the little gray Right Arrow in the middle of your far-left screen panel if it’s closed.

I like to zoom in a tad. Click the plus sign once or twice on the upper right corner Navigation Scrollbar to zoom in. Or use the Navigation Scrollbar magnifier – bottom left – to create a Zoomed-in bounding rectangle.

I also optimize Map and Data for my needs, keeping it small and positioning it off the USA as much as possible.  I keep my Map, and Data dropdown (there’s only one) set at Custom View. If you find you are in perpetuum creating the same map setup, you can adjust this dropdown to your liking. But wait until you’ve made a few maps first.

Setting Up My Map Look Using MapBusinessOnline

Now keep in mind, you could permanently save your favorite business setups as a Map Template in the MapBusinessOnline Save dialogue.  A map template protects your critical maps from unintentional editing.  This is an easy way to begin each of your maps by selecting your favorite setup map scheme in the template option list.

Hint: Saving a map template could be a real timesaver for busy map-makers.

Adding Map Layers

Check on the State Layer listed in Map and Data.  Read more about Map and Data here. Hover over the layer and click Edit Map Layer Properties to edit the layer’s look and feel. I like the state layer boundary to be dark. Uncheck the State layer fill to let the map background show through. I also turn off the state layer labels because most map viewers know which states they’re viewing. In my view, state layer labels simply add clutter to the map. But under labels, you could choose to show state initials. Your choice.

Hint: Avoid adding clutter to your map because it distracts from your map’s purpose.  Always try to focus your map audience on the purpose of the map.

Consider adding other layers to the map, like the City Limits Layer. Think about your business map subject and the purpose of your map. If it is city-focused, the city limits layer can be helpful. If it is ZIP code-focused, then add the ZIP code layer to your map.

Turn on the ZIP Code Layer using Map and Data.  I like to apply a gray border to the ZIP codes and keep the internal fill a light green. Use the Edit Map Layer Properties button to control the look and feel of the map layer. Keep in mind, ZIP codes at a national map view are not very helpful because they generally appear pretty small.  Zoom in to more critical areas of your map to explore alternatives for a ZIP code area look and feel.

Zoomed In to View ZIP Code Detail

Demographic Mapping

Add a demographic theme to the ZIP code layer.  Try out demographics using a population category to get an idea of what a ZIP code thematic map looks like.

  1. Select the Boundary button on the master toolbar.
  2. Choose the ZIP code layer
  3. In the dropdown, select Demographic Data
  4. Choose the year 2018 (the most recent Census release – not a projection as are the 2019 and 2020 data groupings) and apply Population 2018.
  5. In the Color Box section, use only three color ranges (expand to more ranges when you get comfortable color-coding), and apply several gradations of Red or Blue.

Hint: Census data is updated after we get Census ACS updates. And no, the 2020 Census is not available to MapBusinessOnline quite yet.

Now view the map. Color-Code dialogue allows the map editor to uncheck the fill for colors ‘not in any range.’ This uncheck option simplifies the map and the map legend. Oh yeah, the map legend. Please read on.

The Map Legend

Once you’ve added map layers, and especially after you’ve color-coded the map, you’ll see the Map Legend appears over the map. Move the legend to an unobtrusive spot on the map. Perhaps drag it over a body of water. Or place it in the St. Lawrence River valley in Canada. It won’t hurt anyone up there. And it won’t clutter your map.

I remove any layer, not adding value to my map legend, like the State layer. Usually, no one needs a legend to tell them there are states listed on the map. Click the tiny little Legend Edit Gear in the upper right corner of the legend. This opens up the Legen Edit dialogue. Now uncheck the state layer.

I also consolidate that ZIP code layer labeling to combine Census Data with the ZIP code layer. That consolidation removes a legend line. For example, in my map displayed on this blog, the legend says “Population (2018) by ZIP5 codes” all on one line.

The Map Legend should be concise and orienting for your map viewers and not distracting and confusing so that your company Know-It-All can poke at it during your presentation. Don’t feed the company, Know-It-All. They are jealous of your map-making capability.

Map Background Options

The bottom check box listed in Map and Data is for adjustment of the Map Background. The most commonly applied map background, and the default background in MapBusinessOnline, is the Streets layer.  Click the Edit Gear to edit map layer properties and select an alternative map background in the dropdown.

Try a different map layer or two to see how they look. I often use the National Geographic layer. It adds some topographic value, and it has pleasant colors. Sometimes it’s nice to change the background, so your maps look a little different.

Save your preferred business map setup as a Template, as mentioned above.  All map templates show as a template option when you click New Map. How exhaustively convenient.

Hint: Read our blog for more best mapping practices. Use the search tool.

You’re a map geek now. Let your Geek Flag fly. If you create business maps that throw an appropriate light on business problems, you’ll be lauded for it. Just like I will be celebrated for using big words in my blog post.

_______________________________________________

Find out why over 25,000 business users log into www.MapBusinessOnline.com for their business mapping software and advanced sales territory mapping solution. The best replacement for Microsoft MapPoint happens to be the most affordable.

To access MapBusinessOnline, please register and then download the Map App from the website – https://www.mapbusinessonline.com/App-Download.aspx.

After installing the Map App, the MapBusinessOnline launch button will be in the Windows Start Menu or Mac Application folder. Find the MapBusinessOnline folder in the Start Menu scrollbar. Click the folder’s dropdown arrow and choose the MapBusinessOnline option.

The Map App includes the Map Viewer app for free non-subscriber map sharing.

Please read customer reviews or review us at Capterra, or g2crowd.

Contact: Geoffrey Ives geoffives@spatialteq.com or Jason Henderson jhenderson@spatialteq.com

Posted in Business Mapping Software blog post, How to instruction | Tagged , , , , , | Leave a comment

How Do Business Maps Handle Sales Territory Overlap?

Millions of businesses use sales territory mapping software is used by millions of businesses to support their sales organizations in many ways.  Some of the more commonly applied business mapping territory use cases are:

  • Define sales account responsibility for sales reps and other customer support personnel.
  • Share sales goals and track progress against objectives.
  • Sales planning purposes in team meetings and for sales reps on the road.
  • Franchise territory mapping to define franchisee areas of ownership.

Other non-sales departments also use territory mapping tools. Examples would include:

  • Accounting for tracking commission payments.
  • Operations for tracking field service technician distribution, product installations, or transportation and delivery systems.
  • Developing location-based market analysis.

In many ways, the primary purpose of sales territory maps is to improve and control account responsibility. All other applications and departments tap into accountability territory map views to get answers and solve problems.

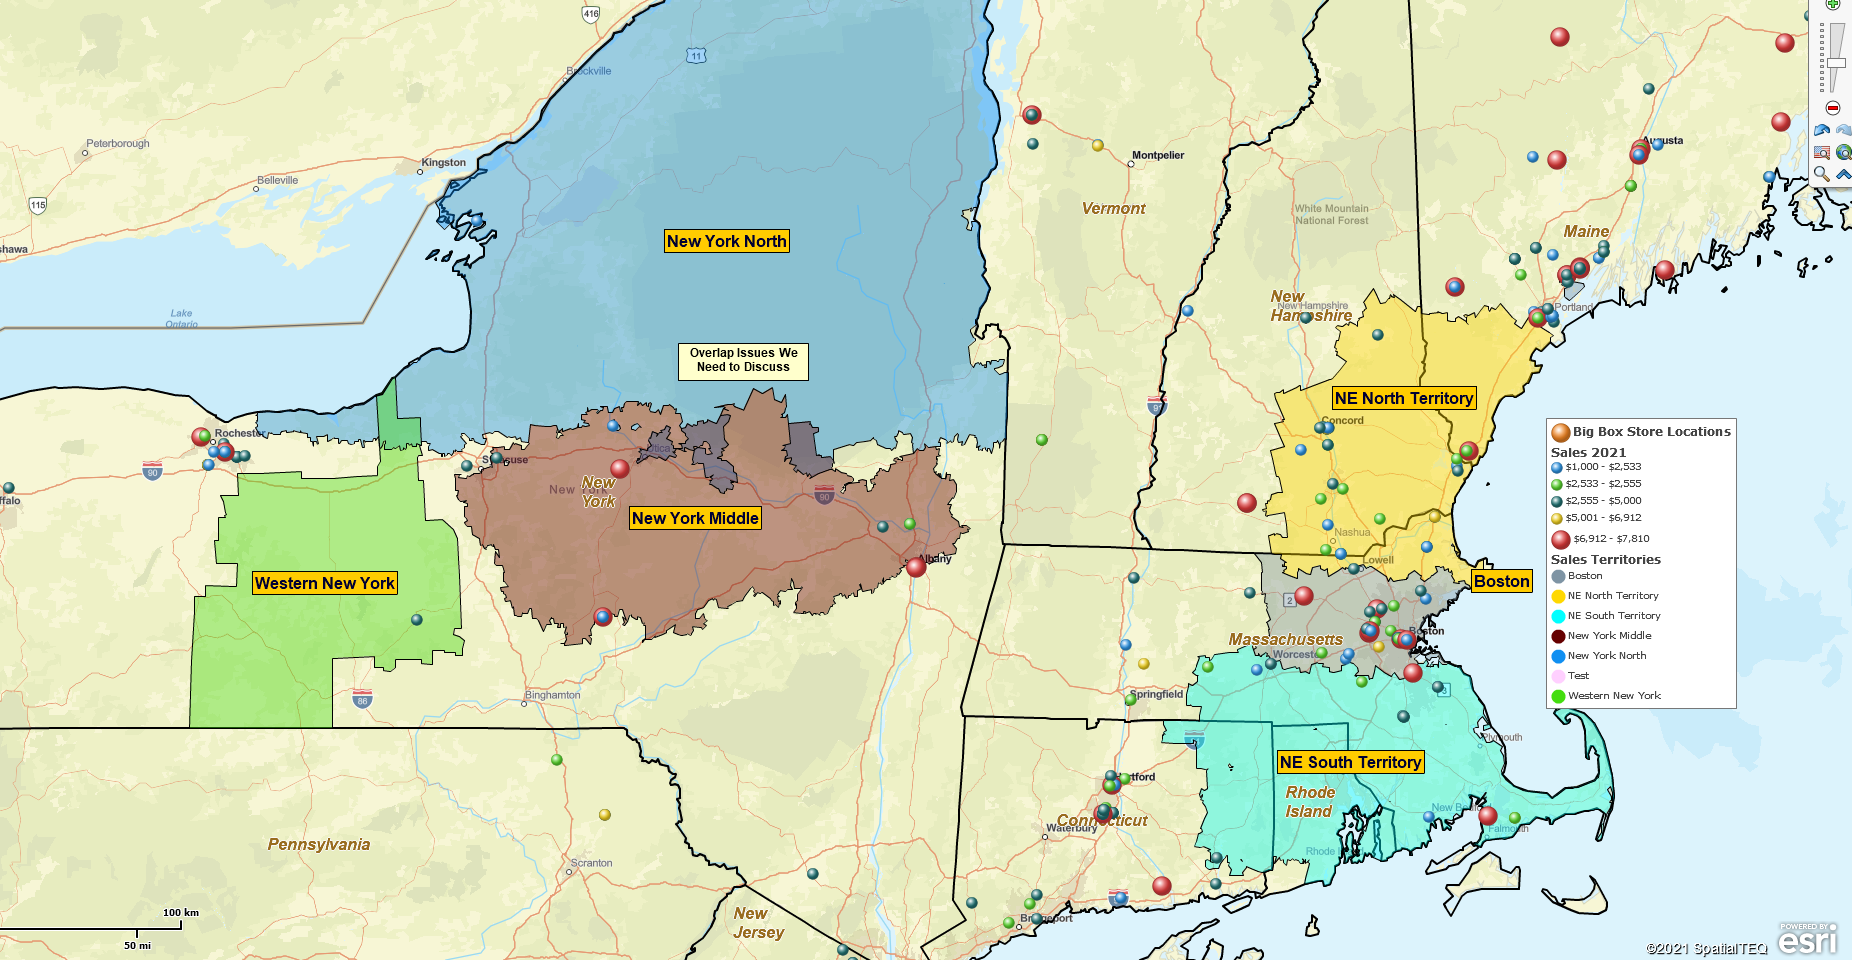
Because so many businesspeople access territory maps, managing overlap is very important. If a territory map system allows overlap, careful management and attention to detail are necessary to prevent chaos. There’s nothing worse when determining account ownership than getting the ‘He went that a-way’ answer.

“He went that-a-way.”


Picture the Three Stooges pointing arms in opposite directions.

Regarding sales accountability, territories define who is responsible for sales initiatives, customer follow-up, and internal paperwork resolution like unpaid bills or returns. Business, like life, can become messy.

Over my forty-year career in sales organizations, of one kind or another, overlapping territories have often caused trouble.  A common argument for overlap is legacy account management. Protecting legacy account ownership tends to be a demotivator for salespeople.

By legacy account, I am referring to old, lucrative relationships kept in place just because it’s the way we’ve always done it. Or, “Jim’s always covered that account. Janet won’t mind if he holds on to it.” Janet minds.

Allowing a legacy account to remain the responsibility of a tenured salesperson outside the territory detracts from commissions and leads to resentment between sales reps. Ultimately, the customer will be left with unresolved problems – refer to those infamous Stooges referenced above.

Salespeople are usually paid on commission for at least part of their compensation. Introducing overlapping territory accountability waters down the commission payout erodes the sales incentive and sows the seeds of dissatisfaction. I’ve often seen green salespeople overshadowed by legacy or seasoned sales executives move on to greener pastures where they outsell an entire team. Don’t pour water on the belly-fire of your latest hire just to keep good-old Jim happy in his sunset years.

Overlap can be strategic too. Paired coverage of the same territory might help new salespeople to come up to speed with the help of a seasoned pro. A gradual transition would benefit the old and new people as they manage new sales challenges and possibly new technologies.

Franchise businesses require overlap controls because franchise territories, by definition, usually imply an exclusive right to market products and services in a well-defined geographic area. Maps help sell and define franchise territories. Territory maps are often included in franchise rollouts’ selling, negotiating, and transactional processes.

The critical takeaway about territory overlap is to be aware that it exists and act on issues that arise from it.

MapBusinessOnline provides sales territory management tools highlighting overlap and allowing territory managers to consider alternatives to unfair sales incentive practices or other challenges related to overlapping territories.

Display Territory Overlap

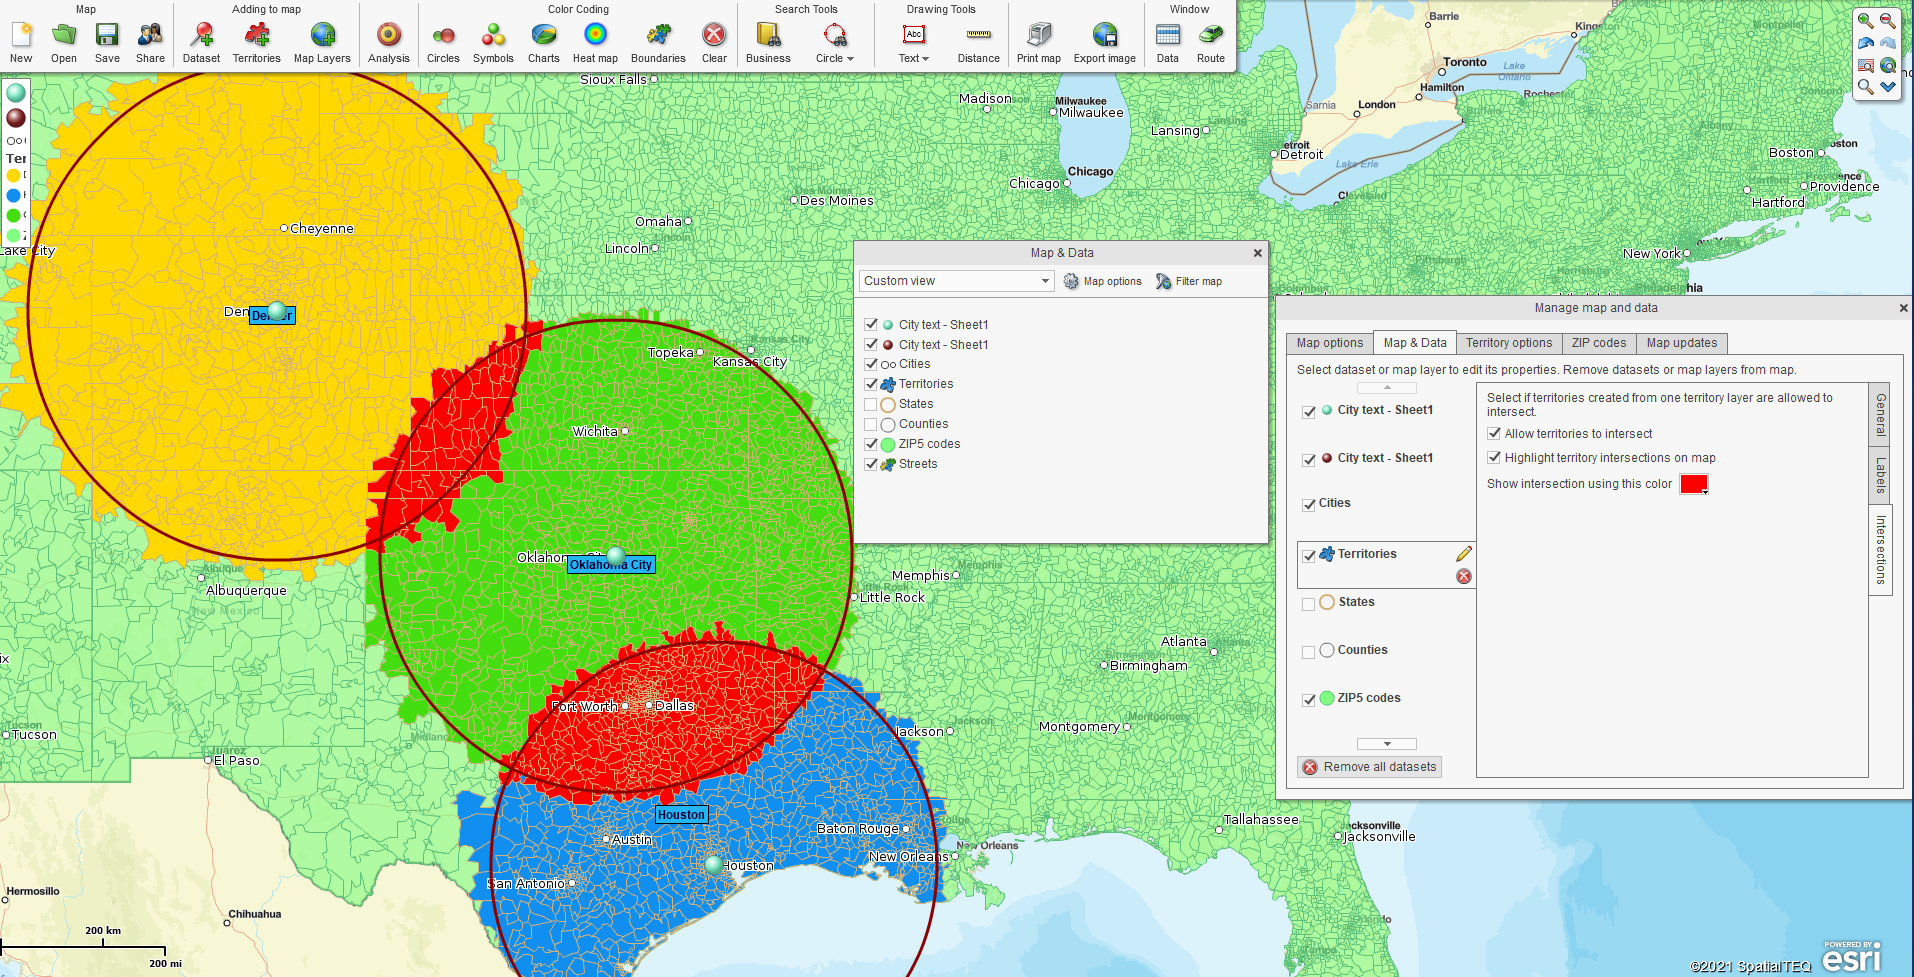
To access MapBusinessOnline territory overlap or intersection tools, open Map and Data.

  1. In Map and Data, along the top, click Map Options.
  2. Along the right side, click the Intersections Tab.
  3. Check the boxes for Allowing Territories to Intersect and Highlight Intersections on the Map.
  4. Finally, in the color box provided, select a bright color to highlight intersection areas.

These tools ensure your business map boldly displays those intersecting territory areas on a business map.

Setting up Territory Overlap Using MapBusinessOnline

Transportation & Delivery Networks

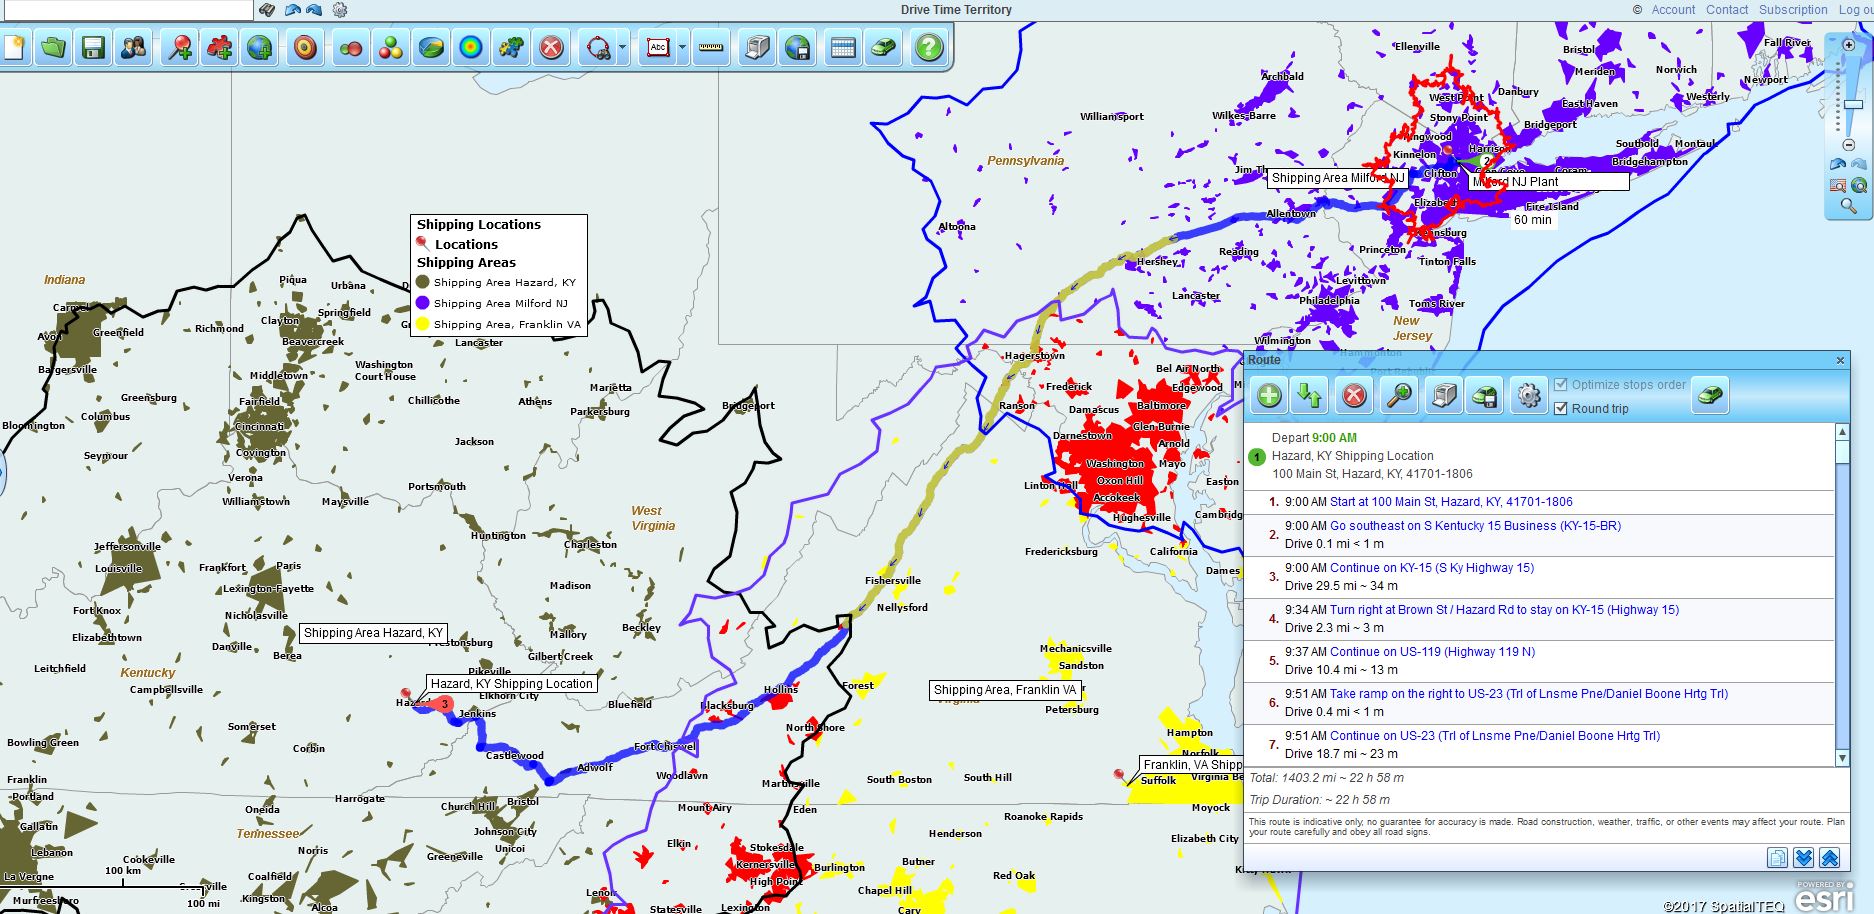
The transportation industry also applies territory management tools. Transportation and delivery systems develop and maintain territories that are usually carved out of highway and road networks. These delivery and pick-up areas represent repeat drop-off points for large shipment carriers, small-package delivery, and bus services.

Often, drive time analysis is used to establish territory areas. Inevitably sections of territory overlap develop. Consider small truckload pick-ups at regional airports. Carriers are contracted to pick up airfreight at transportation hubs and deliver the freight to outlying areas.

Territories for transportation networks may require overlap because airports and storage facilities service multiple urban areas. Thus, one truck carrier business located in St. Louis will be contracted to pick up freight from Nashville, and a truck from the same St. Louis carrier may be picking up freight in Memphis. Company vehicles moving freight across the territories inevitably overlap. Tracking the operational costs of the various pick-ups and drop-offs can be tricky.

In the above map image, several transportation network territories are depicted on the map. The territories use the ZIP code map layer as the territory alignment base. The color red is used to designate areas of overlap. In these overlapping situations, developing an exportable dataset of all ZIP codes that overlap with the territories noted can be helpful.

Export a List of Overlapping Zip Codes by Territory

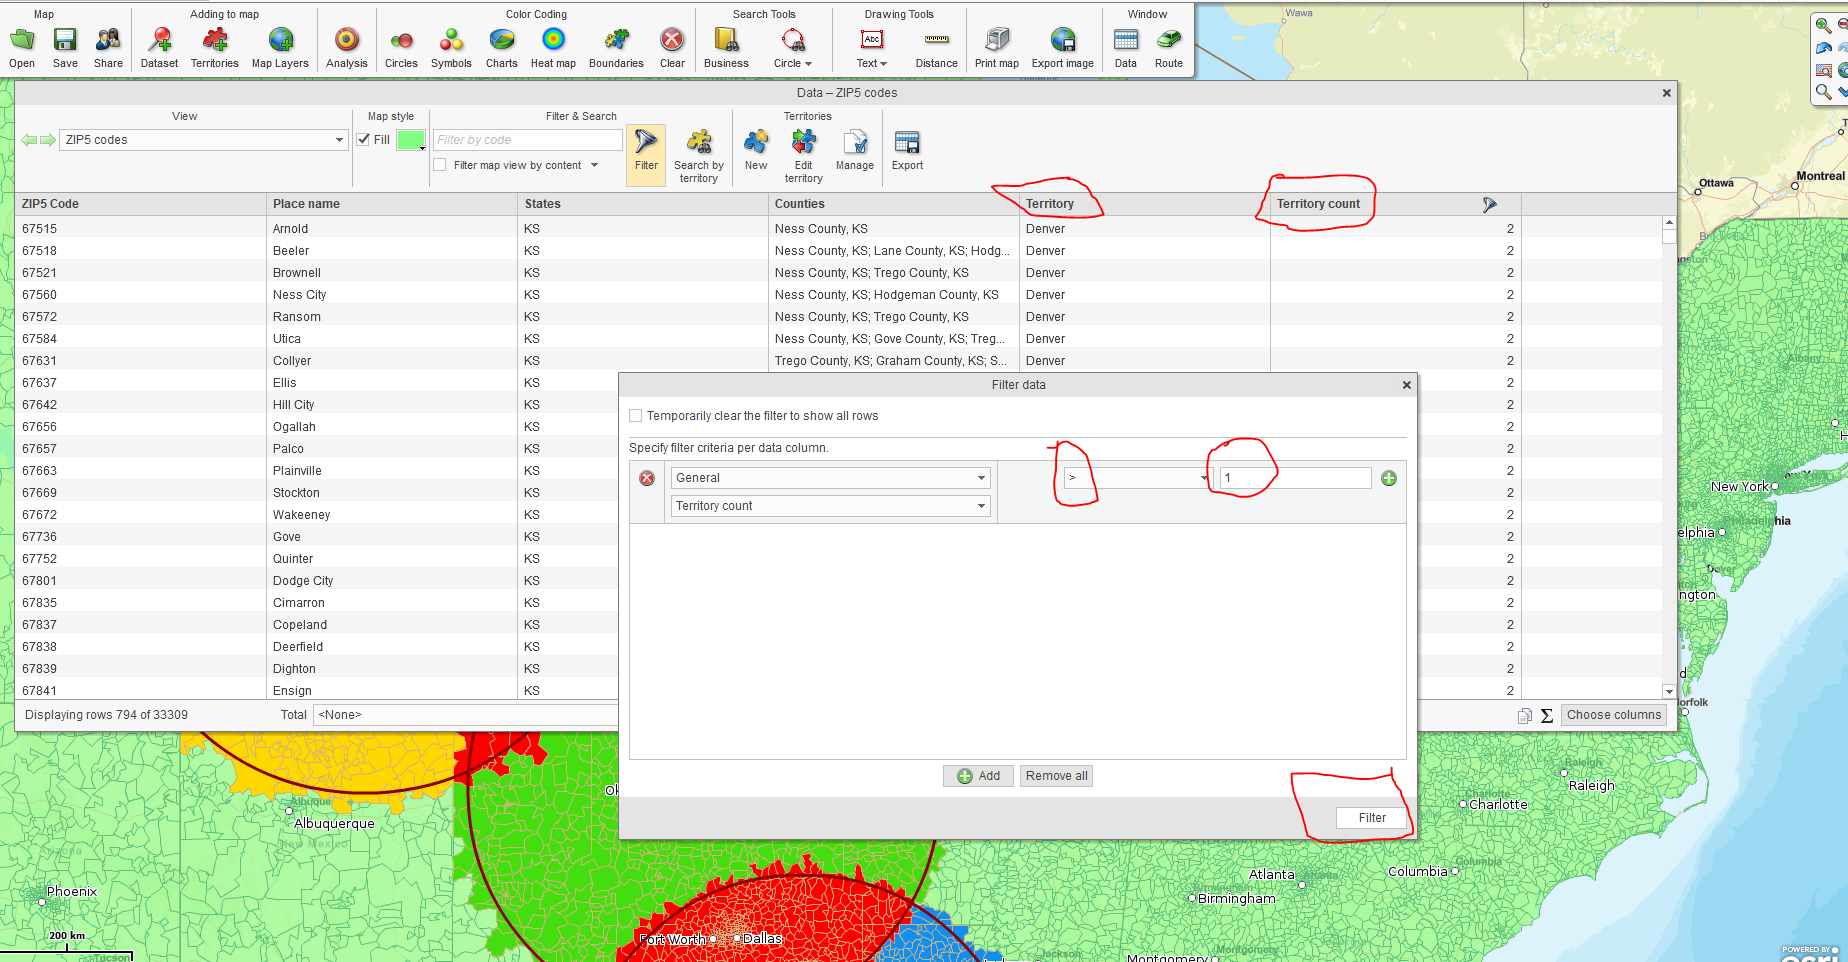
To help organize overlap complexity, MapBusinessOnline lets you create a marketing list by ZIP code and Territory. The resulting list will display doubled-up ZIP codes with the territory names. With territories created and visual color assignment assigned, pull up the Data Window view:

  1. In the Data Window, select the ZIP code layer in the left-side Dropdown
  2. Select the Choose Column button in the lower left.
    1. Move superfluous column data out of the analysis (like primary county, filler) using the blue arrows in the middle of the Choose Column window.
    2. Select these columns from General, Territories, and Territory Count, and move them to the right side. Exit Choose Columns.
  3. Click the Filter Funnel Icon.
    1. In the left-side filter, select General and Territory Count
    2. In the right-side modifier section, select the Greater Than sign ‘>.’
    3. In the far-right modifier numeric field, choose ‘0.’ This filters for a territory count greater than 0.
  4. Click Filter in the lower right to apply the filter. The Data Window now presents only the ZIP codes with overlapping territories.
  5. To export a list by territory, click the far-right Export button on the Data Window toolbar. Choose the bottom option in the export dialogue to ‘Segment by Territory.
  6. Export and save the file.

Overlapping Territory Filter Operation for Export

Think territory overlaps through carefully. If your business needs to allow territory overlap, MapBusinessOnline will accommodate your requirements. Ensure the overlapping territories you’ve permitted have a solid business reason for being there.

_______________________________________________

Discover why over 25,000 business users log into www.MapBusinessOnline.com for their business mapping software and advanced sales territory mapping solution. The best replacement for Microsoft MapPoint happens to be the most affordable.

To access MapBusinessOnline, please register and download the Map App from the website – https://www.mapbusinessonline.com/App-Download.aspx.

After installing the Map App, the MapBusinessOnline launch button will be in the Windows Start Menu or Mac Application folder. Find the MapBusinessOnline folder in the Start Menu scrollbar. Click the folder’s dropdown arrow and choose the MapBusinessOnline option.

The Map App includes the Map Viewer App for free, non-subscriber map sharing.

Please read customer reviews or review us at Capterra or g2crowd.

Contact: Geoffrey Ives geoffives@spatialteq.com or Jason Henderson jhenderson@spatialteq.com

Posted in Business Mapping Software blog post, How to instruction, Sales and marketing | Tagged , , , | Leave a comment

Why Do Large Enterprises Invest in Business Mapping Software?

Why would a large enterprise business like a bank, an insurance business,  a manufacturing concern, or a medical center consider purchasing business mapping software like MapBusinessOnline?

There are many reasons why large companies choose to purchase online mapping software, such as MapBusinessOnline, a secure, cloud-based map visualization tool.  Read more about business mapping software here.

Sales Territory Mapping

The most common reason business mapping companies come to MapBusinessOnline is for sales territory mapping.  A big company generally has an established level of territory mapping when they come to us. But those territories may be nebulous, filled with legacy account responsibilities, or just in need of updating.  The business may have morphed into something new, and territory design may need to shift from State-based territory alignment layers to ZIP-code or county alignment layers.

We still get a boatload of inquiries from enterprises whose sales territories date back to Microsoft MapPoint – a tool so old it’s got hair on it. Many ex-MapPoint users seek a replacement for this obsolete software. Expect some higher price points but more advanced functionality when you move on. (Unless you tapped into MapPoint’s fleet tracking capability, in which case you should expect to pay at least $10,000 more than MapPoint. Just saying.)

MapBusinessOnline – Sales Territories for Big Business

Sales territory mapping capabilities in MapBusinessOnline cover a wide variety of standard and advanced business requirements, including:

  • Addressing overlapping sales territory exposure.
  • Sales territory hierarchies (requires  MapBusinessOnline Pro version.)
  • Export monthly, quarterly, or annual sales results by ZIP code and territory.
  • Color-code territories by sales activity, demographic characteristics, or other numeric values.
  • Demographic and market analysis views of territories for expansion planning.
  • Franchise sales territory development and tracking.

These are just a few of the ways big and small enterprises apply territory maps.

An Insurance Mapping Project

Strategic Planning Maps

Big business executives spend a lot of time getting all strategic. That’s a significant aspect of their jobs. But to ensure their strategic vision is as forward-thinking and innovative as possible, they must consider a geographic analysis of their business, where it makes sense.

So, where does business mapping provide the best support for strategic planning? I’m glad you asked.

Generally, strategic planning is about growth. How fast can we grow, and can we financially support the expansion?  Business maps provide answers that enable faster growth:

  • Business Maps Expose Opportunities – Map-based or location-based market analysis can establish where a business is doing well and extrapolate that success to undeveloped sections of the country that present similar demographics.
  • Finding Gaps in Sales Coverage – Business maps displaying customer locations, color-coded by sales activity, can reveal gaps in account ownership and sales coverages. One insurance company dedicates a whole business map to exposing gaps in sales coverage.
  • Merger Maps – Acquisition planning for large mergers, such as hospital system’s mergers, requires an understanding of where potential acquisition targets exist.  Visualizations with firmographics of facility concentrations and competitor placements are prerequisites for merger decision-making.
  • Associate Mapping – Where do all our employees reside or start their day? This question has recently become much more interesting as the Work-from-Home workplace became the norm, post-pandemic. A business map quickly displays these locations and can be tweaked to present an employee location map from various perspectives:
    • Employee concentrations.
    • Employee access to high-speed Internet.
    • Employee proximity to health care services.

Maps Add Unique Perspectives to Strategic Planning

Risks and Liabilities

Any decent SWOT analysis is going to include a section on risks and liabilities. As businesses plan, they must consider known obstacles to growth and potential disasters that could impact a workforce, a supply chain, or a communication network.

This writer would like to believe that, as a nation, we’ve learned a thing or two about disaster preparation over the last 18 months. But then again, I don’t want to go out on a limb.

Risks and liabilities come in many flavors. A simple asset address or latitude/longitude map provides an essential reality check on where company investments are physically located:

  • How many buildings exist in coastal areas at risk of hurricane or extensive winter storm damage?
  • What communication networks does the company depend on for phone and computer services (inbound and outbound), and what impact would inclement weather have on those telecom assets?
  • Are call center resources adequately redundant and located far enough apart to provide overlapping support during power outages or pandemics?
  • Does the company have a high-speed internet work-from-home infrastructure covering 85% of the workforce?
  • Are critical business resources at risk of weather, war, pandemic, flood, or fire impact?

Utility companies monitor risks like the list above regularly. Other industries must also assess risks and their impact on their constituents, customers, and the bottom line.

The pandemic of 2020/21 has severely impacted critical aspects of all kinds of businesses, many of which have location components that managers can view on a map:

  • Supply chain impacts – Where are business-related bottlenecks occurring, and how can we help unblock them?
  • Labor shortages – Which cites report an available workforce within commute distances of our offices?
  • Where are the nursing shortages? Rank and visualize city limits by the percentage of vaccinated RN’s

We don’t claim to have answers for all the complex, post-pandemic issues US businesses face today. But I believe location-based analysis can assist in preparation for disaster and help identify where business challenges are most likely to occur. Business maps expose potential flare points and suggest mitigation pathways.

Security and Software Access

MapBusinessOnline is a cloud-based service. Large enterprises will want to ensure that their associates’ subscriptions to business mapping software in the cloud are safe and secure. At MapBusinessOnline, security and consistent access to maps and analysis are our primary concerns.

We subscribe to Www.Veracode.com for regular software penetration testing and security reviews. MapBusinessOnline is cloud-hosted by Microsoft Azure and includes all the security protocols Microsoft provides through hosted services.

SingleSignOn (SSO) access to MapBusinessOnline is available, making it easy for many end-users to safely and quickly sign-on. Ask a technical support representative to connect with your IT Group to set these access protocols up.

MapBusinessOnline privacy rules and login protocols protect your users and your business maps from outside access. Please don’t ask us to access your maps because we cannot. Your business maps are protected. Only your users can view and edit the maps they create.

So, there are lots of reasons why large businesses would invest in geographic mapping software like MapBusinessOnline. Not to mention the myriad of maps useful to business analysis in general:

The list goes on, like the beat. Rapidly expanding large enterprises need to add location analysis to their business processes for that geospatial perspective their competitors may already be viewing.

_______________________________________________

Find out why over 25,000 business users log into www.MapBusinessOnline.com for their business mapping software and advanced sales territory mapping solution. The best replacement for Microsoft MapPoint happens to be the most affordable.

To access MapBusinessOnline, please register and then download the Map App from the website – https://www.mapbusinessonline.com/App-Download.aspx.

After installing the Map App, the MapBusinessOnline launch button will be in the Windows’ Start Menu or Mac Application folder. Find the MapBusinessOnline folder in the Start Menu scrollbar. Click the folder’s dropdown arrow and choose the MapBusinessOnline option.

The Map App includes the Map Viewer app for free non-subscriber map sharing.

Please read customer reviews or review us at Capterra, or g2crowd.

Posted in A story, Business Mapping Software blog post | Tagged , , , , | Leave a comment

Supplementary Mapping Features Within MapBusinessOnline

In addition to business mapping core graphic and data tools, MapBusinessOnline includes a set of supplementary features that add tremendous value to both MapBusinessOnline Standard and Pro versions.

Managing Sales Territories Using MapBusinessOnline

We tend to talk about creating sales territories, color-coding imported customer locations, and finding more hot breweries to visit. (Maine is, after all, arguably the brewery capital of the USA.) Here are some additional MapBusinessOnline features included in our business mapping software that you may not be aware of.

USA School Systems Data – Not for everybody? Sure, but if part of your job is to compile a map of public and private school systems across the USA or a region, we’ve got you covered. Located in the Dataset – > Public Data folder, users can import point layers that describe school names, addresses, number of students and teachers, and basic information about each school.

Create a business map describing school systems. These school point layers are split into four nationwide sections because they are significant. Use the point views to create school district territories by ZIP code. View school district maps as a guide for cannabis retail outlet and grow-facility placements.  (Because these new businesses shouldn’t exist next to a school.)

Calculated Data Columns – Calculated Data Columns is accessed by map layer in the Map and Data box. You’ll find this functionality in Map and Data when you click the Edit Map Layer Properties button. Scroll down to see the Calculate Data tool.

A Calculated Data Column is a basic formula. The tool allows map creators to sum or divide data columns with each other. Any Calculated Data result is available for use in  Data Window analysis and the color-coding functions of MapBusinessOnline. Examples of how to use this powerful tool include:

  • Sum numeric data columns across like demographic data categories – income by age, population by age, or related consumer expenditures.
  • Divide demographic categories by entire populations to create ratios and percentages.
  • Divide or sum columns from imported business data. Or combine imported data with demographic categories. Get creative.

Create market analysis with demographic rankings. See our customer case study example.

Search & Segment Data Across Multiple Center Points by Radius

The first option under Analysis, Search & Segment lets the business map user collect geographic segments, like ZIP codes, for a defined radius around multiple center points. You can even draw the circles around up to 200 points at one time while generating territories based on City limits, Counties, or ZIP codes.

Use this tool to determine how many records from Dataset B fall within a radius of X miles of Dataset A. Save the results as a subset list in the Data Window. Check the Filter Map View by Content box to show only those records on the map.

Search and Segment Data is powerful functionality. It will give you a taste of the power of MapBusinessOnline Pro, which can add Driving time and Driving distance analysis to the party. Read more about the difference between MapBusinessOnline Standard and Pro.

Search & Segment Multiple Points by Driving Time (Pro feature)

Business Listings

Although this service can cost a little money ($0.15 per business listing), searching and downloading business listings works similarly to importing business address records. The tool is in the middle of the Master Toolbar under Search Tools. It’s the Yellow Pages icon with the binoculars.

Search for listings by NAICS or SIC Industry Code, business name, keywords, or search geographically. Plot business data points on the map and view firmographic data in the Data Window view.

  • Create competitor maps that display all your competing stores or offices on the map.
  • Find new customers based on industry type.
  • Filter and export records for use outside the application.
  • Secure contact information by company.

Add a visual point layer of competing companies or key resource locations to business analysis maps. Generate outbound call campaign contact lists by title.

Data Window – Choose Columns and Data Filtering

Not all of us working saps is a database wizard. Excel spreadsheets are as far as we got for many of us, riding the wave of technical advancement sweeping the world since 1980 (when I entered the workplace.)

But database management tools don’t have to be SQL to be effective.  MapBusinessOnline includes several light database management tools in the Data Window. Don’t be intimidated.

In the Data Window, click the Choose Column button in the lower right. Use Choose Columns to add demographic data, calculated data columns, and imported business location data to your analysis. Move data in from the left side, and pull data out from the right side.

Now close the Choose Columns function, and return to the Data Window toolbar to explore filtering options.

With imported data or a MapBusinessOnline map layer selected in the Data Window dropdown, the map creator or map viewer can filter that data using the Filter & Search section of the Data Window toolbar.

The ‘Filter by code‘ search box lets the user input a search term to quickly filter the left-most column of data.  Search by name, number, or range of numbers.

For example, select the ZIP code layer in the data dropdown. To set a filter range, put in a ZIP code, then a dash, and the end ZIP code number.  Wicked easy.

More advanced filtering happens when the user clicks the Funnel icon to the right of the ‘Filter by code’ search box. The funnel opens a full-featured data filter tool:

  • Select MapBusinessOnline map data layers, purchased business listings, calculated data results, or imported data for filtering in the Data Window dropdown.
  • Apply modifiers such as >, <, =, ‘contains’, ‘one of’, or ‘not one of’.  Try it. You’ll see the full list of modifying options enabling a variety of filtering options.
  • Export filtered data results for use outside of MapBusinessOnline
  • Save the filtered data results as a territory or a marketing list.

A business map users could apply MapBusinessOnline data filtering to:

  • Generate subset location-based business intelligence reports.
  • Conduct market analysis on city, ZIP code, or county map layers.
  • Define ZIP code-based territories by demographic characteristics.

MapBusinessOnline includes various tools and features.  Users will discover many direct and supplemental ways to explore geographies and geographic data and solve business problems.

Thank God for business problems.  Without them, we’d all be unemployed, stuck at home watching TikTok videos.

_______________________________________________

Find out why over 25,000 business users log into www.MapBusinessOnline.com for their business mapping software and advanced sales territory mapping solution. The best replacement for Microsoft MapPoint happens to be the most affordable.

To access MapBusinessOnline, please register and then download the Map App from the website – https://www.mapbusinessonline.com/App-Download.aspx.

After installing the Map App, the MapBusinessOnline launch button will be in the Windows’ Start Menu or Mac Application folder. Find the MapBusinessOnline folder in the Start Menu scrollbar. Click the folder’s dropdown arrow and choose the MapBusinessOnline option.

The Map App includes the Map Viewer app for free non-subscriber map sharing.

Please read customer reviews or review us at Capterra, or g2crowd

Contact: Geoffrey Ives geoffives@spatialteq.com or Jason Henderson jhenderson@spatialteq.com

Posted in Business Mapping Software blog post, How to instruction | Tagged , , , , | Leave a comment

What is Business Mapping?

What is Business Mapping, anyway?

Business mapping is applying advanced location technology towards building digital visualizations and geographic models of commercial activities.

A business map is an accurate digital, geographic model of the world, or a place within the world, overlayed with business data, map objects or shapes, and text to describe a business situation.

General business users use these business mapping models to understand their business opportunities, risks, and trending positive or negative factors impacting growth. In its plug-and-play nature, business mapping breaks from Geographic Information System or GIS mapping, which offers more customizable and scientific geographic analysis and necessitates trained technicians and significant investment.

As opposed to more advanced GIS mapping tools, business mapping is accessible to the general business public in monetary commitment – the tools are affordable – and through ease-of-use – the tools are relatively easy to learn and apply quickly. Businesspeople use business maps to plan expansion – to mitigate known and unforeseen obstacles to trade.

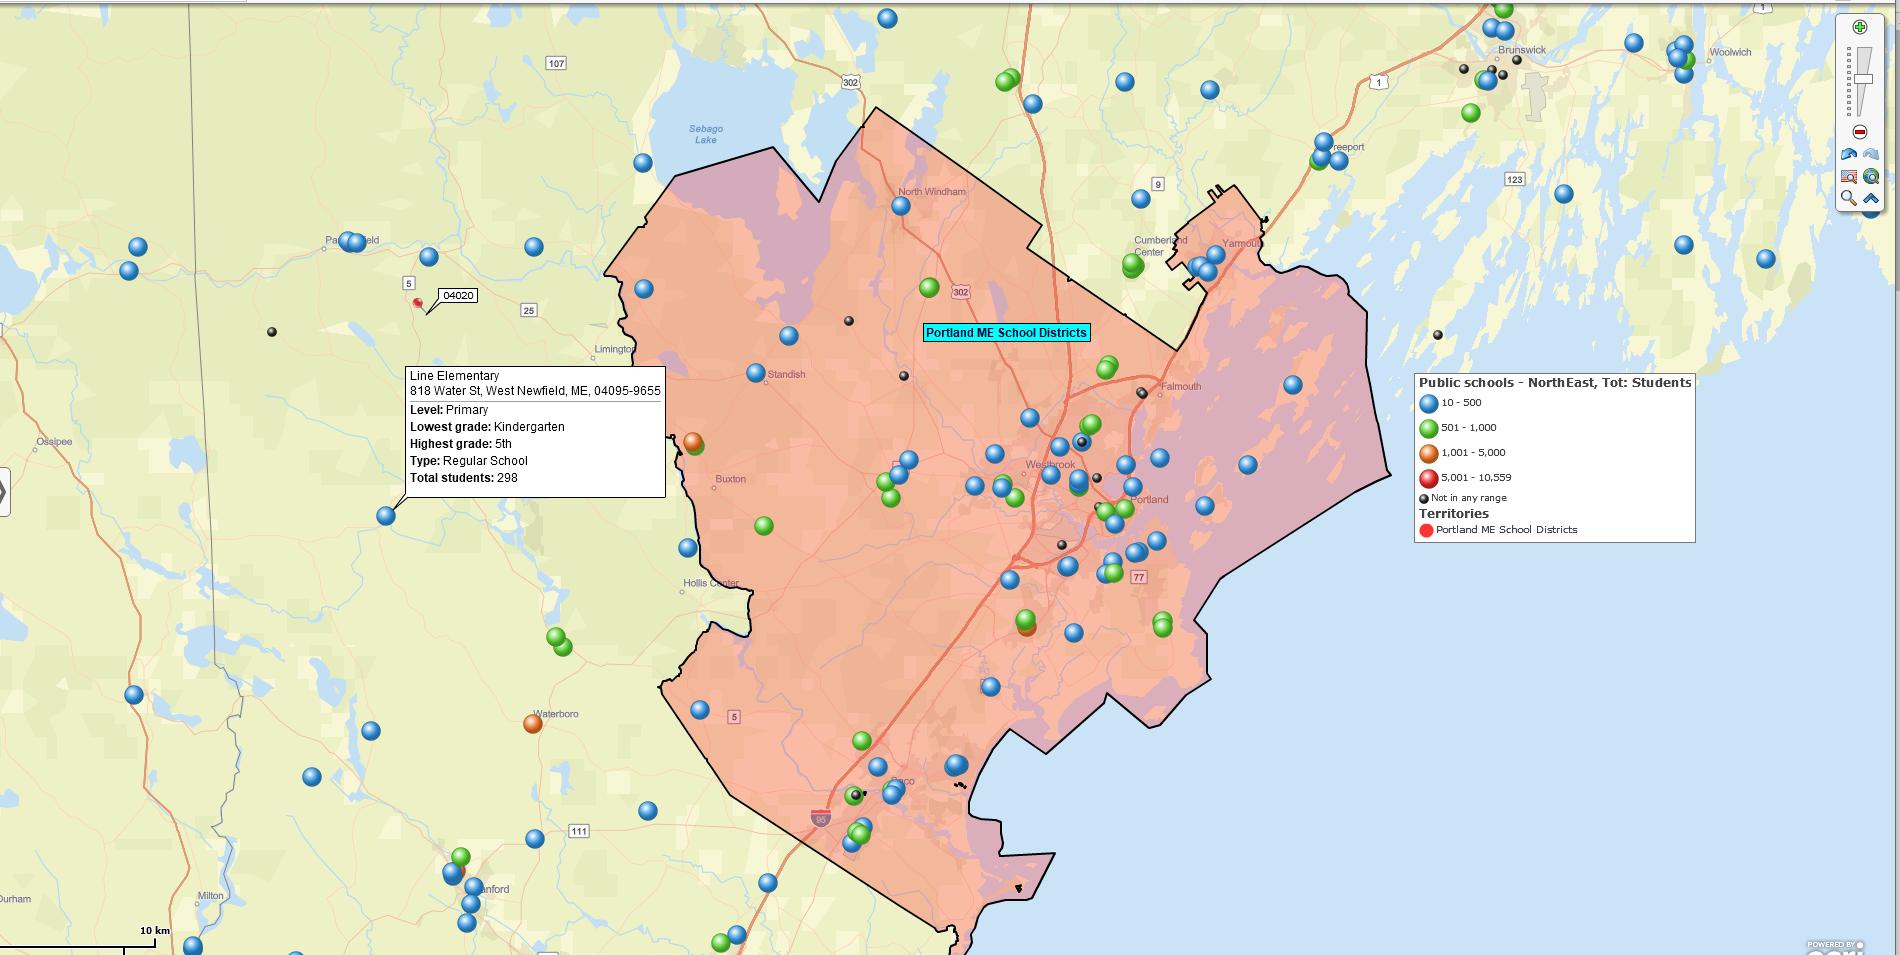
A School District Business Map Created Using MapBusinessOnline.com

Business Mapping Software

Business mapping desktop or cloud-based software services are the software platforms developed by a half-dozen or more technology companies that offer location-based solutions, including:

Various digital map views and map layers can be combined to provide engaging and informative geographic views of business data.  Customer address lists, sales revenues by area, and product registrations by ZIP code, for example, can all be viewed against a map in a way that delivers answers to crucial business questions like:

  • What ZIP codes are responsible for the majority of sales?
  • Where do most of our customers live compared to where our product technicians start their day?
  • What region purchases the least amount of XYZ product and why?
  • What is the best performing ZIP code for our services, and where can we find untapped ZIP codes with similar demographics?
  • Based on the number of clients per 50-mile radius or 50-minute drive time, where should we seek to hire new support technicians?
  • How should we construct our franchise territories to reflect roughly balanced opportunities based on demographics?

Business maps provide business answers to questions like the ones listed above. Users of business mapping software can develop a variety of map-based business analyses that expose trends in business, trends not necessarily discoverable through spreadsheet analysis.

Health Care System Analysis Map Using MapBusinessOnline.com

A significant benefit of Business mapping software is that it provides multiple map-based views of business situations to solve business challenges. Business maps meld together a variety of graphic layers, location-based datasets, and background views to present comprehensive map views with tabular data.  These maps views include:

  • Choropleth maps – Thematic maps based on demographic data or imported business data.
  • Color-coded symbol maps – Imported location-data points color-coded by data columns.
  • Demographic Maps – Accessing a comprehensive library of demographic categories.
  • Dot density maps – Thousands of data points revealing dense clusters in certain areas.
  • Driving time and distance queries – Map analysis across a USA-wide road network, in all directions.
  • Territory maps – Maps that reflect areas of accountability for sales, service, or other work-related activities.
  • Heat maps – Maps that reveal high or low levels of numeric data-driven intensity.
  • Market Analysis Maps – Comprehensive demographic categories overlayed with imported business data for decision-making.
  • Spatial Searches – Radius and polygon data searches of user-defined areas exposing location-based data trends.
  • Territory maps – Maps that reflect areas of accountability for sales, service, or other work-related activities.
  • Vehicle route map – Map views and efficient directions for business-related travel.

These map visualizations and thematic maps combine location-based data with graphic drawing and search tools to describe or reveal business realities.

Situational Awareness

Like business mapping’s parent software, Geographic Information Systems (GIS), accessible business maps synthesize digital illustration tools, data importation capabilities, and database management systems to deliver the map creator and viewers Situational Awareness around their business system.  Situational awareness is the desired perspective of most successful businesspeople. Always remember: Bad news early beats bad news late, every time.

Every business has its business model and a set of challenges it must overcome to maintain profitability and growth. Thorough business analysis in support of sustained growth requires more than just spreadsheets and brainstorming sessions.  Business mapping ingests standard business data and presents those data subjects against map views enhanced by additional datasets, such as imported industry data. Map-based analysis results generate situational awareness for the map viewer. Maps inform business planning just as they enhance criminal analysis and military strategy.

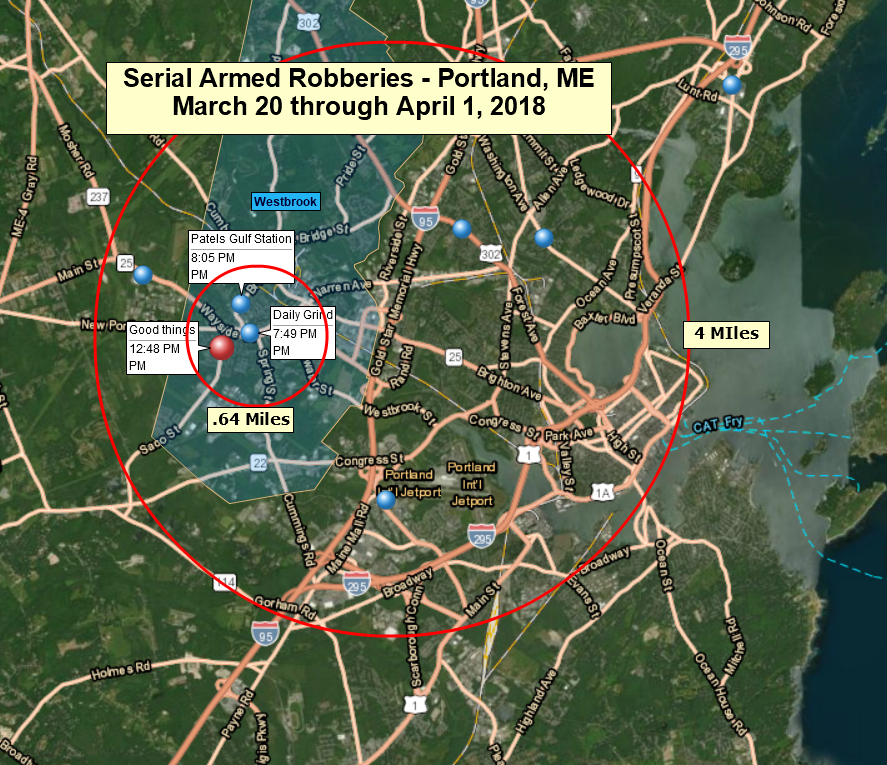
A Crime Map Using MapBusinessOnline.com


Examples of business map induced situational awareness might include:

  • Identifying all competing stores within a 30 minute drive time of our five new store locations.
  • Demographic profiles of target ZIP codes showing the last five years Median Household Income trends.
  • Recent arson events by address for a small city, including an address visualization of insurance claim ownership

Horizontal Applications for Any Vertical

In addition to accessibility, business mapping tools are flexible in application, meaning all industries can benefit from location-based analysis and data visualizations. Business maps are no longer the tools of just mining and oil & gas companies.

But in the same way that geographic maps expose opportunities and obstacles for energy and mineral extraction companies, maps offer run-of-the-mill, everyday businesses crucial assessments for operational planning and strategic plan development.

Any business in any industry will find a reason to apply business mapping software to their planning and analysis processes.

A map does not just chart, it unlocks and formulates meaning; it forms bridges between here and there, between disparate ideas that we did not know were previously connected.”  – Reif Larsen.

Business mapping software presents fresh insights into many of the toughest challenges business people encounter.  And what business couldn’t use an affordable, competitive edge? Maps are nothing new, but business mapping may provide just the right new perspective to make a difference.

_______________________________________________

Find out why over 25,000 business users log into www.MapBusinessOnline.com for their business mapping software and advanced sales territory mapping solution. The best replacement for Microsoft MapPoint happens to be the most affordable.

To access MapBusinessOnline, please register and then download the Map App from the website – https://www.mapbusinessonline.com/App-Download.aspx.

After installing the Map App, the MapBusinessOnline launch button will be in the Windows’ Start Menu or Mac Application folder. Find the MapBusinessOnline folder in the Start Menu scrollbar. Click the folder’s dropdown arrow and choose the MapBusinessOnline option.

The Map App includes the Map Viewer app for free non-subscriber map sharing.

Please read customer reviews or review us at Capterra, or g2crowd

Contact: Geoffrey Ives geoffives@spatialteq.com or Jason Henderson jhenderson@spatialteq.com
Posted in A story, Business Mapping Software blog post, Sales and marketing | Tagged , , , , | Leave a comment

How Do I Import a Location Dataset of Electric Vehicle Charging Stations?

This week, a user contacted us looking for a location dataset of all Electric Vehicle Charging Stations across North America. They thought MapBusinessOnline business listings might have this dataset.

I knew MapBusinessOnline Business Listings data did have some EV Charging records, but when I viewed the data, it was less than 2,000 points nationwide.  I knew this data was inaccurate. I suspect that NAICS and SIC Industry code databases haven’t caught up with consumer demand for EV Charging Stations. So, to Google, it was.

As it turns out, the U.S. Dept. of Energy has an alternative fuels data center. Here, I was able to locate and download a dataset of 57,420 alternative fuel service stations.

The data is geocoded by latitude/longitude, which imports sweetly into MapBusinessOnline. In the Data Window, I filtered the data by Fuel Type = ELEC and discovered that Electric Charging Stations make up 50,263 of the total number. Not bad.

To apply such a Filter in our MapBusinessOnline business mapping software:

  1. Click the Funnel icon on the Data Window toolbar.
  2. In the dialogue box, on the right, select the imported data. On the left side, set the modifier dropdown to ‘=’ and insert the fuel type column option ‘ELEC’ for electric.
  3. Click Filter in the lower right, and he results will display in the Data Window.

Filtering results are both exportable and available for territory and marketing list creation.  Read more about data filtering in MapBusinessOnline.

Now, having bothered to import this not insignificant dataset of alternative fuel stations into MapBusinessOnline, what else can we do with it?

Color-Code by Point

Color-coding data points is a fundamental and popular feature of almost all business mapping tools.  A Dot Density map view can be visually stimulating when you have upwards of 5,000 points in the map view. (Not Niagara Falls visually stimulating, but maybe Christmas sweater visually stimulating.) Color-coding by data point generates a map visualization of imported data.

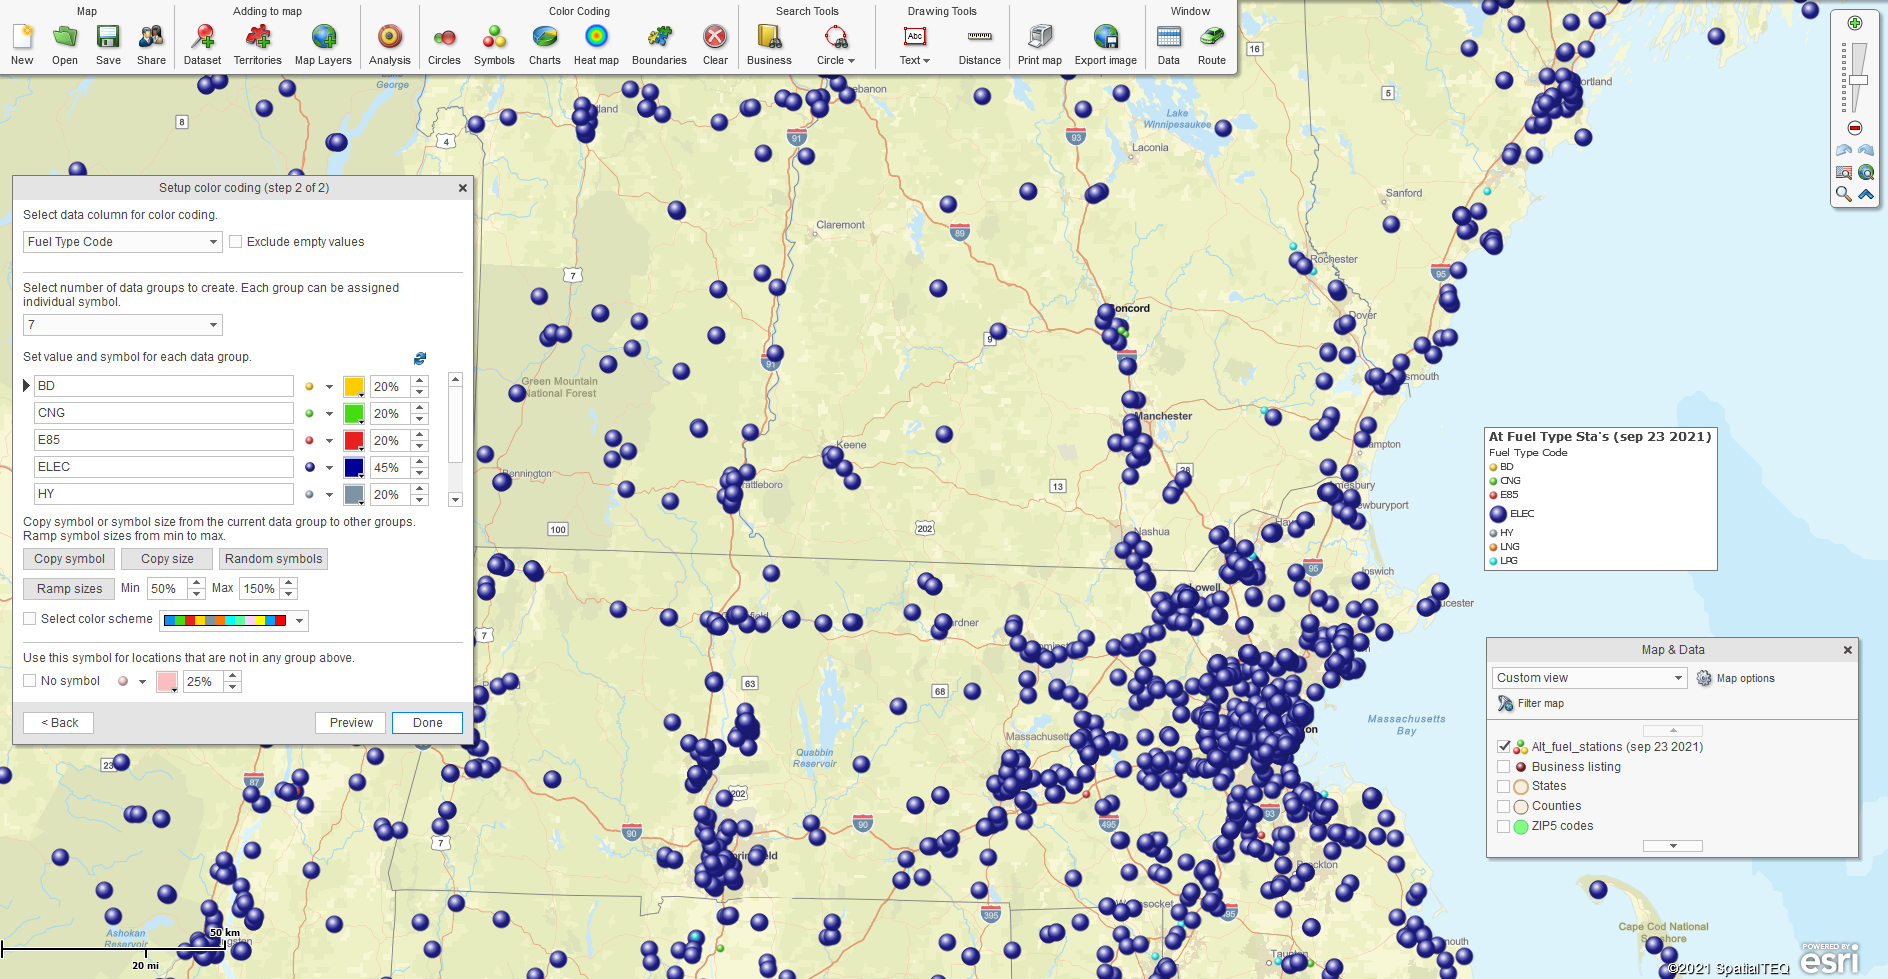
The imported dataset of alternative fuel stations provides at least seven types of fuel under Fuel type. My approach is to color-code on the Fuel Type column, making the non-electric points small and the electric points appropriately visible. After all, for our stated purposes, we’re just concerned with Electric Charging Stations.

Alternative Fuel Stations Color-coded by Point

With such a point color-coding process, our map can focus on the charging stations locations.  The map creator can append additional data to five flexible label fields or Callouts associated with each point with a little more effort. Callout labels can be turned on by default, turned on incrementally by clicking a point, or viewed as pop-up labels activated by cursor hovering.

Read more about labeling here.

Present the Data as a Value in a Circle

Along the MapBusinessOnline master toolbar, under Color-Coding, is an option for ‘Circles.’ This symbolization option allows the map-maker to replace the dots or points on the map with adjustable circles that display the text value of an Excel record within the circle.

This view can be valuable if the geocoded records on display include a critical numeric value. The decision to display a circle with numeric data will probably be made based on how critical that numeric value is to the map viewer’s decision-making process.

A dense field of numeric circles can be a lot of data for the human brain to process from a business map visually. Try to make the point layer on the map easy to read for your map viewers:

  • Keep colors easy on the eyes.
  • Make the most crucial point the most important color.
  • Make sure to explain map points and numbers using text boxes, the map legend, or map layer labels.

Color-Code by ZIP Code

Another approach is to color-code the ZIP code layer by the imported EV Charging Stations. This approach allows the point layer to be turned off entirely and lets the ZIP code layer provide a quick visualization describing the number of charging stations available within a given ZIP code.

If the map viewer decides they need to have more details, they can turn the imported data layer back on and scan the details in the Data Window.

Color-shaded ZIP code maps are sometimes called heat maps. MapBusinessOnline also includes a ‘heat map’ view that converts a point layer into a colored intensity layer like a weather map showing severe storm activity.

Read more about color-coding point layers.

Turn Up the Heat Map

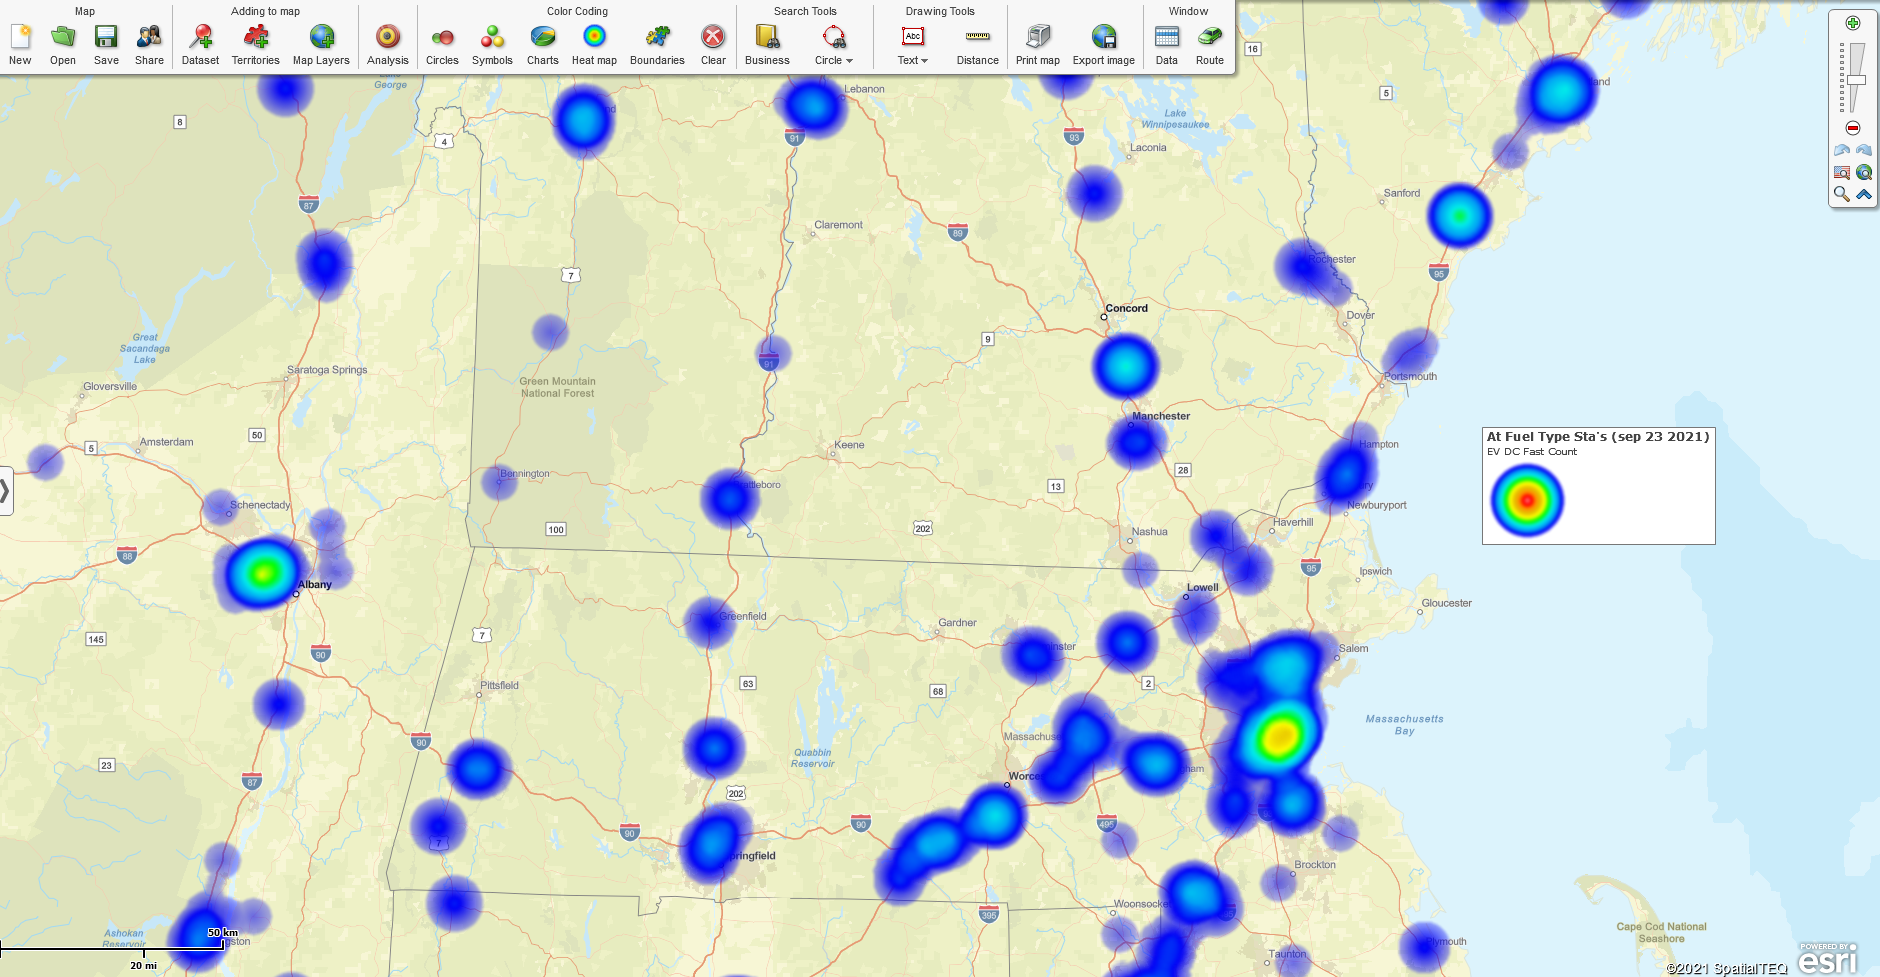
MapBusinessOnline heat mapping combines the clustering perspective of a dot density map with the numeric value intensity of an imported data column.  Choose the Heat Map button, select your data and your desired numeric value column within the data, and then adjust the color and intensity options as required. MapBusinessOnline makes it easy to reset the data visualization process and try different color and intensity schemes.

EV Charging Stations DC Fast Count Heat Map View

Charts and graph options are as available as data visualization tools. These Excel-like data depictions are best applied where multi-year data exists by location point. Year-over-year sales reports, or demographic trends over time, can be display for points on the map.

Whether your data is energy, retail, healthcare, or insurance-related, nearly all industries can benefit from the transformative process of visualizing your business data against a compelling map view.

_______________________________________________

Find out why over 25,000 business users log into www.MapBusinessOnline.com for their business mapping software and advanced sales territory mapping solution. The best replacement for Microsoft MapPoint happens to be the most affordable.

To access MapBusinessOnline, please register and then download the Map App from the website – https://www.mapbusinessonline.com/App-Download.aspx.

After installing the Map App, the MapBusinessOnline launch button will be in the Windows’ Start Menu or Mac Application folder. Find the MapBusinessOnline folder in the Start Menu scrollbar. Click the folder’s dropdown arrow and choose the MapBusinessOnline option.

The Map App includes the Map Viewer app for free non-subscriber map sharing.

Please read customer reviews or review us at Capterra, or g2crowd

Contact: Geoffrey Ives geoffives@spatialteq.com or Jason Henderson jhenderson@spatialteq.com

Posted in Business Mapping Software blog post, How to instruction | Tagged , , , | Leave a comment

Let’s Add a Territory Layer to a Business Map

A few weeks ago, we built a business map from scratch – see this blog.  This week I thought we might expand on that very same business map by adding a territory layer and sharing that sales territory map with our constituents.

The first thing a territory creator needs to do before they begin mapping is to decide which map alignment layer the territory maps will use.  Will the territories be based on a ZIP code, County, or State map alignment layer?

Territory Planning

The map editor could create multiple territories, each with a different map alignment layer. Still, she cannot make a single territory using more than one map alignment layer.

For example, in MapBusinessOnline, the map creator can create a state-based territory map.  But to split a territory between two partial states, or one whole state and one section of another state, would require basing that territory on the County or ZIP code map alignment layer.

That’s a hard and fast rule in MapBusinessOnline – One map alignment layer per territory.

Keeping that rule in mind, you should be able to quickly determine which map alignment layer is best for your territory map.

In my map of brewery locations, I believe the sales opportunity for a brewery supply company is local. Therefore, I would build my brewery territory map based on ZIP codes. If I had more multi-branch brewery locations, I might consider counties as a map alignment layer. But there aren’t many breweries with multiple outlets in northern New England.

ZIP codes it is then. ZIP codes are a popular choice for sales territory maps.

Territory Maps for a Brewery Supplier

Breweries need lot’s of stuff to make beer. Our brewery supply company will offer a one-stop-shop for standard brewer supplies, which could include:

  • Grain deliveries
  • Associated ingredients
  • Keg containers and pumps
  • Bottles and cans
  • Other supplies, as required

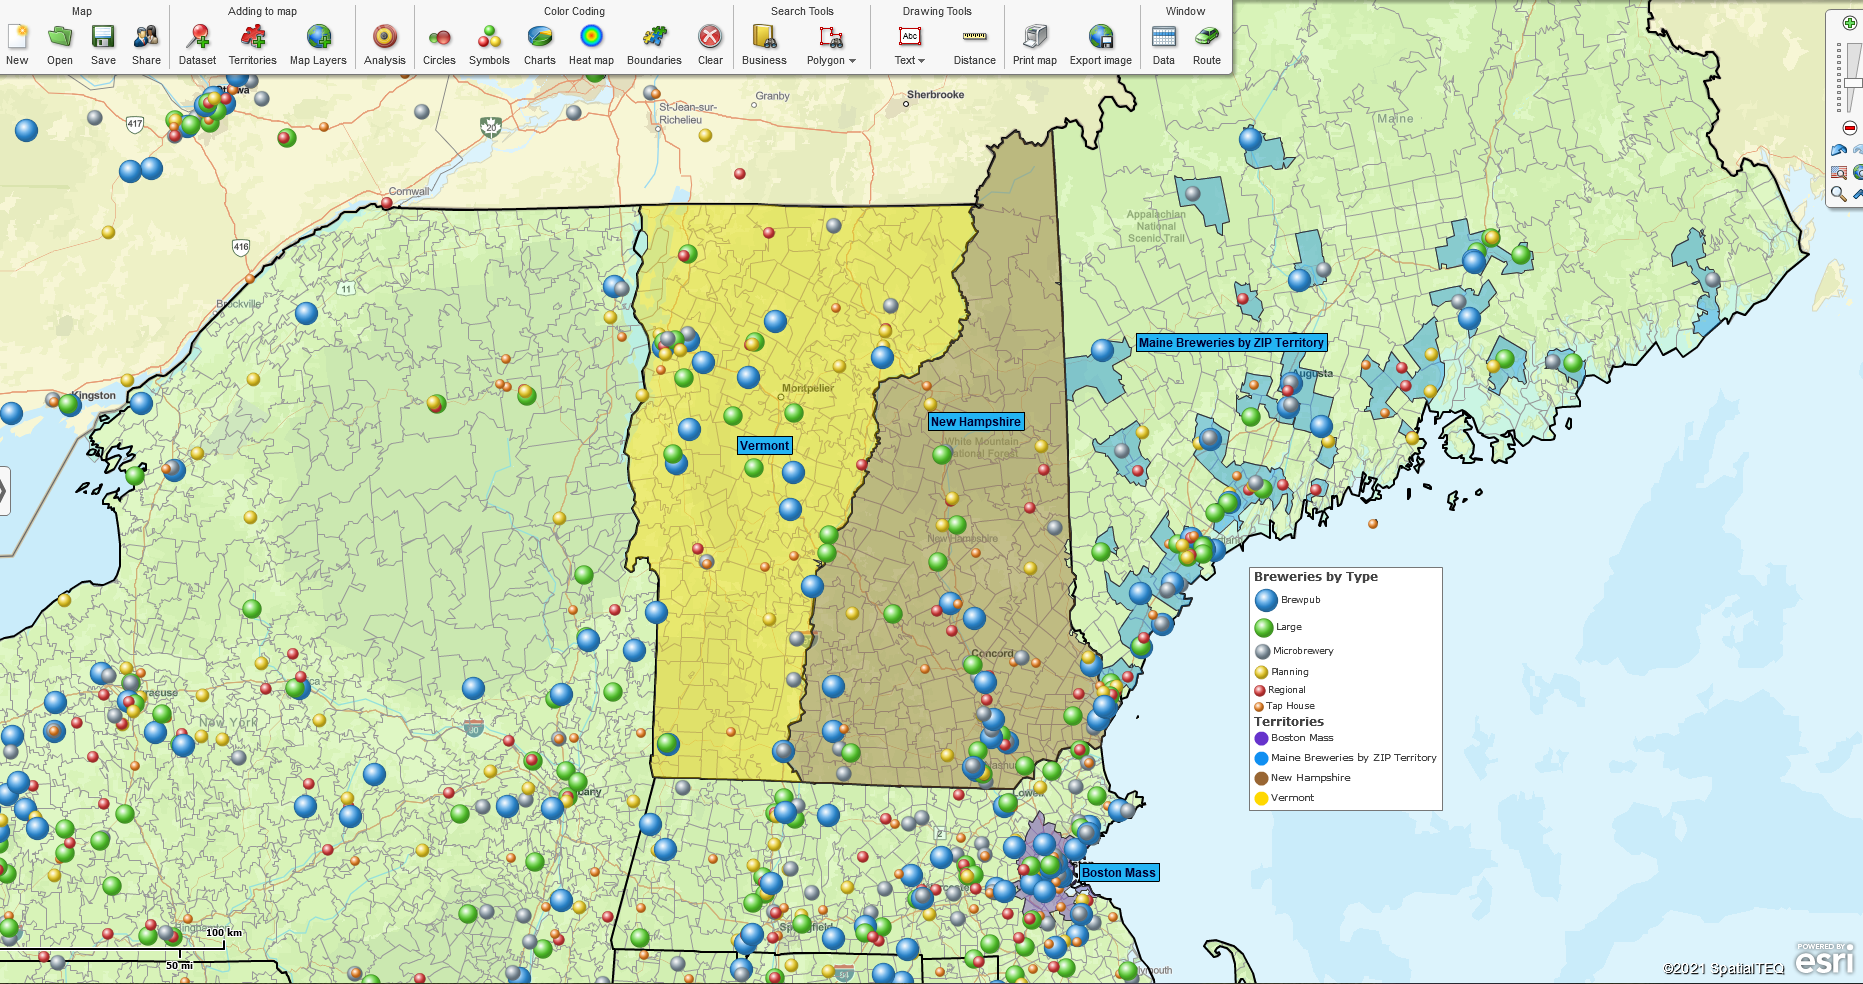
The overall northern New England region is our brewery supplier’s theater of operations. The company’s name is One-Stop Brewery Depot.  One-Stop has three salespeople on the road. The three territories are going to be named Maine Breweries by ZIP, New Hampshire, and Vermont.

But we’re also planning to hire a body for the Boston area to test the market. So we will also set up a trail territory there covering a list of specific ZIP codes.

Remember,  we have imported a USA breweries dataset that provides the brewery location points by latitude longitude, and all those records are geolocated correctly. But the address, city, and state columns had some issues. No matter. I cleaned up the columns on the states I required for my territories.  We’ll be using those brewery locations to help define our territories.

Territory Creation by Imported File or Polygon Search

One fast way to create territories is by importing a spreadsheet. It is easy to create a spreadsheet for territory import.  As noted above, the map alignment layer is ZIP codes. For ZIP code territory, creation by import MapBusinessOnline requires two columns: Territory Name and ZIP Codes.

Let’s create an import spreadsheet for the trial sales area of Breweries around Boston. It’s a simple spreadsheet that looks like this:

ZIP Code Territory Name
01966 Boston Mass
01234 Boston Mass
02155 Boston Mass
02128 Boston Mass
02136 Boston Mass
02131 Boston Mass

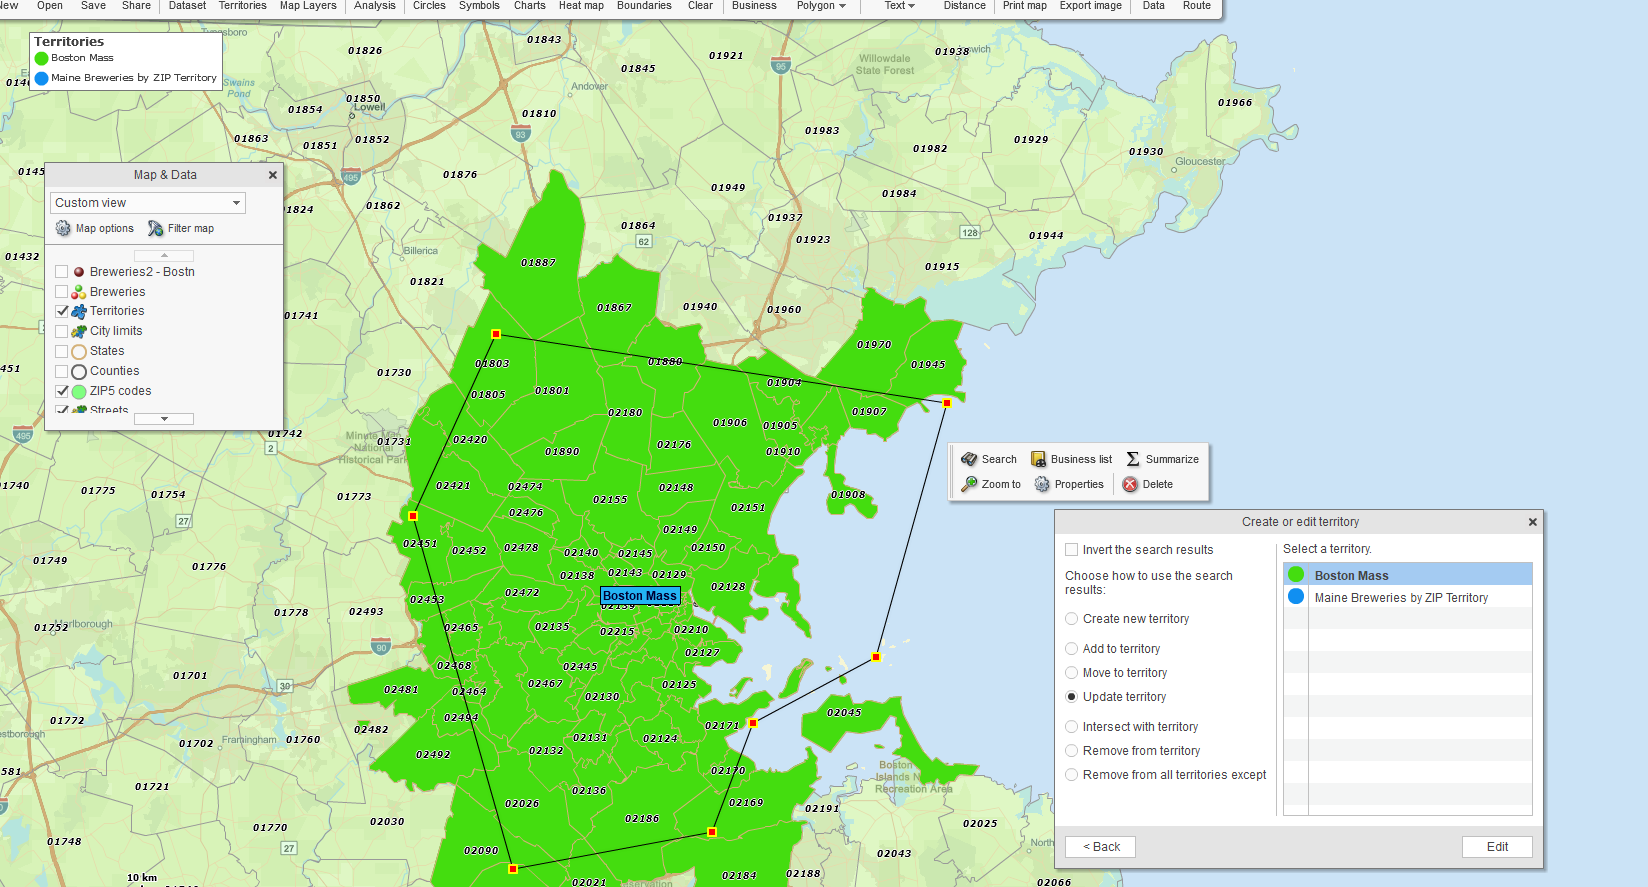
With my spreadsheet saved, I click the MapBusinessOnline Create Territories button and find and import my spreadsheet.  In a few seconds, my first Boston territory is on the map.  However, I would like to fill in more ZIP codes, so I selected the Polygon Tool from the Search Tool list.

  • Create a polygon around the Boston area,
  • Choose to search the ZIP code alignment layer
  • Select Update from the Territory Edit menu and add the list to the Boston territory

The Boston territory provides a reasonable territory starting point for a Boston trial. We can adjust it again later as necessary.

Boston Trial Territory Updated for Wider ZIP Code Inclusion

After any territory is made, it’s a good idea to review the territory for corrections and tweaks:

  • Did you a get all the ZIP codes applied as expected?
  • Are the territory colors satisfactory?
  • Will adjusting transparency improve the map?
  • Does the territory name read correctly?

Read more about creating sales territories.

I created our Maine territory by filtering ZIP codes.  In Mass, Vermont, and New Hampshire, the breweries are evenly distributed across each state. Territory management can be statewide or city-focused. So, New Hampshire and Vermont are easy polygon search tool/lasso operations. Those territories are both completed in just a matter of seconds.

  • I zoom into the Vermont and New Hampshire view.
  • I turn on the State layer, uncheck fill, and darken the state boundary, to give myself a guide for the polygon lasso.
  • Select the polygon search tool and run the polygon through all the ZIP codes around the Vermont border. Bring the line back to the beginning.
  • Save the territory name as Vermont.

Do the same process for New Hampshire.

But in Maine, there are vast swaths of northern counties with no breweries to visit.  It makes sense to create territories in Maine by filtering the ZIP code list based on brewery presence.

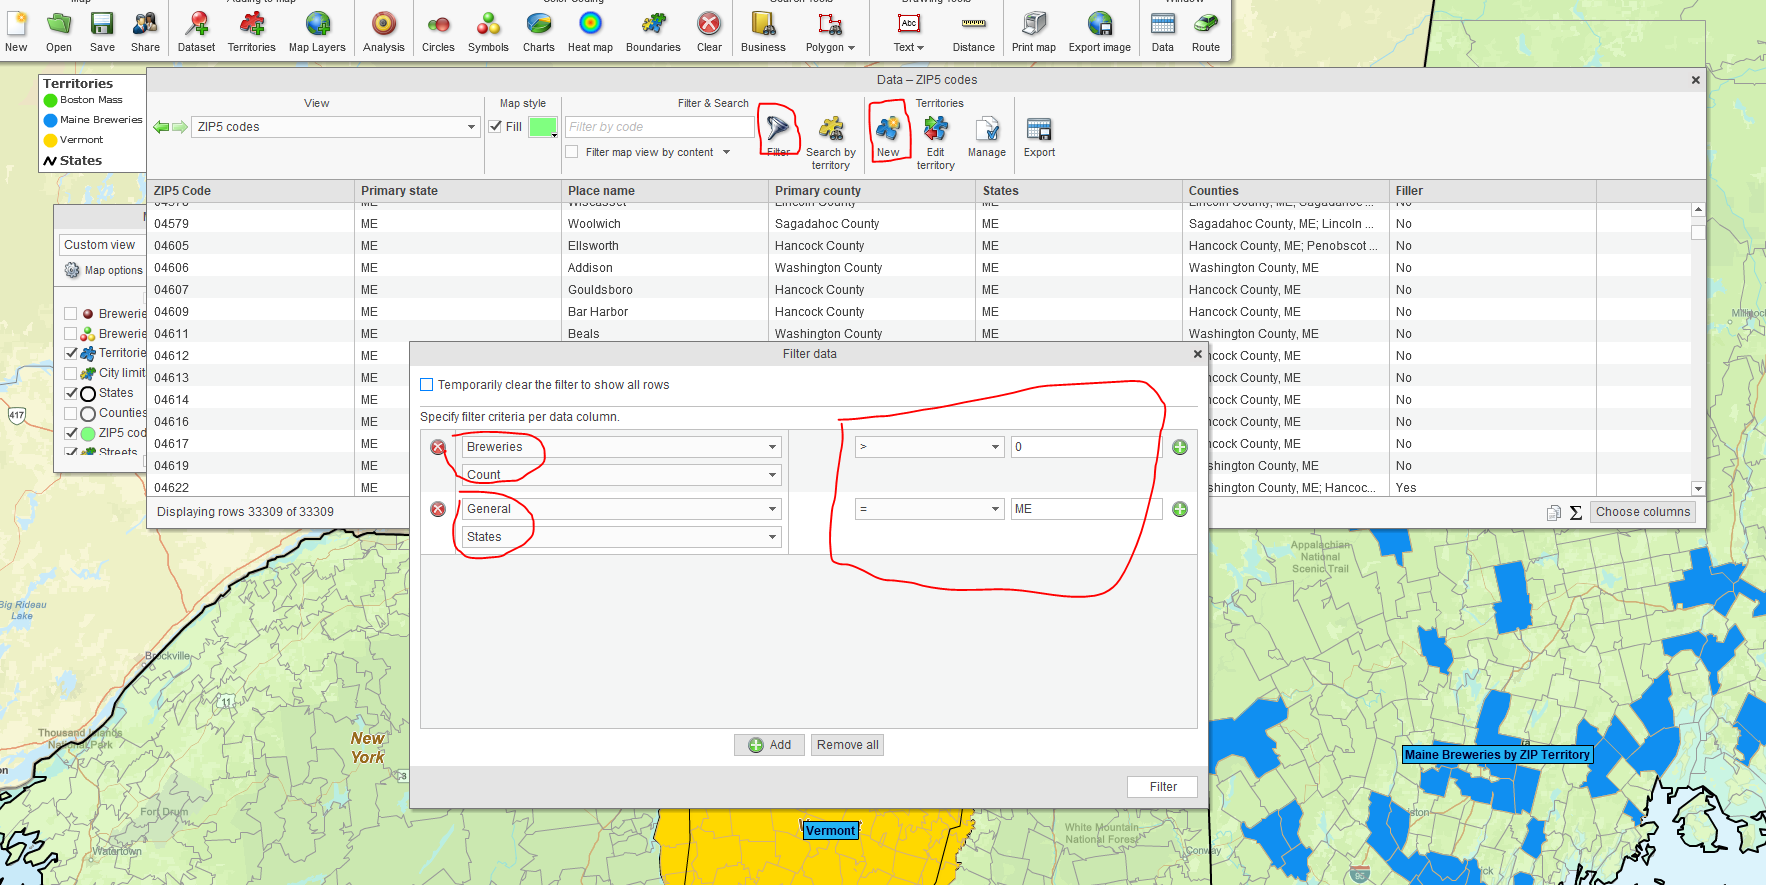
I use the MapBusinessOnline Data Window view to filter the ZIP codes of interest for my Maine territory:

  • Select the ZIP Code layer in the upper left Data Window dropdown.
  • Click the Filter button (funnel icon) on the Data Window toolbar.
  • In the first filter operation on the left, I select the imported Breweries data and leave the operation beneath it at Count. I choose’>’ in the right-side modifier, and put the number ‘0’ in the number field. The result will show me all the ZIP codes across the USA with more than zero breweries.
  • Next, to view only Maine, I add another filter and choose the General option. I filter under General, by State and in the Modifier section on the right, I select ‘=’ with modifier ‘ME.’
  • Now the Data Window shows all the Maine ZIP codes that contain Breweries. I can now click the New button under Territories on the Data Window toolbar to create and name a Maine Breweries Territory.

Use the Filter Button to Create a Set of ZIPs & Convert Them to a Territory

Northern NE Territory Maps for One-Stop Brewery Depot

Northern NE Territory Maps for One-Stop Brewery Depot

I now have four territories created for One-Stop Brewery Depot. One for each northern New England state, and a trial territory for Boston. One salesperson manages each territory.

This business example shows how MapBusinessOnline can provide flexible territory options for just about any business. Once the territory layers are added, and the map look and feel is optimized, a manager can publicly share their map with constituents using the Share Map button – four buttons in from the left along the master Toolbar.

Shared maps for view only purposes are Publicly shared maps, as opposed to Privately shared maps which are for MapBusinessOnline subscribers only.  Free map viewers must download the Map App first. Then they can click on a shared link and view the map we created.

Further Reading:

_______________________________________________

Find out why over 25,000 business users log into www.MapBusinessOnline.com for their business mapping software and advanced sales territory mapping solution. The best replacement for Microsoft MapPoint happens to be the most affordable.

To access MapBusinessOnline, please register and then download the Map App from the website – https://www.mapbusinessonline.com/App-Download.aspx.

After installing the Map App, the MapBusinessOnline launch button will be in the Windows’ Start Menu or Mac Application folder. Find the MapBusinessOnline folder in the Start Menu scrollbar. Click the folder’s dropdown arrow and choose the MapBusinessOnline option.

The Map App includes the Map Viewer app for free non-subscriber map sharing.

Please read customer reviews or review us at Capterra, or g2crowd

Contact: Geoffrey Ives geoffives@spatialteq.com or Jason Henderson jhenderson@spatialteq.com

Posted in How to instruction | Tagged , , , , , | Leave a comment

How to Export a Dataset of Cities Using MapBusinessOnline

Sometimes we take for granted an essential business mapping feature. A recent Chat request made this perfectly clear:

How do I export a list of cities within a circle or a polygon map object?

MapBusinessOnline provides online business mapping tools that make this data export operation easy to achieve. In fact, there are several easy ways to export a list of cities. MapBusinessOnline is an excellent tool for City Maps.

Export All Cities & Towns

The easiest way to export the complete list of cities is to add the City Limits layer to the map and export the list from the Data Window:

  1. Under Adding to Map on the Master Toolbar, click Map Layers.
  2. In the displayed list, select City Limits and then click Add to Map. (The Cities point layer is also available in Map Layers, but as a superficial point layer it is not helpful for data work.)
  3. You’ll now see the City Limits geographies displayed on the map. Open the Data Window on the far right of the Master Toolbar.
  4. In the Data Window selection data list dropdown in the upper left corner, drop down to the City Limits layer.
  5. With City Limits displayed in the Data Window, click the Export Button, the last button on the right on the Data Window toolbar.
  6. Save the file with a name and in a place you’ll remember. The data will open as a CSV file. CSV files can be opened from within Excel and saved as .XLS files.

As always with MapBusinessOnline map layers, you can add demographic data or imported data columns to the analysis view in the Data Window before export. Simply click the Choose Columns button in the lower right corner of the Data Window.

Read more about the Powerful Choose Columns button here.

Querying Cities with Circle or Polygon Map Objects in MapBusinessOnline

Conduct a Spatial Query & Export Results

‘Conduct a Spatial Query’ sounds intimidating, but it’s pretty easy. It’s nothing like holding a séance to speak with Uncle Bob from beyond the grave. Nothing like that.

A spatial query is simply a search for data within a defined space or map object.  Use the Search Tools to determine the Circle, Polygon, or Drive Time Polygon and then search the area for data.

  1. Create a map object using the MapBusinessOnline Search Tools’ right side option, towards the middle of the Master Toolbar. Click the dropdown and choose the Circle or Radius search option. Read more about Radius Searches here.
  2. With your search tool selected, drop a point and drag your cursor on the map to establish a circle location and size.
  3. Select the map layer (or data layer) to search for records.
  4. Now the query result will display in the Data Window. Name the query result.
  5. Export using the Export Button on the far right of the Data Window Toolbar. The data will open as a CSV file.

Or Just Query & Export the ZIP Code Map Layer

Another option, which can come in handy when working with ZIP codes, is to export a ZIP code map layer file or the map object’s ZIP code query results.

MapBusinessOnline includes a column called Place names in the ZIP code map layer. Place names are, simply put, a city or a town. If you export a list of ZIP codes from the data window, the Place names column comes along for the ride.

Working with ZIP code map layers in this fashion could be a convenient way to conduct several map-based operations:

  • Creating Sales Territories and territory planning based on ZIP Code Demographic Analysis.  Use Choose Columns in the lower right to add demographic data columns to your analysis.
  • Market Analysis – Again, use the Choose Columns button to add demographic data, business listings data, or imported data to your Data Window analysis views. Cities are particularly helpful for uncovering new markets in other sections of the nation.
  • Expansion Planning – Both ZIP code and City demographic analysis can expose new markets for expanding businesses.
  • Searching for Business Listings by City boundaries for competing businesses and sales estimates.

The Bottom Line: city data is helpful. MapBusinessOnline makes it easy for you to query, use, and export the City Map Layer data in various ways.

_______________________________________________

Find out why over 25,000 business users log into www.MapBusinessOnline.com for their business mapping software and advanced sales territory mapping solution. The best replacement for Microsoft MapPoint happens to be the most affordable.

To access MapBusinessOnline, please register and then download the Map App from the website – https://www.mapbusinessonline.com/App-Download.aspx.

After installing the Map App, the MapBusinessOnline launch button will be in the Windows’ Start Menu or Mac Application folder. Find the MapBusinessOnline folder in the Start Menu scrollbar. Click the folder’s dropdown arrow and choose the MapBusinessOnline option.

The Map App includes the Map Viewer app for free non-subscriber map sharing.

Please read customer reviews or review us at Capterra, or g2crowd

Contact: Geoffrey Ives geoffives@spatialteq.com or Jason Henderson jhenderson@spatialteq.com

Posted in Business Mapping Software blog post, How to instruction | Tagged , , , , | Leave a comment