Let’s Create a Business Map from Scratch

Let’s build a business map from scratch, using MapBusinessOnline.

It would be a good idea for you, the potential business map creator, to have at the ready a location dataset(s) of any relevant business operations you’d like plotted on your map.

For my map example, I’m creating a business map that shows beer breweries across New England. I sourced my data from the POI Factory, a cool little website with downloadable location data. You’re welcome.

Most map creators will begin with a specific business purpose in mind. They intend is that their business map visualization will suggest solutions to problems or suggest answers to questions that have been unanswerable through other business processes. Geographic views provide new perspectives that expose trends and offer new areas for business activities.

Select a Background Map

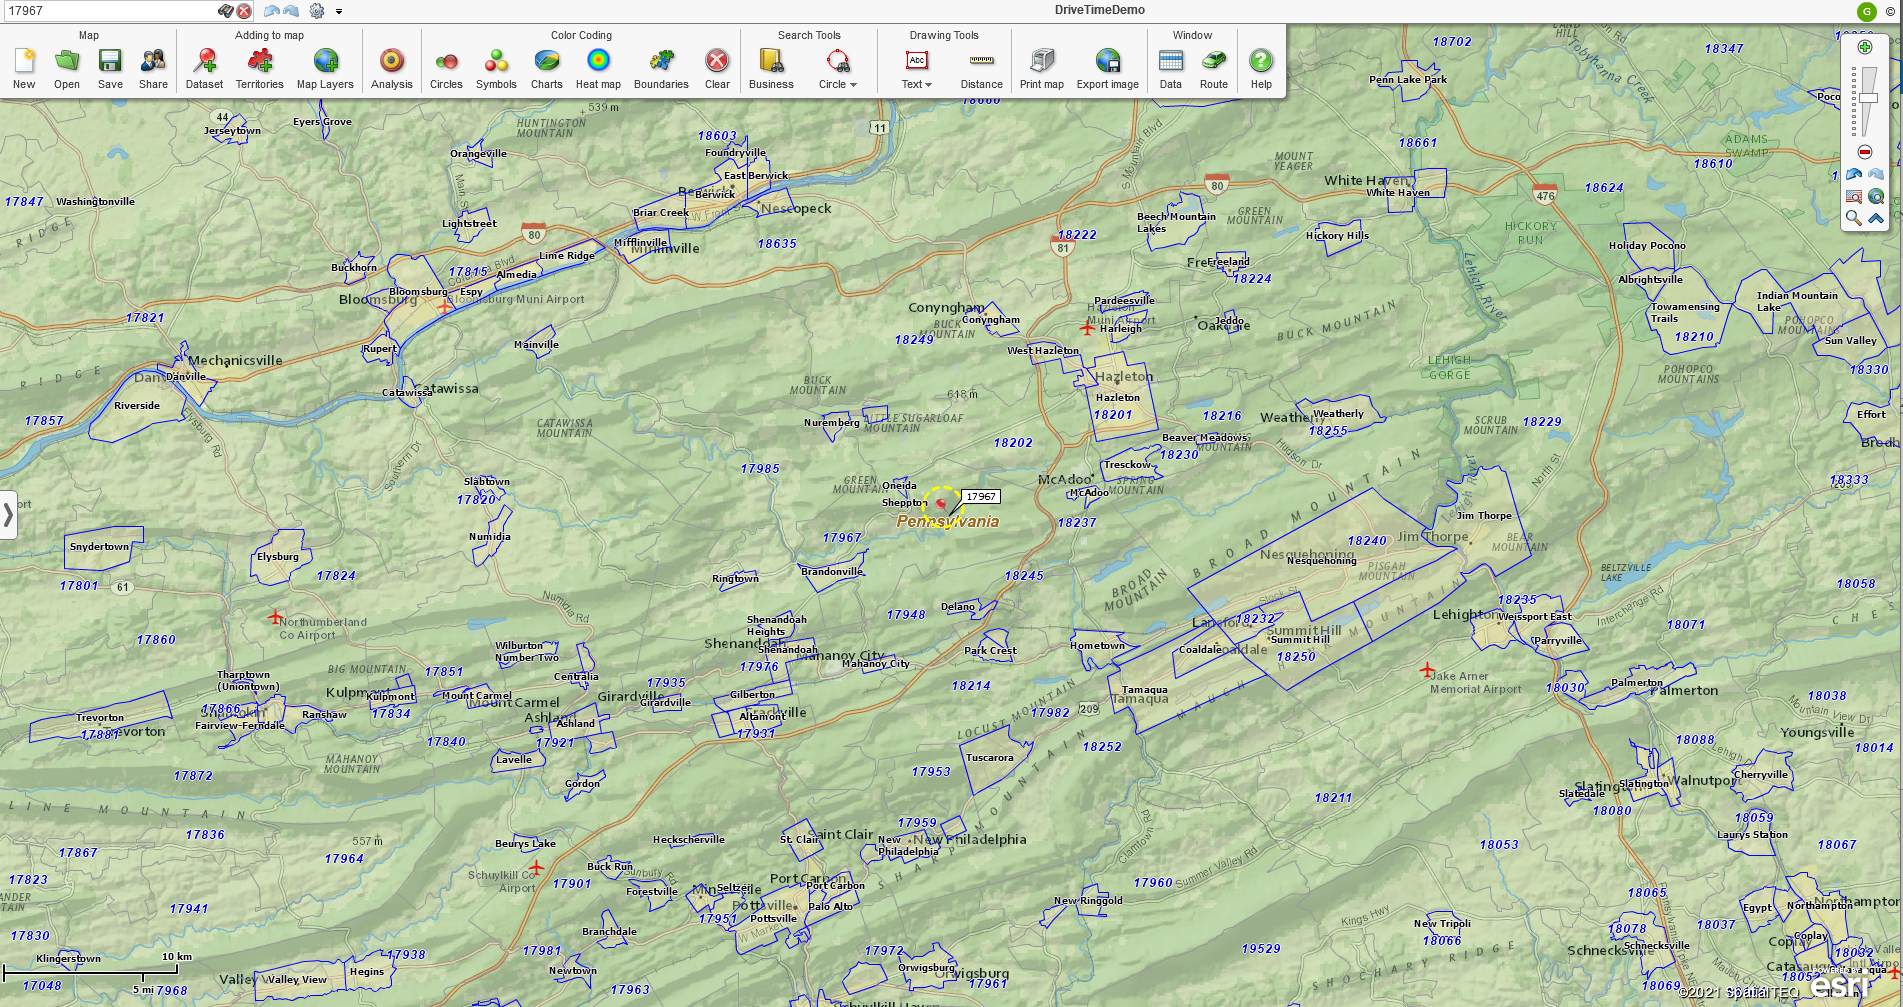
Once you’ve opened MapBusinessOnline, with the initial map view on your screen, consider the background map you’d like to include with your map. Choose a map background layer in Map and Data – the grayish box of layers hovering over the map.  If Map and Data is missing, you’ll see a gray ‘>‘ or arrow smack dab in the middle of the far-left panel of your map.  Read more about Map and Data.

You can select a background map at any time, but I like to pick one in advance. A fresh background map helps the geographic juices start to flow. So wear a geo-bib.

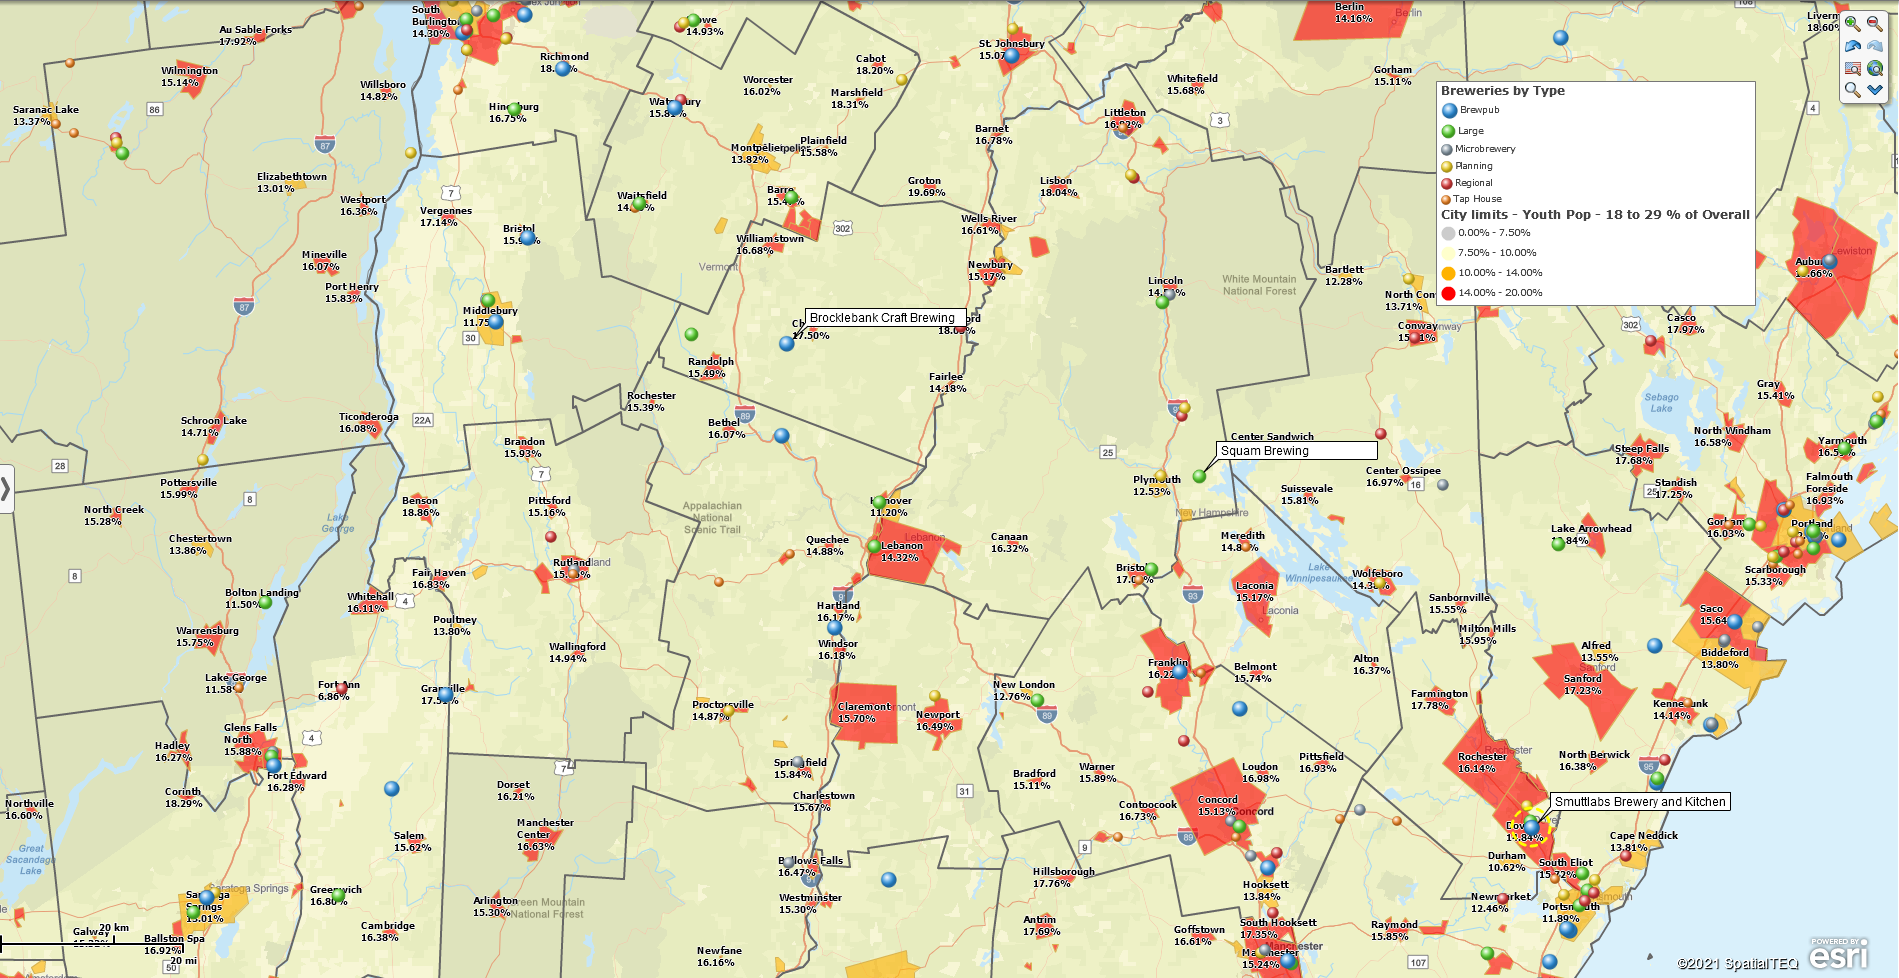
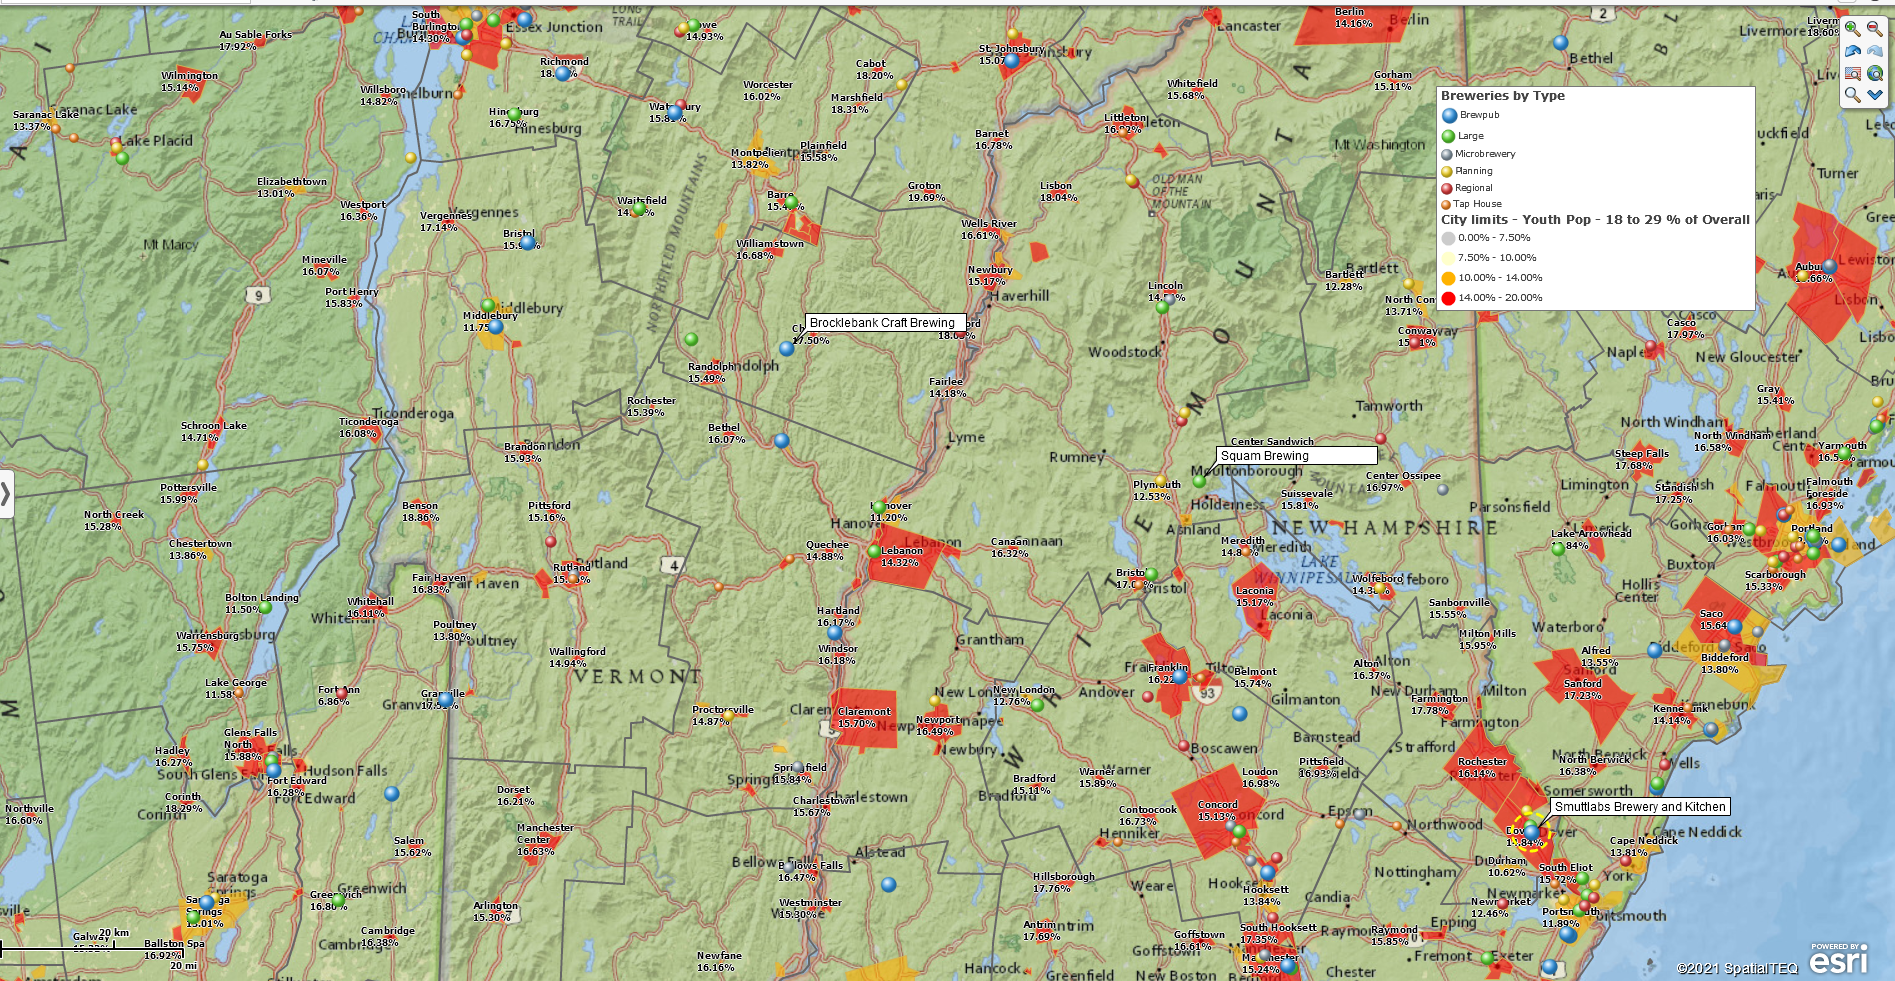
Streets is the default background map.  I am partial to the National Geographic background map, which includes some interesting topography and is predominately green in color. The National Geographic background includes nicely defined state boundaries and names that do not conflict with the overall map purpose. Below are several background map examples:

Breweries Map – Streets Background


Breweries Map – National Geographic Background


You always have the option to select no background map at all. No background is a good option for demographic maps that do not require map orientation for the map viewer.  For my map, a map of breweries, I thought topography might come in handy. Never mind why.

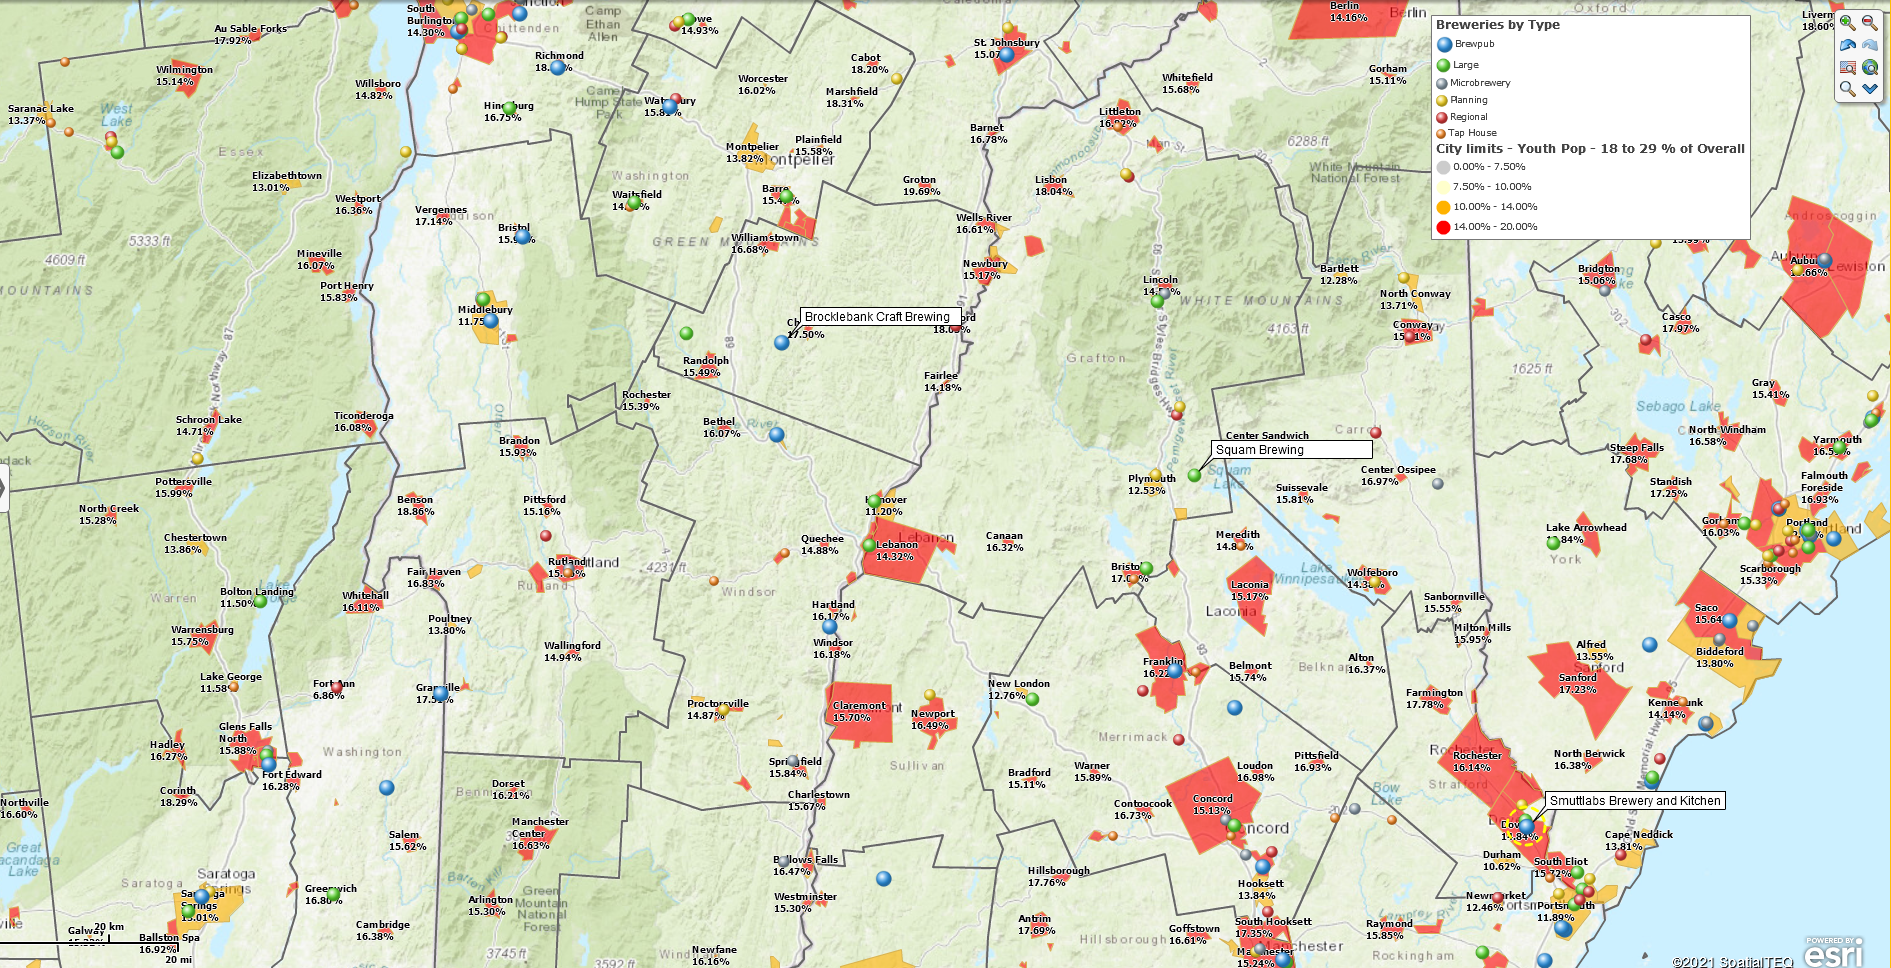
I settled on the MapBusinessOnline Topographic map background, another option in Map and Data:

Topographic – Map Background

And don’t get locked into one view or another. Every map creation is different.  You can always tweak the various aspects of the map as your map nears completion.

Map Layer Selection

As a long-time business mapper, I generally have a pretty good idea of what map layers I will turn on for any business maps I create. You, as a new users of business mapping software, may want to give map layer selection some trial and error time.

Map layer control is in the Map and Data Box. It’s a checklist of map layers.  You’ll see ZIP code, County, and State layers listed, as well as the background layer discussed above.

Additional map layers are available at the click of a mouse in the Layers button under the Add to Map section of the master toolbar.  Add some map layers to the map view.  Click them on and off. Get a feel for what works and what doesn’t work.

Import and Symbolize Your Location Data

MapBusinessOnline makes it as easy as possible to import location data.  Still, importing data is a process:

  • Click the Datasets Button
  • Navigate to the data file location
  • Select the data
  • Process the import through the MapBusinessOnline import template

Follow the ‘bouncing ball’ and get your data placed on the map. Insiders call this process geo-coding. Read more about dataset imports.

Once your data is on the map, you can color-code and symbolize the map points based on columns included in the data.  I looked for more detailed brewery data, but the data I found for free had limited business data. So, I added a fake Type column to the data and color-coded the imported breweries based on that column of data.  I added classifications for the following types:

  • Tap House
  • Large
  • Regional
  • Brewpub
  • Microbrewery
  • Planning

In the biz, that’s what call classifying the data. There are lots of ways to classify data. You could classify businesses by sales values, or the number of employees. You could color-code your data based on a count per county or ZIP code. Read more about counts in MapBusinessOnline here. Decisions on color-coding imported data are based on how much value the process will add to your map. Please don’t do it for fancy colors, do it for improved map or business issue comprehension.

I wanted to visualize the data for the number of gallons of IPA sold, for example. That would have been a neat number to visualize, especially as a heat map. Unfortunately, the beer industry keeps those numbers close to the vest. Read more about Heat Maps here.

Adding Demographic Data

For my business map, I decided to add a demographic layer. I thought a city limits map layer color-coded by population might say something. It occurred that breweries placed in cities with a high percentage of 18- to 29-year-olds might do better.  So, my map now reflects that demographic.

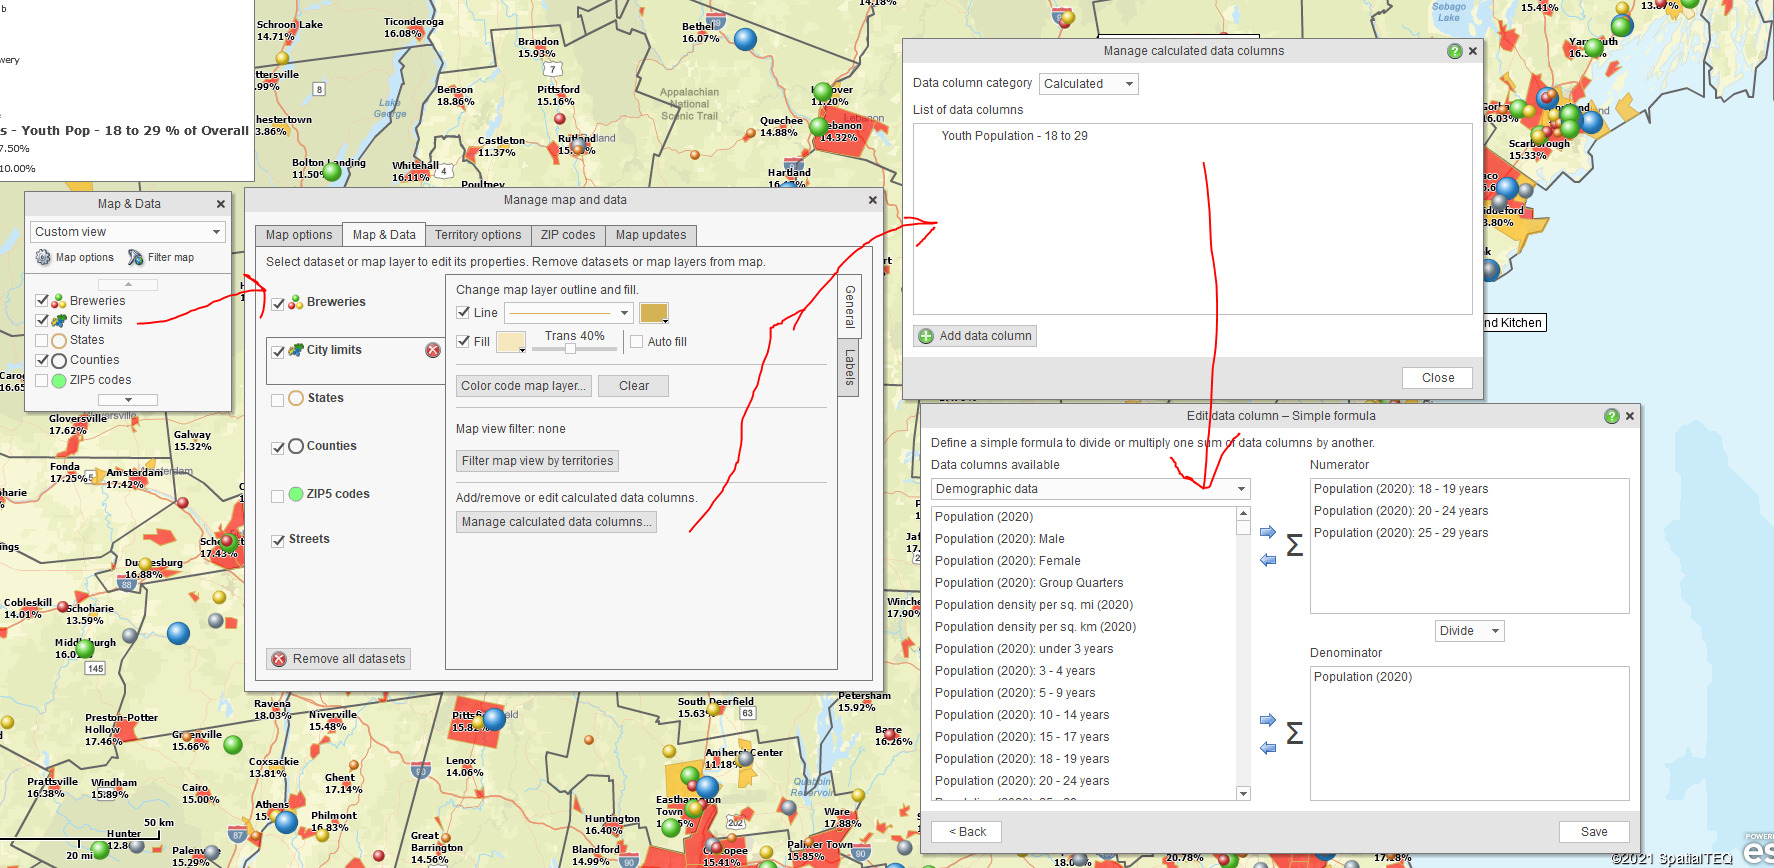
I constructed that layer using the Calculated Data Columns function in the City Limits map layer. Calculated Data Columns are available with every map layer through the Map and Data box.  If you want to combine like data columns in a formula (sum, multiply, divide), you must set up Calculated Data Columns for the layer your targeting. Each map layer requires its only columns calculation.

In my case, I set up a new Calculation in the City Limits layer. I summed the three demographic age segments that comprise 18 to 29 year-olds in the numerator and divided them by the total population in the denominator.  I then chose Percentage as the operation for display.  You should also check your decimal point setting to keep things clean on the map view.

Next, I accessed the Calculated Data Column result from the Color-code by Boundary option under the Color Code Map section of the master toolbar. Just click the Boundary button and walk through the options. The Boundary button let me color-code the City Limits layer and describe the percentage of the population in the Map Legend. Read more about color-coding map layers here.


Calculated Data Column

Read more about Calculated Data Columns here.

Wrap It Up

With my map completed, I review the result and tweak as necessary.  Consider these critical business mapping concerns when completing and fine-tuning your map:

  • Is the map’s purpose achieved?
  • Is the map clear and concise to the map viewer?
  • Are colors and symbols easy on the eyes and not overwhelming to view?
  • Is the map background appropriate?
  • Did you double-check spelling and grammar on any text presentation?

Keep your business map focused and uncluttered. These suggestions apply to all business mapping, from ZIP code maps to sales territory mapping. Make it easy on the eyes of your map audience and, you will be asked to build more maps. Hey, it beats ordering office supplies.

_______________________________________________

Find out why over 25,000 business users log into www.MapBusinessOnline.com for their business mapping software and advanced sales territory mapping solution. The best replacement for Microsoft MapPoint happens to be the most affordable.

To access MapBusinessOnline, please register and then download the Map App from the website – https://www.mapbusinessonline.com/App-Download.aspx.

After installing the Map App, the MapBusinessOnline launch button will be in the Windows’ Start Menu or Mac Application folder. Find the MapBusinessOnline folder in the Start Menu scrollbar. Click the folder’s dropdown arrow and choose the MapBusinessOnline option.

The Map App includes the Map Viewer app for free non-subscriber map sharing.

Please read customer reviews or review us at Capterra, or g2crowd

Contact: Geoffrey Ives geoffives@spatialteq.com or Jason Henderson jhenderson@spatialteq.com


Posted in Business Mapping Software blog post, How to instruction | Tagged , , , | Leave a comment

14 Business Maps & More from MapBusinessOnline

MapBusinessOnline provides business mapping tools for map creation. What type of map you create is up to you – the MapBusinessOnline user. Listed below are examples of common map types.

Dot Density Maps

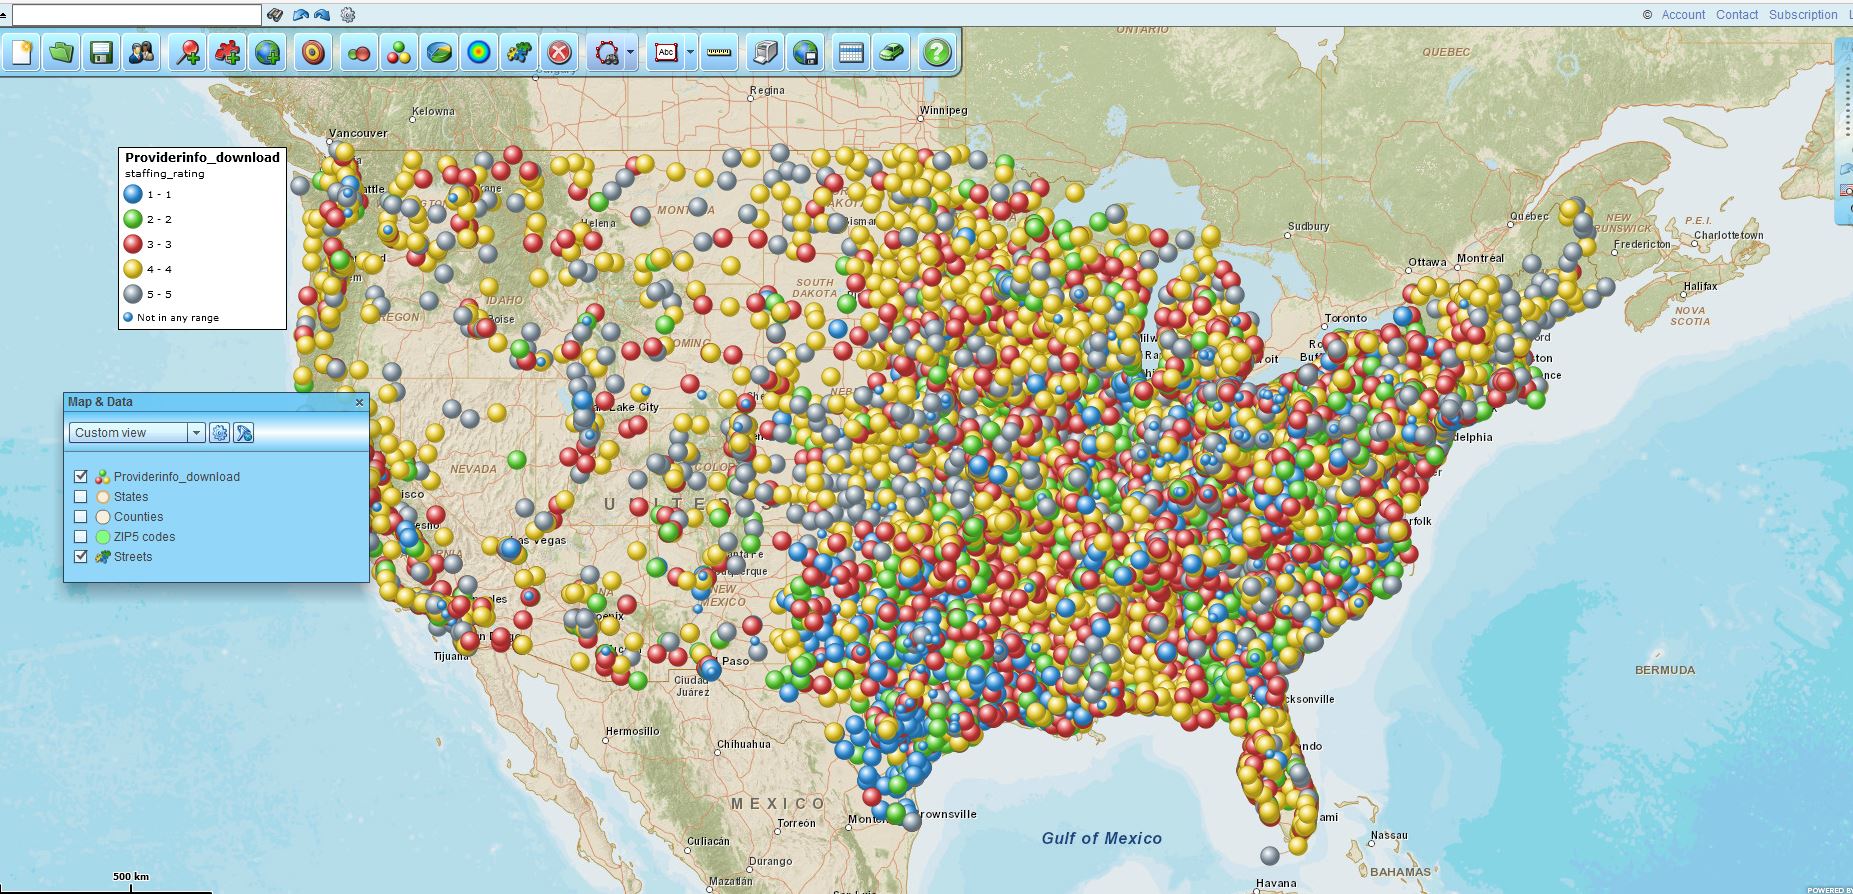
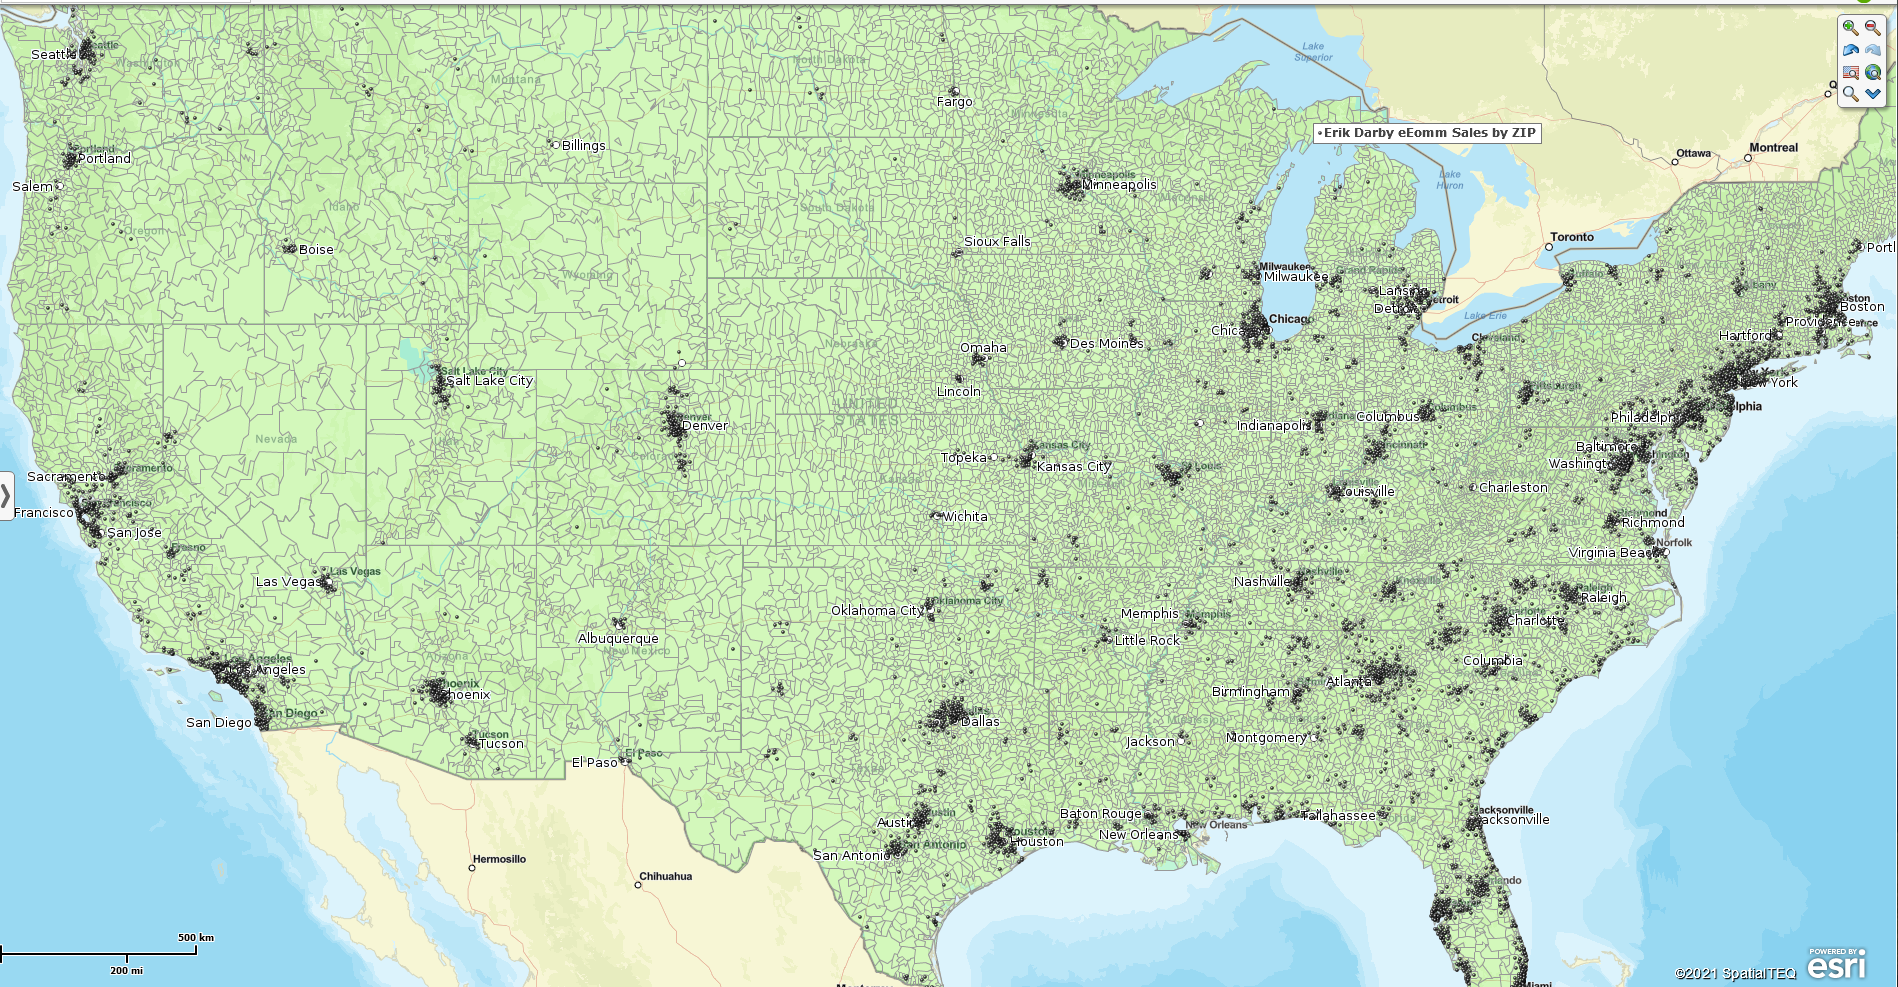
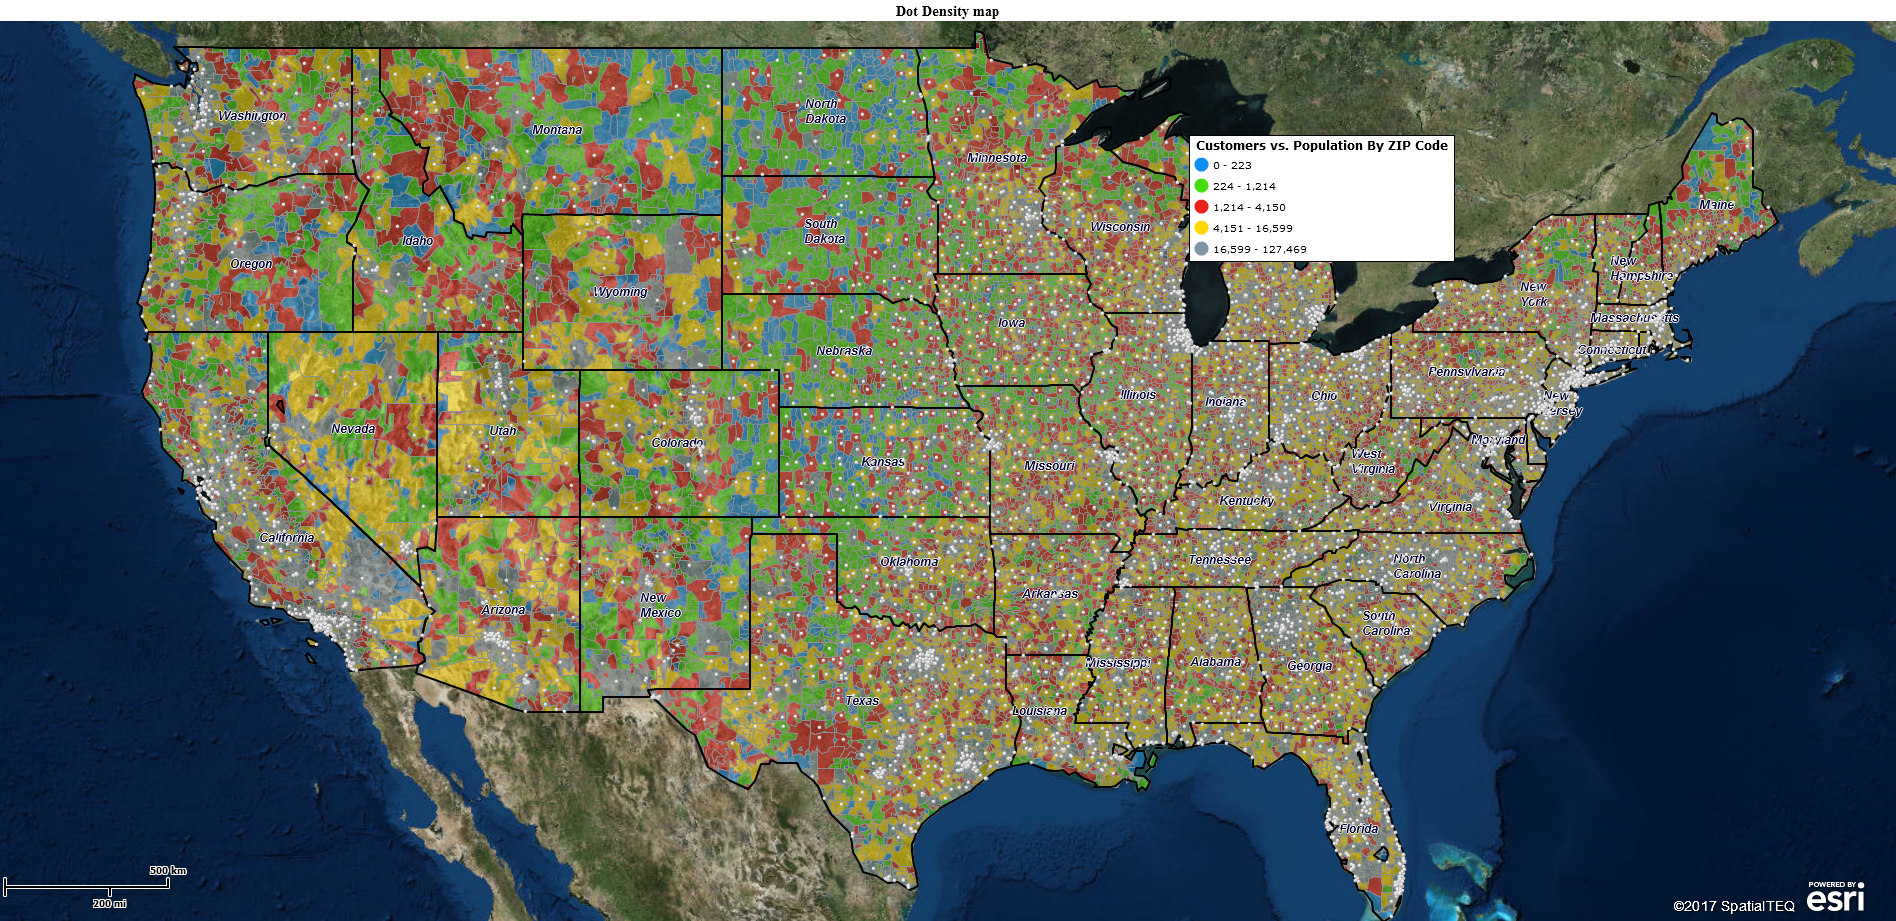
Dot density maps display geolocated address points as small dots on the map.  Imported data with more than 1,000 records tend to cluster in urban pockets. Dot density maps show where clusters of activity occur in your theater of operation. These maps are great for customer analysis, demographic analysis, and, of course, pandemic analysis.

Dot Density Map Over Standard Streets view.

A Dot Density Map Over Satellite Imagery


Dot density maps are a great way to view business activity at a glance.  But don’t confuse dot density activity maps with Family Circus maps:

Customer Maps

Customer maps show where all customers or all customers of specific types, are located. MapBusinessOnline provides label flexibility, including the ability to color-code by type. Labels can also include important data about each customer – sales, contact info, birthdays. Because virtually every business has customers, customer maps are trendy business maps today.

Back in the early 17th century, it took Magellan years to get a map of his exploration business. But today’s digital customer maps are generated every day in a matter of minutes, and they are much more accurate. Very rarely do today’s explorers get lost on the Pacific Ocean and end up decapitated. It happens, but it’s rare.

Radius Maps

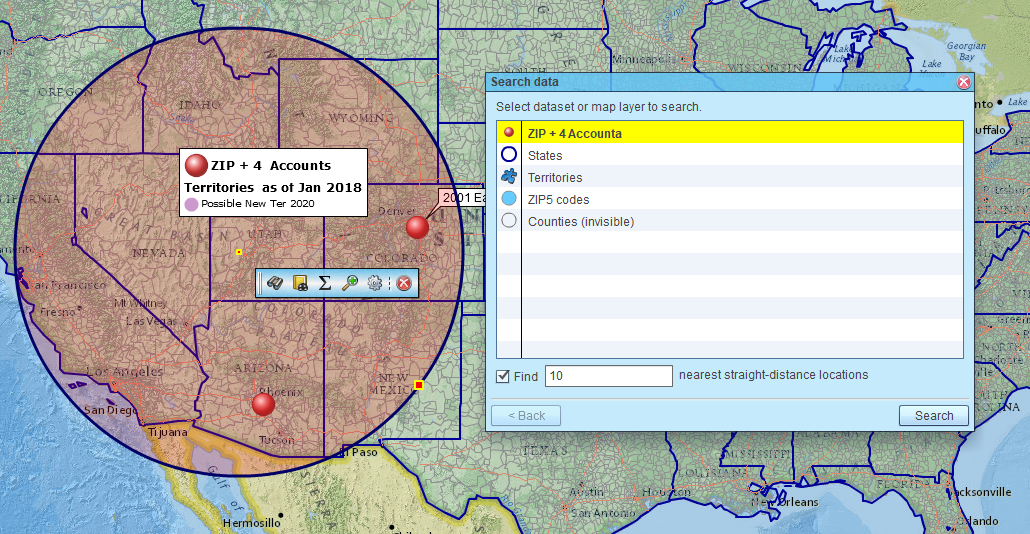
Radius maps are maps based on a circle. They call them radius maps because a circle shape on a map is constructed from the radius distance of the resultant map object. Click the Radius or Circle option and input the desired radius. Et voila! A circle appears on the map.

A Radius Map in Process in MapBusinessOnline

Once a circle is placed on the map, lots of information can be associated with that shape:

  • A map user can develop lists of customers within or outside of the circle.
  • Demographic data can be associated with the circle area.
  • Imported business data can be related to the circle. Data such as annual sales, energy consumed, or products sold.
  • The number of COVID-19 cases within the circle.
  • The number of vaccinated citizens within the circle. (Did I say that out loud? Heaven forbid.)

Concentric Circle Maps

Speaking of circles, MapBusinessOnline Standard and Pro versions both enable the creation of concentric circle maps.  Concentric circles are multiple circles of varying radii generated from the same center point. MapBusinessOnline Pro lets you create them a little more automatically, and it allows you to assign demographic data to the various circle areas as constructed.

Circles within Circles Constitute Concentric Circle Maps

Select the Summarize Demographic Data option in the MapBusinessOnline Pro set of market analysis options. Read the details on concentric circle demographic data mapping here.

Territory Mapping

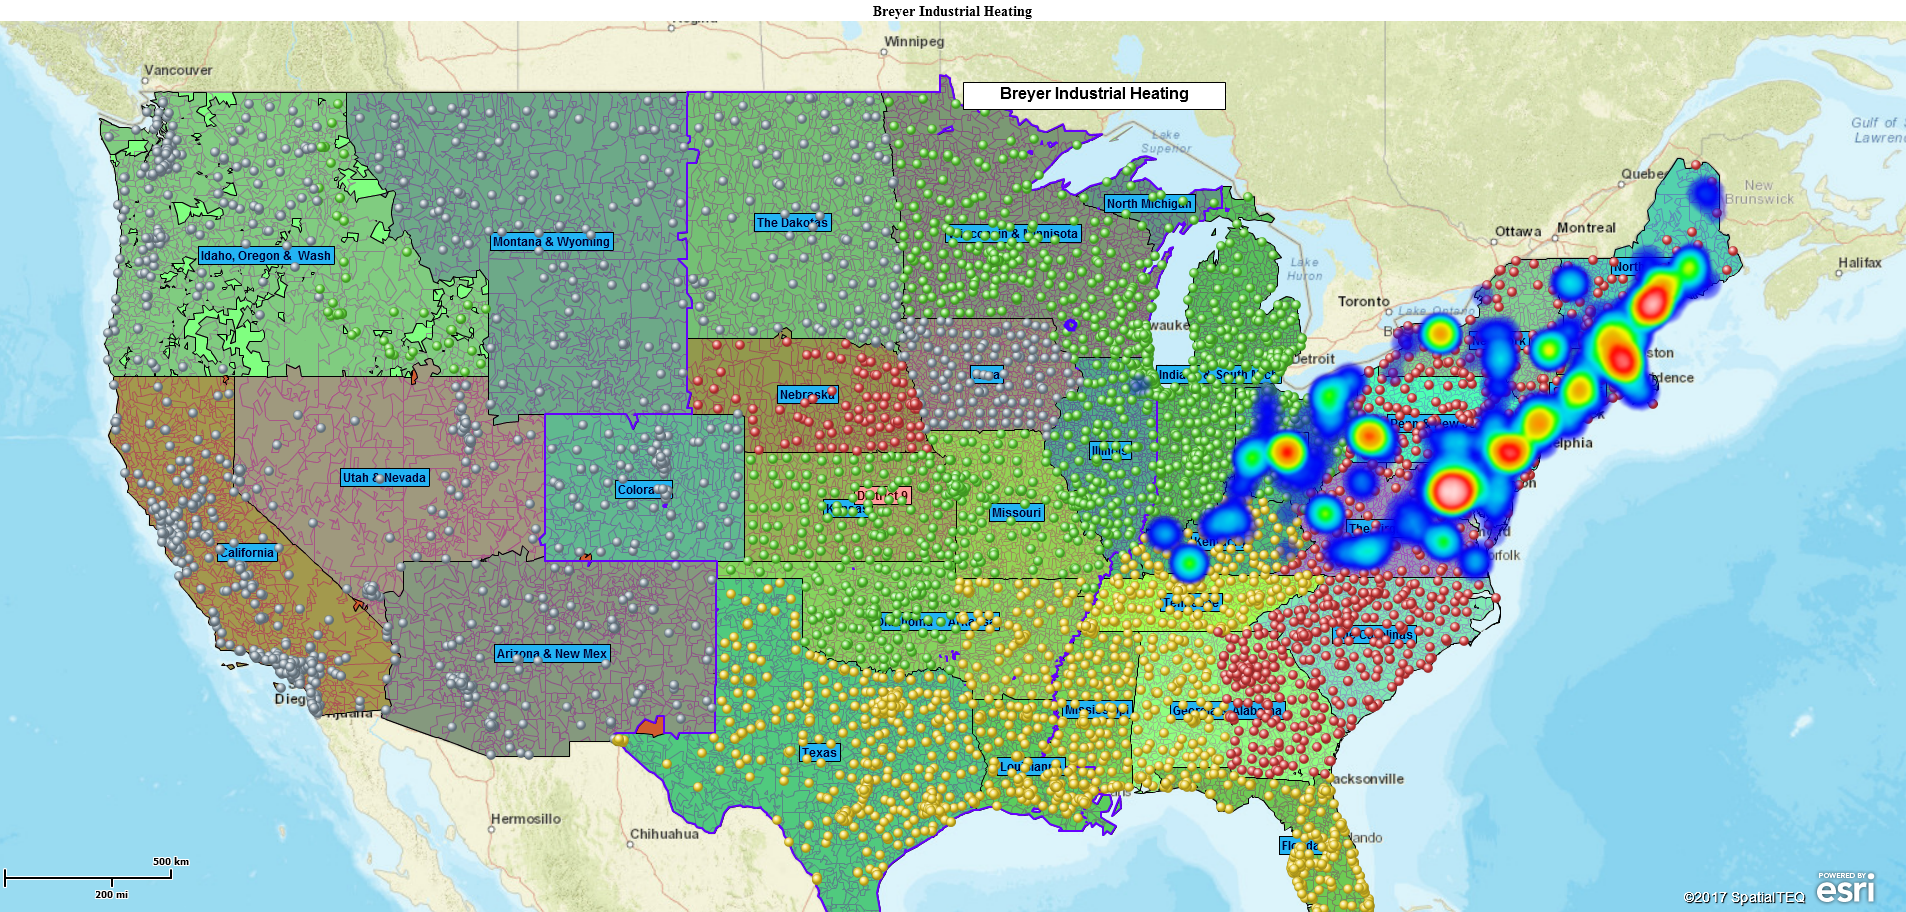
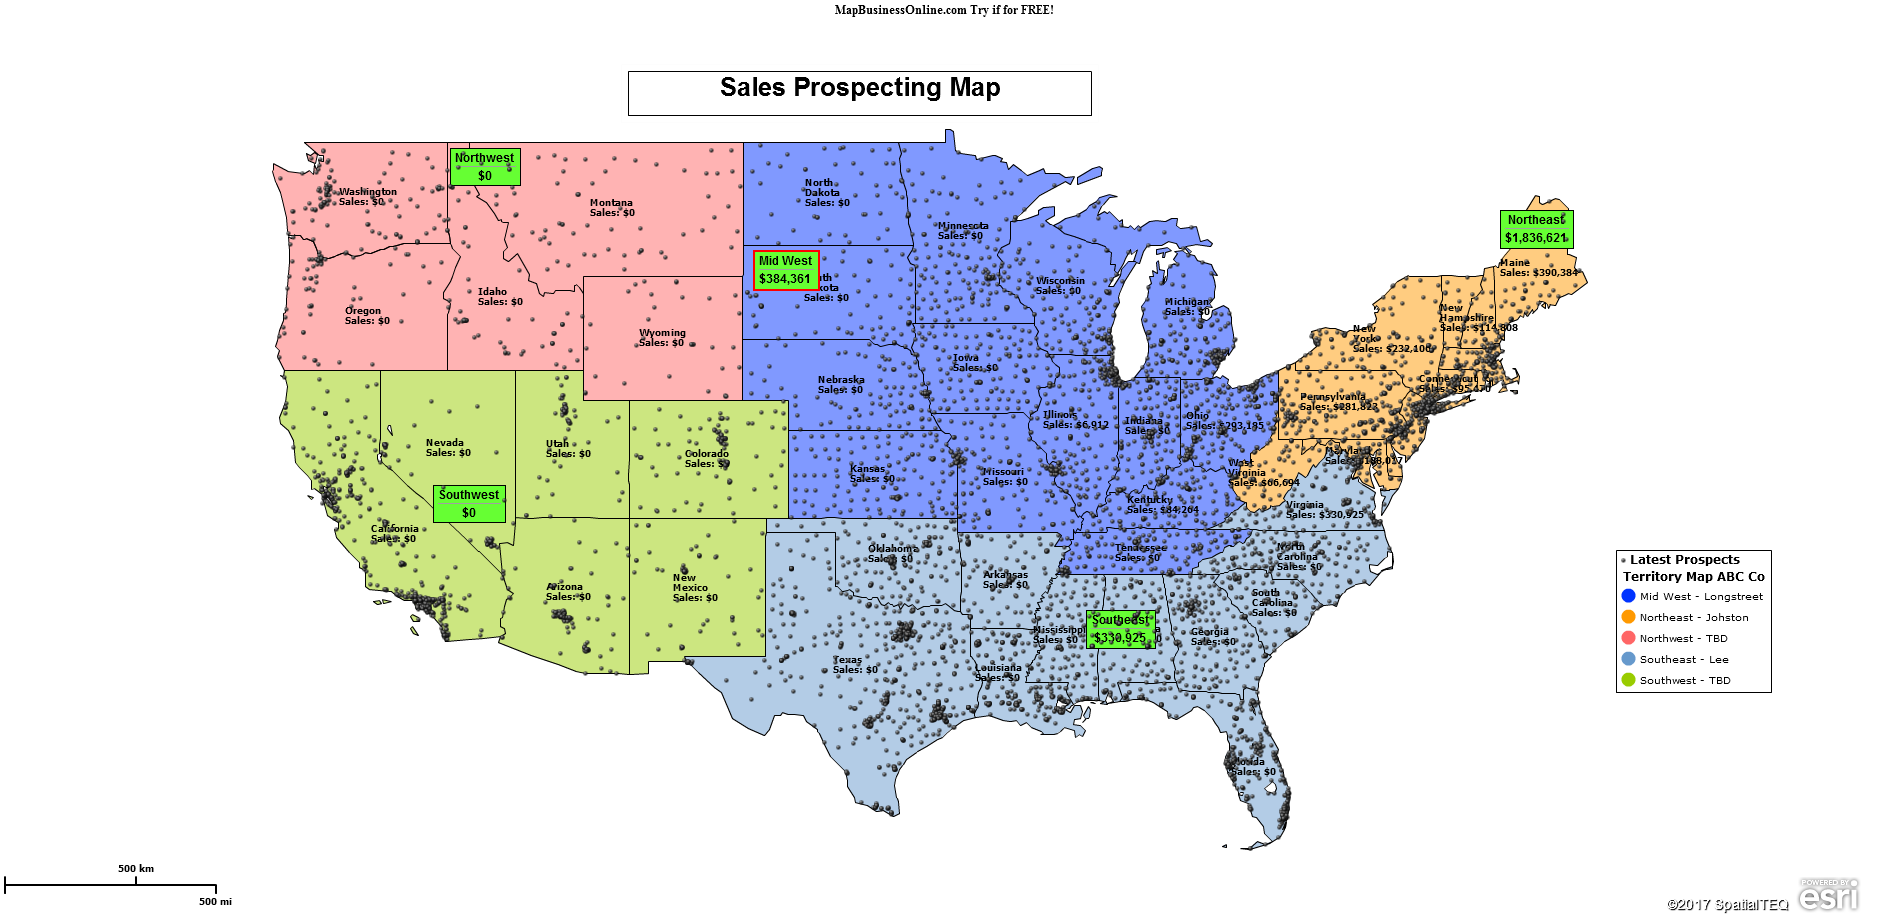
I write about territory mapping all the time. MapBusinessOnline does provide easy-to-use territory and sales territory map solutions. Of course, there are many different takes on territory maps.

The most common territory map is a sales territory map. But even a sales territory map comes in different flavors:

  • Field sales map – Field Sales maps include all sales rep home locations and territories, customers, and possibly prospect accounts and resource locations. Field inspectors, technicians, and clinicians would all use the same map formation. Read more about why businesses choose MapBusinessOnline for sales territory mapping.
  • Sales planning map – Usually used by a field sales rep to route to customer locations and manage customer visits. Territories provide guidelines for areas of responsibility.
  • Franchise business map – Franchise territory maps often present open and sold territories. Usually, franchise maps are based on ZIP codes, but other map alignment layers could be applied. Demographic analysis is often used to justify markets in franchise business territory maps.
  • Regional sales territory map – Sales teams view their sales territories, rep home locations, and customers within a specified region of activity but not the whole nation.
  • National sales territory map – Same as above but at a national level. National sales territory maps encompass the whole USA. National territory maps can get quite complex. Their complexity is related to the number of sales reps, the products and services offered, and the various ways the business goes to market.
  • Hierarchical sales territory map – Hierarchies define levels of sales responsibility usually associated with tiers of sales management. Sales hierarchies often support three levels of territory management – ZIP code layer territories, regional territories, and territory divisions. Hierarchical territory maps are supported by MapBusinessOnline Pro.

Sales & Marketing Maps

In addition to field maps and territory maps, sales and marketing professionals require business maps that inform them about market potential, competitor activity, and forecasting.

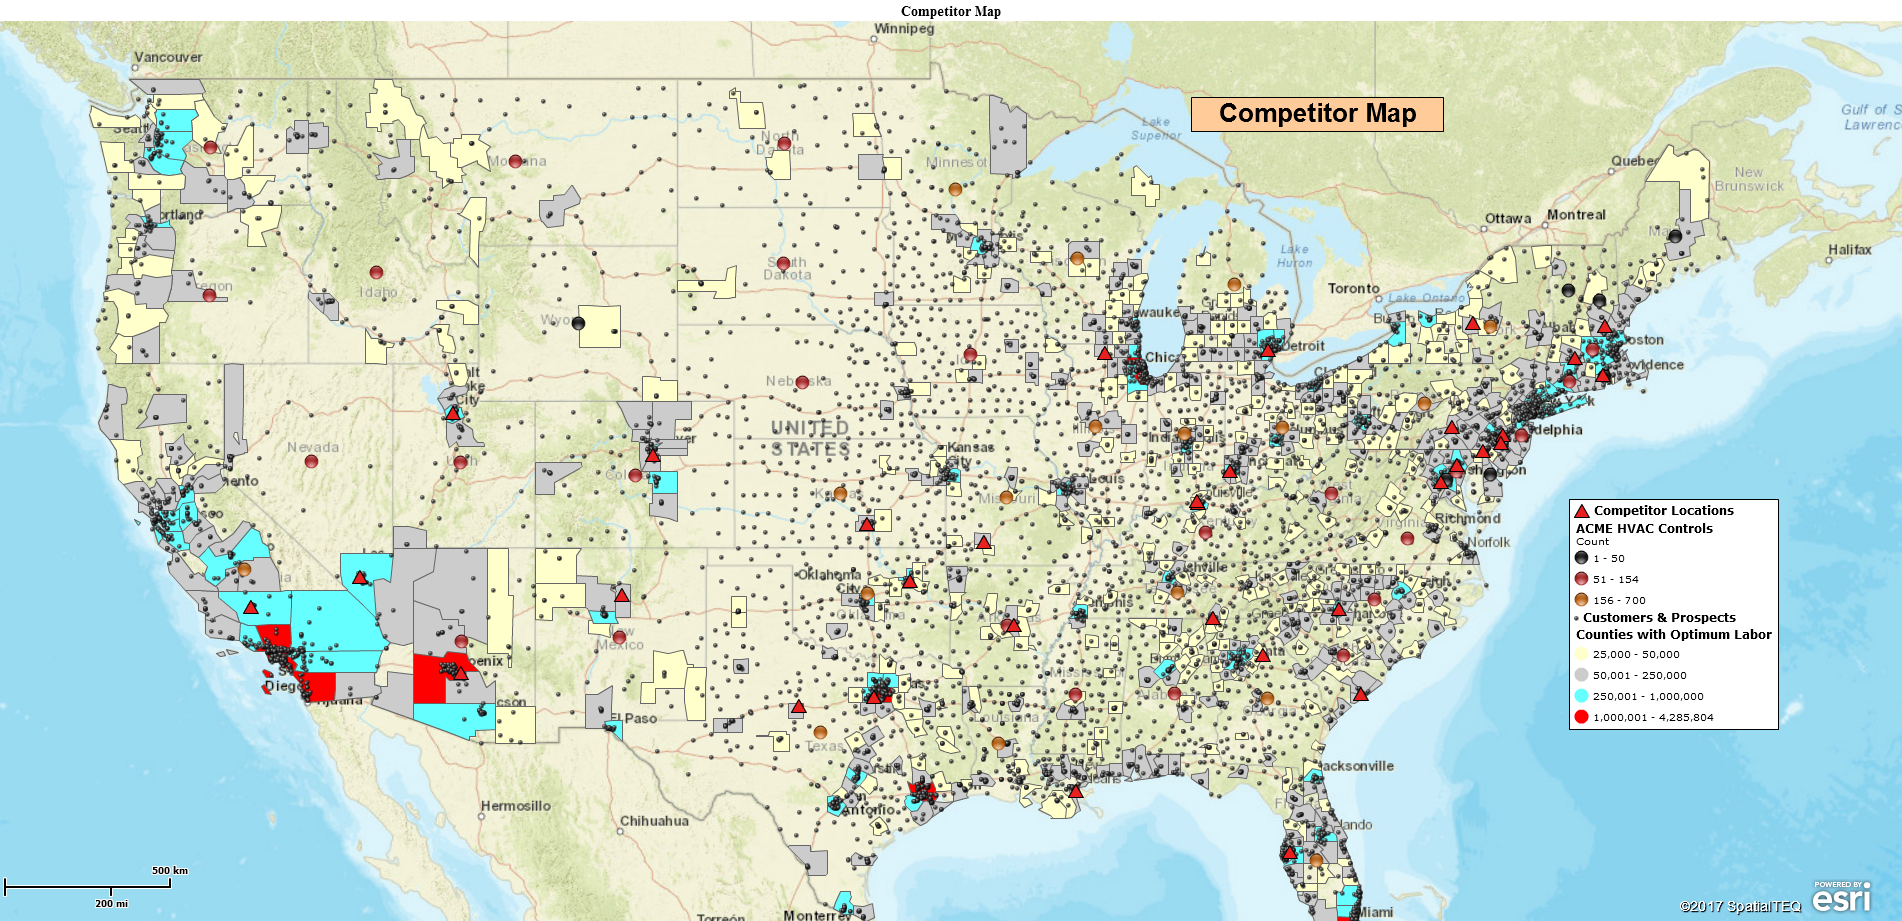
Competitor Map

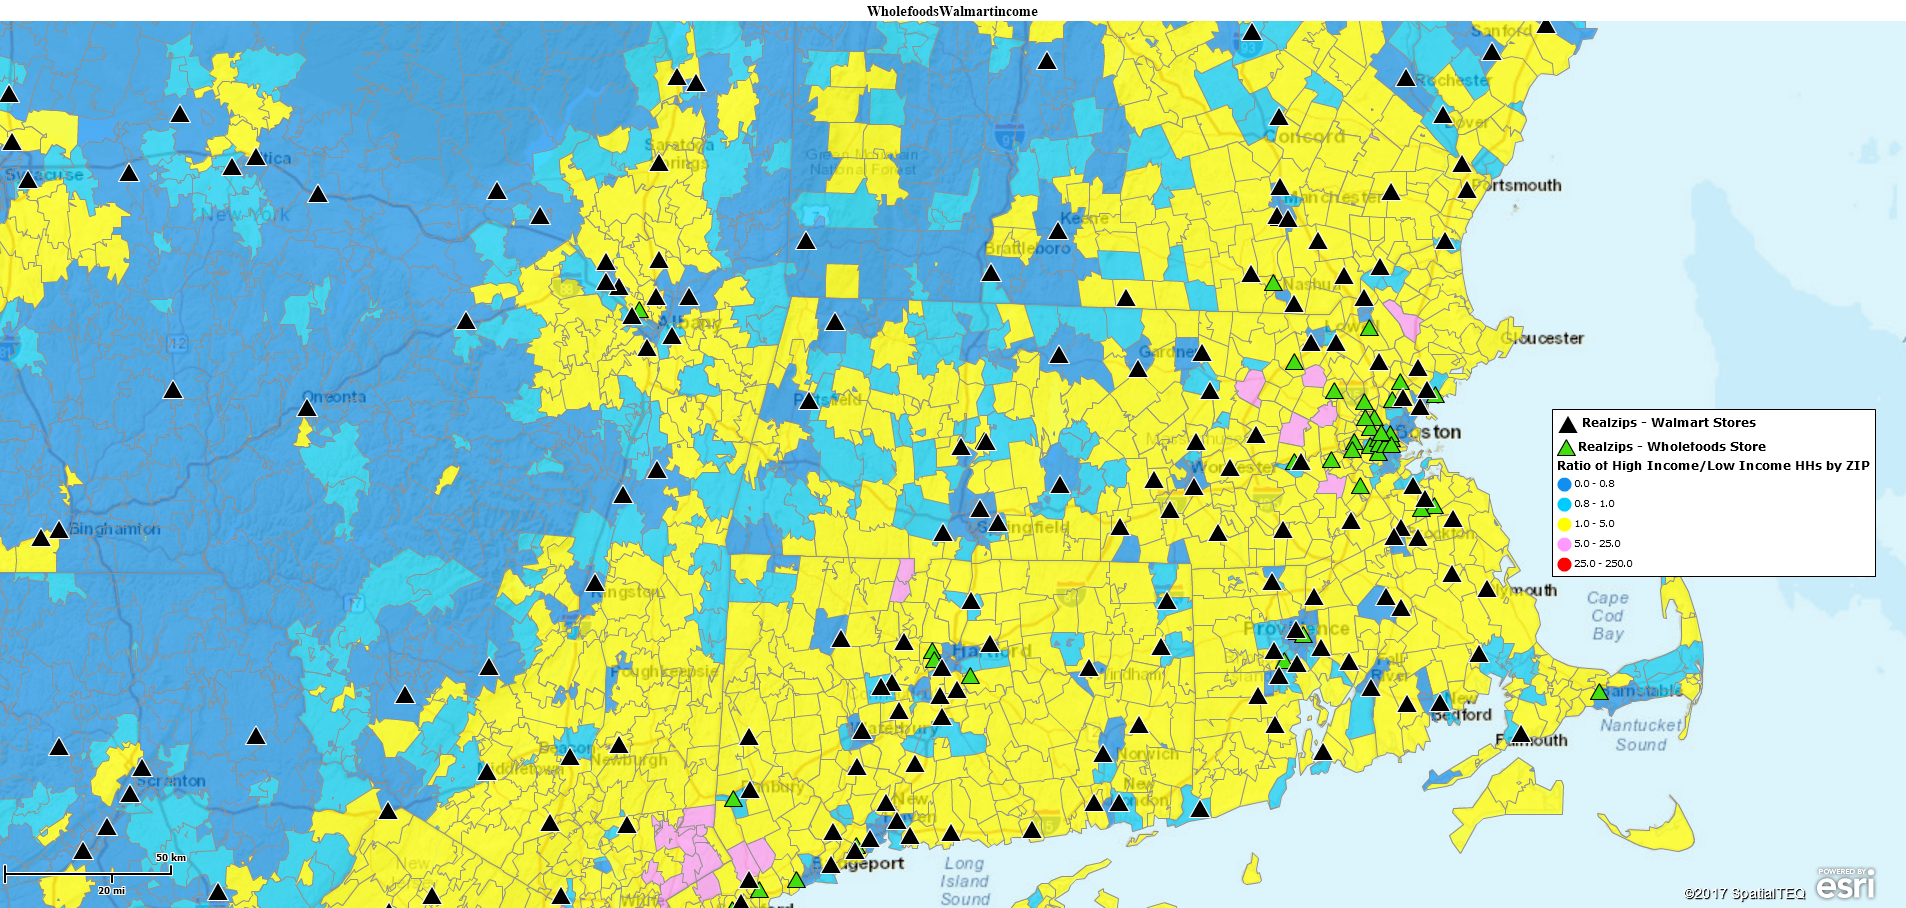
Understanding where competitors have opened competing stores and branches is, at times, critical to developing the correct sales plan.

A Competitor Map


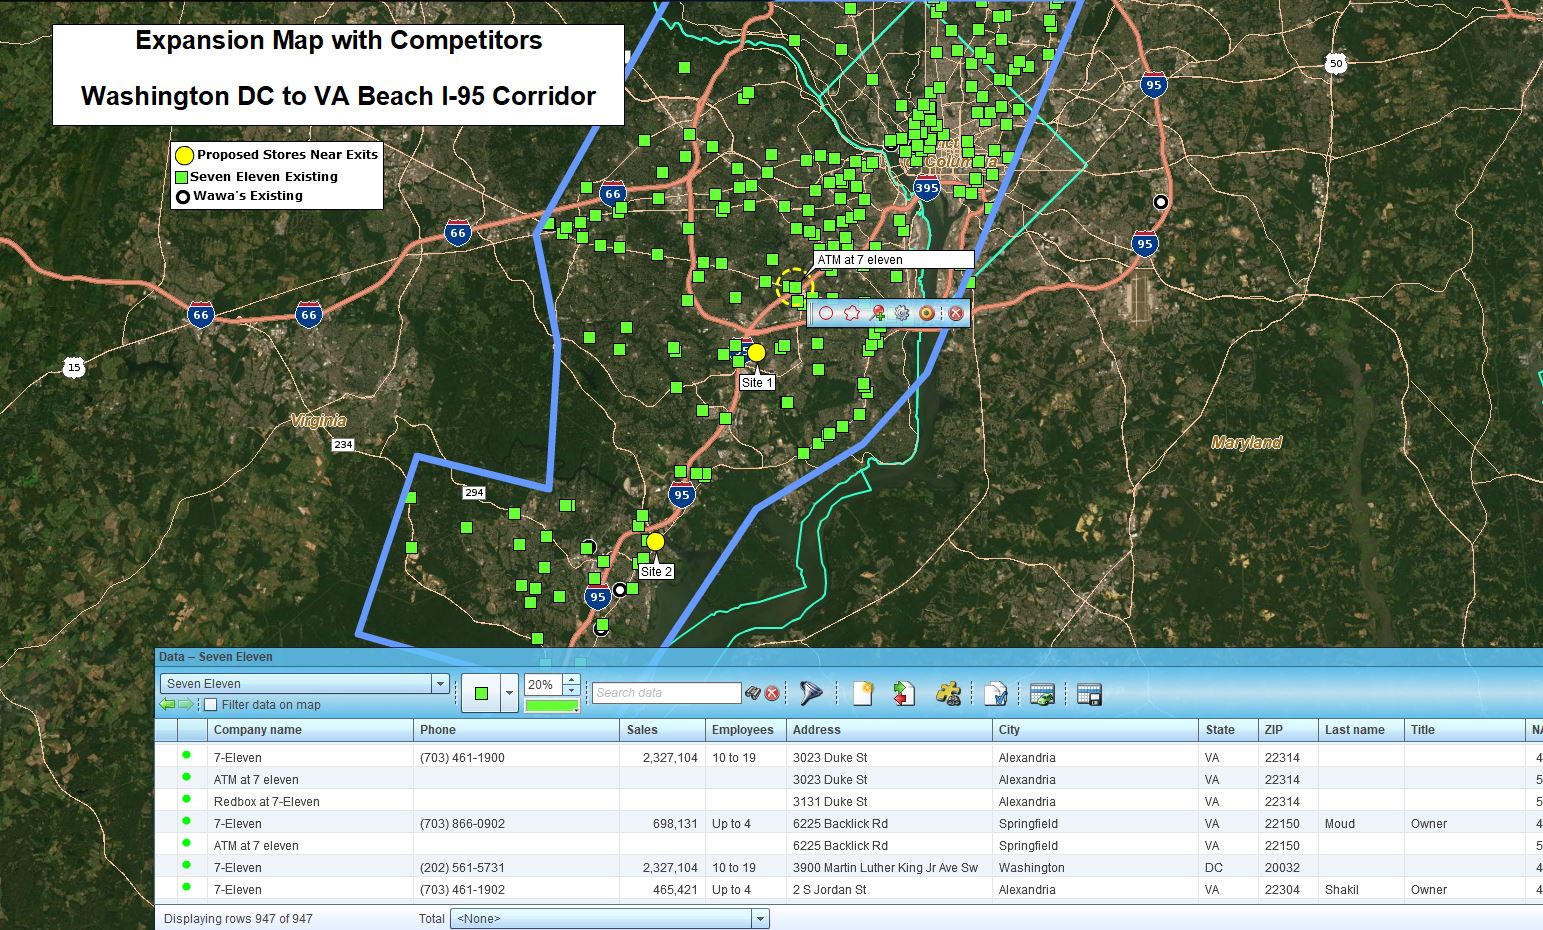
Market Analysis Map

Market analysis maps take a hard look at existing business activity, customer locations, required resource locations, labor statistics, demographics, and other critical business elements.  By compiling all of the data into complete market analysis, a business map can then develop expansion planning maps that expose the most lucrative markets for growth across the nation based on the critical business elements.

Read about market analysis examples in our Customer Case Studies page.

Retail Market Analysis & Expansion Planning

Now, Enough About Maps!

All the above-listed business maps ingest data to present new perspectives on operations, sales, expansion possibilities, and strategic directions. A geographic perspective helps inquisitive minds figure out new approaches to follow and untilled ground to furrow.

Now enough about maps. I can write about maps all day. It’s summer. Get outside and enjoy the ongoing pandemic. It won’t be here forever, you know.

Find out why over 25,000 business users log into www.MapBusinessOnline.com for their business mapping software and advanced sales territory mapping solution. The best replacement for Microsoft MapPoint happens to be the most affordable.

To access MapBusinessOnline, please register and then download the Map App from the website – https://www.mapbusinessonline.com/App-Download.aspx.

After installing the Map App, the MapBusinessOnline launch button will be in the Windows’ Start Menu or Mac Application folder. Find the MapBusinessOnline folder in the Start Menu scrollbar. Click the folder’s dropdown arrow and choose the MapBusinessOnline option.

The Map App includes the Map Viewer app for free non-subscriber map sharing.

Please read customer reviews or review us at Capterra, or g2crowd

Contact: Geoffrey Ives geoffives@spatialteq.com or Jason Henderson jhenderson@spatialteq.com
Posted in Business Mapping Software blog post | Tagged , , , , | Leave a comment

Everything You Always Wanted to Know About MapBusinessOnline but Were Afraid to Ask

This Blog is for new users and people considering a MapBusinessOnline Subscription.

MapBusinessOnline is a business mapping application. The tool creates customer maps, heat maps, sales territory maps, ZIP-code maps, and an array of market analysis maps.

When a MapBusinessOnline Standard subscription is purchased, the designated business mapping user has usually previously registered.  The user’s email address serves as the user name at login.  Step 1 – register.

Once registered, the user downloads the Map App, which provides the MapBusinessOnline launch button for the application. In addition to the MapBusinessOnline launch button, the Map App includes tools for Updating the application with the latest features and bug fixes.

Once MapBusinessOnline is booted up, the first-time user will be looking at a map of the USA or Canada, depending upon their subscription. Once MapBusinessOnline begins business mapping, the bootup map view will be the last map worked on.

Get Familiar with the Controls

The business map application has the Master Toolbar across the top, which contains most of the significant controls a map creator requires to build and share business maps. Read all the details about the Master Toolbar, button by button, here.

Another primary tool on the program is Map and Data. It is a Blue Box hovering over the map area with a list of map layers. Use Map and Data to control the map layers, such as states, ZIP codes, and imported data, and adjust the business map’s overall look and feel. Adjustments to each map layer start by hovering over the layer with your mouse cursor and clicking the Edit Gear.  Get all the details on Map Adjustments here and about the Map and Data box here.

Getting Around on the Map

Map navigation – use the mouse cursor to:

  • Drag the map around – click and drag.
  • Point into an area and double click to fly there.
  • Double click on the map to Zoom in (if the ZIP-code map layer is engaged, this operation can result in a ZIP-code selection)
  • Click and drag your mouse to Zoom in.
  • Use the Navigation Scrollbar in the upper righthand corner of the application screen for additional controls.
  • Zoom in and out with the scroll bar throttle or click the + and – buttons.
  • Click the USA Flag for USA view and the World button for a world view.
  • The Magnifying Glass icon is an excellent tool for zooming into key areas fast. Unclick it when done.
  • Finally, that up arrow at the bottom minimizes the scrollbar tool.
  • You’ll find additional Redo and Undo blue arrow buttons (outside of the Navigation Scrollbar) above the Adding to Map section of the Toolbar.

Start Mapping

To begin actual mapping, below is a list of commonly used map approaches and applications you can read about:

Maps for All Reasons

Business Mapping Resources

As you master MapBusinessOnline and learn how to create compelling and informative map visualizations supporting your business, you may begin looking for additional resources that can add value to your map projects. While MapBusinessOnline includes several such resources – demographic data, business listings, and aerial imagery – additional sources may be desirable. Consider these:

Tips

  • Remember to save your map work. For extra special maps you’ve put a lot of work into, critical to your business, save them as a Map Template.
  • MapBusinessOnline is a one-user-per-subscription-service. Do not share your password with others. Shared (non-team) subscriptions lead to lost map work.
  • If maps fail or you get error messages, run the Map App MapBusinessOnline Updater. The MapBusinessOnline Updater fixes most problems.
  • Avoid trying to solve all problems with one map. Build separate maps for different problems.
  • Keep you map simple, proof read, and easy-one-the-eyes.
  • For Help – Use the Help documentation. The MapBusinessOnline.com website has a Chat service we monitor during east coast business hours until 6 PM. Email works great too. There’s also a phone number (800) 425-9035

_______________________________________________

Find out why over 25,000 business users log into www.MapBusinessOnline.com for their business mapping software and advanced sales territory mapping solution. The best replacement for Microsoft MapPoint happens to be the most affordable.

To access MapBusinessOnline, please register and then download the Map App from the website – https://www.mapbusinessonline.com/App-Download.aspx.

After installing the Map App, the MapBusinessOnline launch button will be in the Windows’ Start Menu or Mac Application folder. Find the MapBusinessOnline folder in the Start Menu scrollbar. Click the folder’s dropdown arrow and choose the MapBusinessOnline option.

The Map App includes the Map Viewer app for free non-subscriber map sharing.

Please read customer reviews or review us at Capterra, or g2crowd

Contact: Geoffrey Ives geoffives@spatialteq.com or Jason Henderson jhenderson@spatialteq.com
Posted in Business Mapping Software blog post, How to instruction | Tagged , , , , | Leave a comment

MapBusinessOnline Business Mapping Software – Justified

Perhaps you require business mapping software to complete a project, or a small map requirement at the office is just aching for a tool like MapBusinessOnline to pull it together. But you’ve got to justify the investment in mapping software to management.

The merits of completing your mapping project should stand on their own, but the value of adding MapBusinessOnline to your business’s set of software tools is exceptionally high.

“As a United States Deputy Marshall, I always imported my crime scene location data onto a MapBusinessOnline business map. The map-based perspective always gave me ideas on what the Crowder family or Dewey Crow was up to this time.” – Raylan Givens US Deputy (TV) Marshall.

MapBusinessOnline is regularly applied to a variety of business disciplines around any office, including:

  • Customer Service
  • Field Staff Management
  • Finance
  • Logistics
  • Marketing
  • Sales
  • Strategic Planning

Common industries invested in MapBusinessOnline for their location-based business challenges are:

  • Banking
  • Construction
  • Food Services
  • Franchise Business
  • Government
  • Insurance
  • Manufacturing
  • Healthcare & Dentistry
  • Public Safety
  • Retail
  • Sales & Marketing
  • Service Businesses
  • Transportation & Logistics

Logistics & Construction Applications

Businesses that are all about storage and trucking turn to MapBusinessOnline for affordable solutions to reoccurring challenges.  Affordable optimized routing and turn-by-turn directions come in handy for truck drivers seeking accurate routes that incorporate time windows. Sometimes these hauling/logistics requirements belong to national firms, and at other times more regional companies use MapBusinessOnline routing tools.  Read more about MapBusinessOnline vehicle routing here.

The warehousing industry benefits from MapBusinessOnline’s map visualization capabilities. A business map can incorporate address spreadsheets of storage locations, repeat customer drop-off points, and business-related resources.  These transportation map visualizations accurately represent business systems supporting any number of industries with unique processes requiring the scheduled movement of raw materials, finished goods, and equipment within a region.  Use MapBusinessOnline to develop your business system visualization.

Business mapping organizes transportation workflows, driving down costs, improving efficiencies, and assuring timely deliveries.  LTL companies appreciate the combination of efficient route tools with business analysis that helps them compete because maps organize reality. Always keeping in mind that reality is a mess.  Any location intelligence dataset imported into a business mapping analysis can include 64 additional columns of data beyond name and address. Data such as:

  • Date codes
  • Weights and measures
  • Work orders & Purchase orders
  • Part numbers

Likewise, the construction industry leverages business map visualizations of construction sites for materials management and critical resources. Jobsites require monitoring of materials, labor, compliance with municipal codes, and delivery commitments. Having a business map overlaid with all relevant resources at critical locations keeps projects moving and helps identify bottlenecks in the supply chain or building process.

Business mapping offers at-a-glance visualizations of a business system that are easy to comprehend while providing the ability to drill down into greater detail.

Financial Services Industry

An industry buzz phrase, often thrown around by self-appointed industry gurus, is ‘situational awareness.’  Situational awareness happens when one uses location-based tools like geographic software, GPS tracking devices, and remote cameras and sensors to understand all you can about the area around your business or a critical asset in your charge.

Banks and lending institutions are responsible for many critical assets. Business mapping software is an easy and affordable way to track assets in the field geographically.  Map-based analysis of those assets can provide peace of mind for lenders and owners of homes, businesses, and expensive field assets like vending machines, ATMs, and video dispensing POS machines.

Demographic analysis by ZIP code exposes risks and opportunities for asset managers. Home prices in some areas maybe are due to a rise in values related to COVID-19 rural versus urban living preferences. Yesterday’s back-woods ranch becomes a safe, work-from-home paradise. Lenders compete to support this unexpected and lucrative real-estate boom.

Situational awareness can be more immediate requirement, as law enforcement pros know so well. Read more here. The situation a business map is exposing may be a broader, basic municipal awareness. Recent aerial and drone imagery are used to search for homes with swimming pools, a tax revenue generator, or monitor how road projects are faring. “How many trucks were in the parking lot on Friday, Janet?”

A little less sexy, but just as important, business mapping tools allow financial pros to analyze trends in location-based data. Color-coding ZIP codes by housing values, vaccination rates, and COVID-19 fatalities exposes risks by area while guiding families making big decisions in the face of rapid change.

Sales & Marketing

We talk a lot about sales and marketing in this blog, but that’s because sales and marketing as a business function are ubiquitous and fundamental. What company doesn’t support a sales and marketing department?

MapBusinessOnline is a primary software tool for thousands of sales and marketing departments across North America. Primary use cases include:

  • Sales Territory Management
  • Map-based Market Analysis
  • Sales Planning and Routing
  • Sales Forecasting
  • Sales Goal Development and Sharing

Business mapping software provides geographic perspectives of business systems. Never underestimate the power of a map view. Maps transform spreadsheet data into a comprehensive analysis of an overall territory, complete with goals, sales totals by month, areas of overlap, and account-by-account critical data. Leverage your sales territory map visualization into a comprehensive analysis of sales activity for the year.

Achieve powerful and inciteful assessments of your business through the power of location-based analysis:

  • Business listings search
  • Competitor maps
  • Customer Map
  • Demographic analysis
  • Dot density maps
  • Heat maps
  • Sales territory maps
  • ZIP-code maps

MapBusinessOnline Used to Create a Customer Map

Justified

MapBusinessOnline is your jumping-off point for a fuller perspective of your business systems, regardless of the discipline or the industry. Applications for business mapping are so horizontal, justification for the expense practically writes itself. Compared to other sales, marketing, and operational software expenses, business mapping software is a bargain.

Ask your boss, “Is it worth $500 to get a detailed visualization of your entire business system?”  If the answer is, “No,” then it may be time for a new boss.

When your business discovers a need for a map that supports a business process, realize that your immediate map requirement is just the beginning. Business mapping opens up a world of new perspectives and penetrations that drive a business forward through situational awareness and comparative insights.  Justification of business mapping starts the first time you realize a map would help.

_______________________________________________

Find out why over 25,000 business users log into www.MapBusinessOnline.com for their business mapping software and advanced sales territory mapping solution. The best replacement for Microsoft MapPoint happens to be the most affordable.

To access MapBusinessOnline, please register and then download the Map App from the website – https://www.mapbusinessonline.com/App-Download.aspx.

After installing the Map App, the MapBusinessOnline launch button will be in the Windows’ Start Menu or Mac Application folder. Find the MapBusinessOnline folder in the Start Menu scrollbar. Click the folder’s dropdown arrow and choose the MapBusinessOnline option.

The Map App includes the Map Viewer app for free non-subscriber map sharing.

Please read customer reviews or review us at Capterra, or g2crowd

Contact: Geoffrey Ives geoffives@spatialteq.com or Jason Henderson jhenderson@spatialteq.com
Posted in Business Mapping Software blog post, Sales and marketing | Tagged , , , | Leave a comment

Vehicle Routing Using MapBusinessOnline

Following the demise of Microsoft MapPoint, here at MapBusinessOnline, we began to receive more frequent calls, chats, and emails from people seeking optimized vehicle routing.

MapPoint gave away some powerful routing functionality, leaving many users at a loss for where they could go for efficient routing services, driving time and distance queries, and vehicle tracking services.

While MapBusinessOnline Standard and Pro do not offer vehicle tracking, they offer vehicle routing tools and the ability to generate powerful driving time and distance queries. MapBusinessOnline Pro offers advanced driving time and distance analysis at an very affordable price compared to other solutions in the marketplace.  MapBusinessOnline Standard provides one address point driving time analysis as a search tool option.

But taking a few steps back, I thought it might be helpful if I wrote about some of the parameters MapBusinessOnline has regarding vehicle routing and route analysis.  As I mentioned above, MapPoint gave away features by including them in the overall cost of a MapPoint license, roughly $350.00. After MapPoint’s business mapping software was canceled, systems built on those tools had no place to go for tracking and routing services.

Routing in MapBusinessOnline

To route many stops in MapBusinessOnline, it is best to import a list of addresses.  Import your spreadsheet using the Dataset button under Adding to Map on the Master Toolbar. The Datasets button offers an import wizard to help you through the process of importing data.  Read more here.

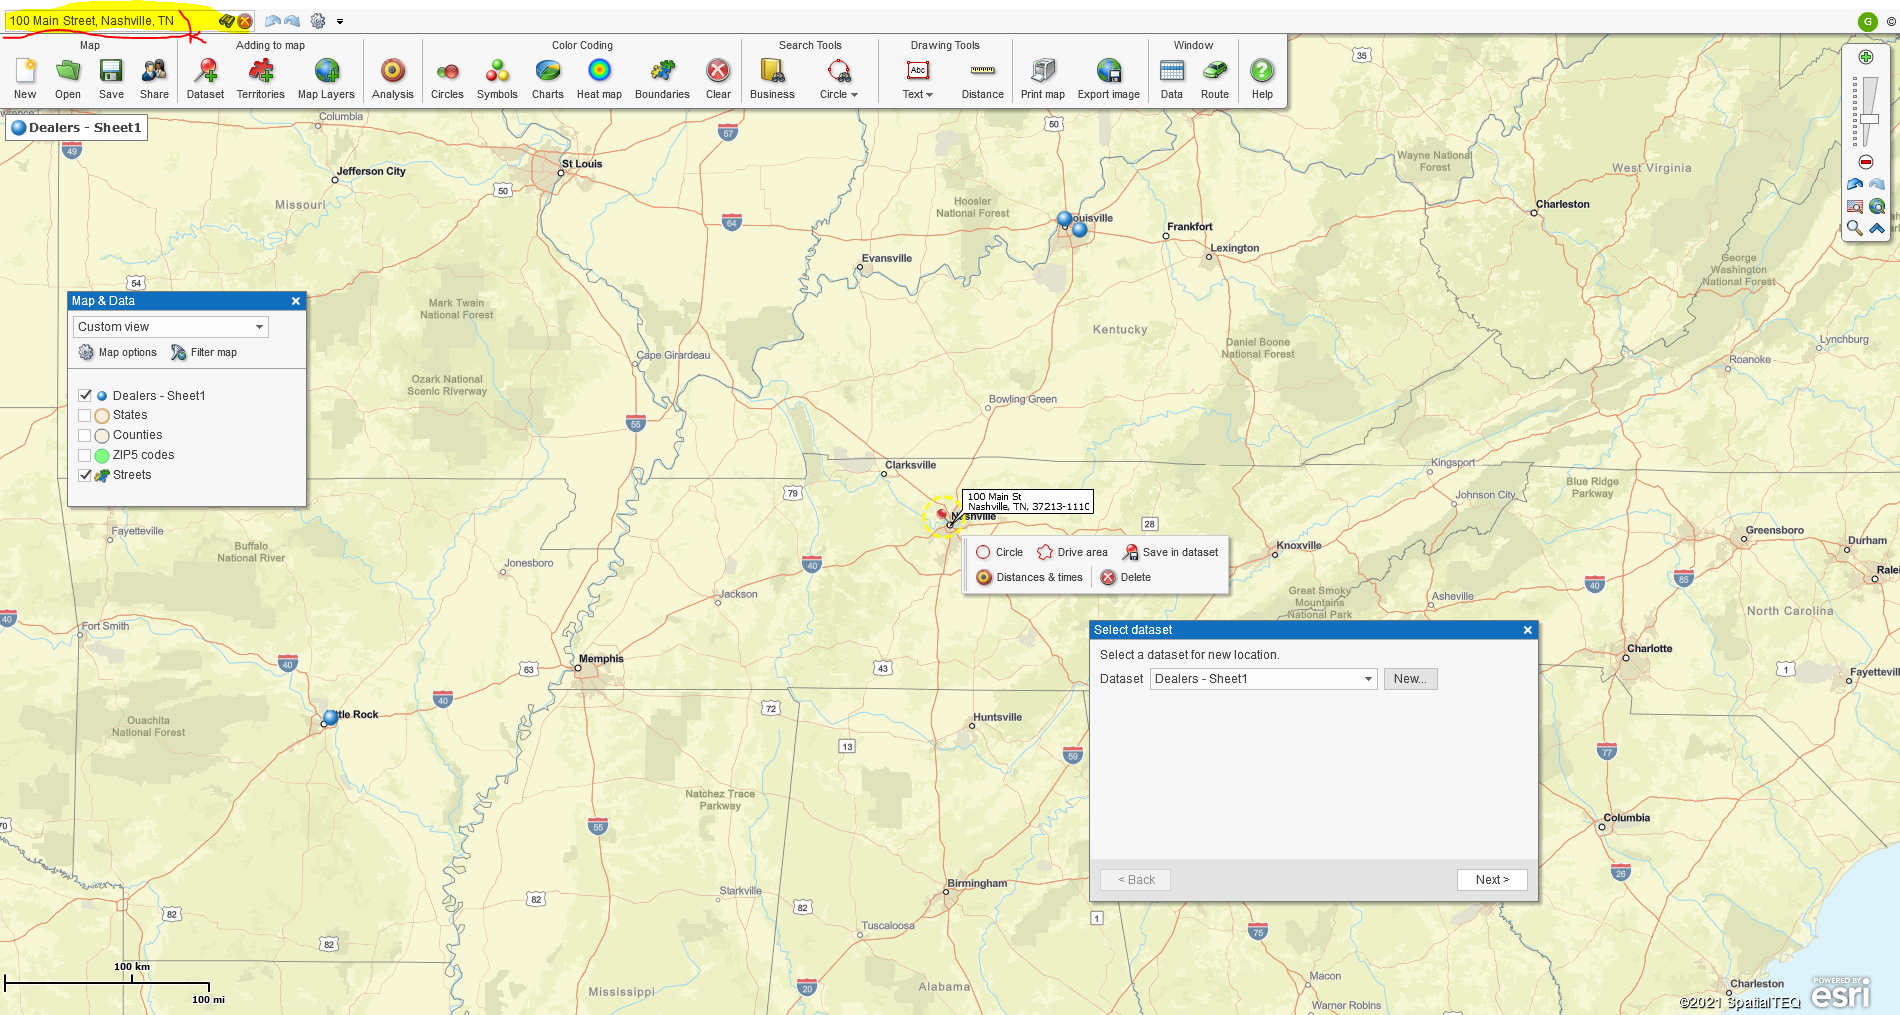
You could also place incremental stop points on the map, one location point at a time, by using the Address Bar in the upper left of the application. Make sure to use this format: Address, City, St, ZIP Code. The incremental data plotting process lets users create a dataset and name each address location as they import data.

Incremental Data Additions


Once address datasets are imported or created in MapBusinessOnline, a route user can build an optimized route, one route at a time, with up to 150 stops per route. There are three approaches to routing:

  1. Map Centric – On the map, use your cursor to hover over a point, or click into the Callout label, and click the green Car icon to select a point for route inclusion. The Routing application lets the user choose the address location’s Route role – Start, Finish, or Stop.
  2. Data Window – Tabular views of imported address data let the user hover their cursor over the far-left columns of data exposing that same green Car icon, enabling Routing.
  3. Add to Route – In the Data Window view, with your imported data layer selected, select or filter to develop a group of data records in the Data Window, then click the Add to Route button on the Data Window toolbar.

Any of these approaches launches the Route window. Once the route stops are selected, and the Route window is open, MapBusinessOnline provides the following capabilities:

  • Optimize the route for the most efficient travel time or route in stop dataset presentation order.
  • Adjust route stop order Manually by moving the stops up or down in the route list with your cursor.
  • Create a one-way route or a round trip Route.
  • Time windows are supported – you’ll need arrival and stop duration times in your spreadsheet.
  • Generate turn-by-turn directions – Create a PDF file with detailed directions or just a trip plan with a list of stops.
  • Export route files in CSV, GPX, HTML, ITN, and PDF file formats
  • Share Map routing capabilities with non-subscribers using the Map Share button on the master toolbar. Non-subscribers can create incremental routes using those shared web maps.
  • Lat/Long Support – Imported data records can be geocoded by latitude/longitude coordinates. Export options include GPX files that contain latitude and longitude coordinates, but the tool does not support lat/long generation.

MapBusinessOnline Routing Limitations

  • MapBusinessOnline routes support up to 150 stop-off locations per route.
  • MapBusinessOnline only presents one route at a time. A user cannot generate multiple routes at the same time on one map. You could, however, generate multiple maps, each with one route displayed at a time.
  • MapBusinessOnline route stops do not include data fields to support extra data. The data fields allowed include Name, Street address, City, State, and ZIP code. If you require additional label data, we recommend adding it to your name field in the original dataset upload. Use MapBusinessOnline marketing lists in the Data Window to show points on the map with additional data columns.
  • MapBusinessOnline does not track vehicles.

MapBusinessOnline offers routing services to each subscriber and provides a shared map routing tool with incremental routing for non-subscribers.

Popular MapBusinessOnline routing applications include:

  • Outside salespeople and traveling technicians routing to customer calls
  • Sales admins tasked with map sharing and route generation for traveling salespeople
  • Home care and traveling medical professionals
  • Retail merchandisers maintaining regional and national store displays
  • Long haul freight routing for furniture and LDL hauling (MapBusinessOnline does not include trucker routing data)

MapBusinessOnline routing is affordable and easy to process. The tool provides excellent sales territory mapping tools. Ex-MapPoint users will be glad to find an online routing service with up-to-date street data and ZIP codes.

_______________________________________________

Find out why over 25,000 business users log into www.MapBusinessOnline.com for their business mapping software and advanced sales territory mapping solution. The best replacement for Microsoft MapPoint happens to be the most affordable.

To access MapBusinessOnline, please register and then download the Map App from the website – https://www.mapbusinessonline.com/App-Download.aspx.

After installing the Map App, the MapBusinessOnline launch button will be in the Windows’ Start Menu or Mac Application folder. Find the MapBusinessOnline folder in the Start Menu scrollbar. Click the folder’s dropdown arrow and choose the MapBusinessOnline option.

The Map App includes the Map Viewer app for free non-subscriber map sharing.

Please read customer reviews or review us at Capterra, or g2crowd

Contact: Geoffrey Ives geoffives@spatialteq.com or Jason Henderson jhenderson@spatialteq.com
Posted in Business Mapping Software blog post, How to instruction | Tagged , , | Leave a comment

9 Ways Business Mapping Enhances Professional Presentations

Visual business presentations are everywhere. So much so that they are in danger of saturating their audiences and losing precious views.

As business people, we are presented-to at work, in board rooms, and conference rooms. At home, we find ourselves presented-to by slideshows on Facebook or YouTube. We might even click on a Ted Talk to learn this or that.

We see so many business presentations we tend to skip whole sections or just move on, if the presentation doesn’t immediately catch our attention. Because of the large volume of talks and tutorials we’re constantly exposed to, those slideshows must include eye candy to retain viewer interest.

MapBusinessOnline is an affordable map generation tool that offers easy access to compelling map images that stave-off presentation overload.  If you’re creating your presentation using business presentation software, consider supplementing your slideshow with map images from a business mapping software like MapBusinessOnline.

Why Use Business Maps to Enhance Presentations?

Business maps are valuable visual enhancements to business presentations for a variety of reasons:

  • Maps are sexy. People like to view maps, especially maps that provide contextual spatial awareness.
  • Maps hold the viewer’s attention because they offer a non-script alternative image that breaks up the monotony of the written word and provides a pleasant background image that compliment lectures and slideshows.
  • Maps connect presentation concepts with real-world locations. A presentation on Boston begs for a map of the city for refence.
  • Most people are comfortable viewing map images. Map comprehension is taught in elementary school. Today, maps are used by millions of travelers daily as navigation aids.
  • Maps are for sharing. Business maps communicate business concepts and help focus a team on a goal or a project.

Many business presentations stand to benefit from map visualizations and map-based demographic analysis. Your business presentation should include maps if:

  • The presentation topic has an administrative district association. If addresses, cities, ZIP codes, or other administrative districts are associated with the topic, a map will always augment the presentation.
  • The discussion presents monetary values or demographic data metered out by district. Sales histories, population growth, household income are all data that enrich a business presentation.
  • Location-based data is associated with societal trends or events such as crimes, epidemics, or demographic shifts. Map images often reveal unique perspectives on collected location data. Examples abound of serial criminal activity tracked by location and then mapped, revealing likely perpetrator sources.

Crime Map Using MapBusinessOnline

  • Your business already uses business maps. Retailers use business maps to organize and track marketing campaigns. Real estate pros use business maps to organize their address-based opportunities. Insurance companies use business maps to evaluate risks, monitor claims, track sales and manage sales territories.

Easy-to-use Mapping Tools

Business mapping software offers a variety of graphic tools designed to develop compelling visualizations for presentation support.  Background map options can include recent and cartographically accurate street and topographic layers – excellent base maps for any professional slide presentation. Satellite and aerial imagery views are popular tapestries behind city or county map areas because they combine vegetative canopy with building footprints in a way that is recognizable by most map viewers.

Business maps provide administrative district map layers such as ZIP codes, Counties, City Limits, and States that serve as reference guides for target audiences. These districts also present natural units for demographic data aggregation.  ZIP code or County population and household statistics can be visualized by numeric value in district map labels or color-coded by administrative map layer.

Presentation creators have choices regarding which eye candy will best capture their target audience’s attention.  Additional tools include libraries of demographic data, business listings, and geographic segmentation. The ability to highlight map objects – circles, polygons, or drive time areas – can be used to emphasize important areas relating to presentation subjects. Business mapping tool also offer the very powerful capability to import and display relevant proprietary business data.

Business map images import into presentation software as Jpeg, PNG, or PDF files, for easy inclusion in a PowerPoint presentation or a slide show. Typical software license terms allow embedding maps in presentations if the slideshow isn’t a revenue-generating service.

Whether your business map supports market analysis, sales territory management, or strategic planning, make sure your next presentation is made in front of a wide-awake audience by embedding map images from MapBusinessOnline.com.

To try a business map in your presentation, go to MapBusinessOnline.com and sign up for a FREE trial.

_______________________________________________

Find out why over 25,000 business users log into www.MapBusinessOnline.com for their business mapping software and advanced sales territory mapping solution. The best replacement for Microsoft MapPoint happens to be the most affordable.

To access MapBusinessOnline, please register and then download the Map App from the website – https://www.mapbusinessonline.com/App-Download.aspx.

After installing the Map App, the MapBusinessOnline launch button will be in the Windows’ Start Menu or Mac Application folder. Find the MapBusinessOnline folder in the Start Menu scrollbar. Click the folder’s dropdown arrow and choose the MapBusinessOnline option.

The Map App includes the Map Viewer app for free non-subscriber map sharing.

Please read customer reviews or review us at Capterra, or g2crowd

Contact: Geoffrey Ives geoffives@spatialteq.com or Jason Henderson jhenderson@spatialteq.com
Posted in A story, Business Mapping Software blog post | Tagged , , | Leave a comment

Color-coding Large Quantities of Customers on a Business Map

Business map users often have an address-based dataset to import into their mapping applications. Sometimes these datasets have full addressing. At times, they have only a ZIP code associated with each record, or each point may be geolocated by latitude/longitude coordinates.  MapBusinessOnline supports all of these location plotting options.

Color-coding Points

Suppose a MapBusinessOnline user imports an address-based dataset under Adding to Map. In that case, the Dataset process leads to map points representing all of the addresses in the imported dataset. Those points can then be color-coded by a column in the data, providing point differentiation on the map by classification.

Classification is a fancy way of saying by type. If, for instance, you imported a customer dataset with a column for Customer Type, then the color-coding process could color-code by customer type. Each customer type will display as a specific color point on the map. Bakeries might be green, Hardware Stores might be red, Hospitals might be blue, and so on.

Use the Symbols button under Color-coding on the Master Toolbar to color-code your imported data. Read more about color-coding points here.

MapBusinessOnline allows for up to 100 color variations for any imported list of points. So, if your dataset has less than 100 types, classifying all records by color is possible.  If it has more than 100 types, you may need to split the data into multiple datasets.

However, before you go color-coding 99 points with slightly different shades of purple, let’s think this through. How do you think your map viewer will react to 99 shades of purple representing all your customers? In my experience, your map audience is not going to comprehend your map. Be careful about overwhelming the map viewer with too many color variations.

And what if you customer list is more numerous than 200 customers?  How will you represent 500 or more customers on the map?

We recognize that there are times when the higher-ups in your organization insist that you color-code every record from a large spreadsheet. We advise you to proceed with caution because data color-coded with many colors can be confusing to business mapping software viewers.

Perhaps too many colors

Not too many colors

Classify Your Customers

One way to solve this imported customer map point dilemma is to classify the customers by type.  Here’s a more expansive list of possible customer types (keeping in mind your imported data could be something else besides customers):

  • Automotive Tier II
  • Big Box Store
  • Brewery
  • Bio-chem Laboratory
  • Bakery
  • Chemical Factory
  • Dentist
  • Franchise Business
  • Manufacturer
  • Medical Center
  • Retailer
  • Paper Company
  • Plumbing Supply
  • Variety Store

The possible list of customer/data types is endless, but usually, a company sells into less than ten markets. By classifying your customer data, you will organize your list while reducing the clutter on the map. All the points representing manufacturers will all be one color shade. For extremely large or critical customers, classify those customers uniquely by coloring them with a bright red or black color for fast identification.

MapBusinessOnline makes it easy to color-code up to 100 points by color. Try different classification schemes besides customer type. You could, for instance, classify your accounts by sales dollar ranges, sales rep, or the number of employees.

Also, the color-coding by Symbols process allows a map creator to Summarize your imported data by County, State, City, or ZIP code. Summarization is presented at step one of the the color-coding process. Summarization by map layer is another way to consolidate imported data.  It’s worth a try if your imported data is large and concentrated in a particular region.

Import Territories Through Market Analysis Instead

While MapBusinessOnline limits the classification color-coding options to 100 color shades per dataset, the number of territories allowed per map is 1,000.  So, where you could only apply 100 color classifications to an imported point layer, a user could import up to 1,000 territories per map.

One thousand territories are a lot of territories.  A business map user rarely requires that many territories. But territories can solve the issue of displaying all customers on one map for any business requiring it.  And it does happen.  A territory solution will still be a busy map, but if the requirement is to show every customer on a list of more than 100 customers, territories may be the way to go.

While there may be actual territories defined for each customer by ZIP code, County, or City Limit, I suggest choosing a small radius, perhaps 1 mile, so each location gets a ZIP code territory. Here’s how it works:

Import the list of Customers using the MapBusinessOnline Market Analysis button option 1 – Search and Segment Data from Multiple Centers

  1. Select the Target Dataset of Customer addresses. Be sure to match the Name with the correct column in your data for name labeling.
  2. Choose Straight Distance as your Radius search option (1 mile.)
  3. Do not bother drawing circles around each location (the maximum allowable limit is 200 drawn objects.)
  4. Process page one by clicking Next in the lower right.
  5. On page two, select the ZIP code layer for Searching.
  6. Very Important – check on the Box at the bottom of the layer list that says Create Multiple Territories.
  7. Process by clicking Create in the lower right.

This process will create a set of ZIP codes territories instead of a list of points. Each territory will have a label.

This solution works best for lists of between 100 and 500 territories. It’s also most effective if the overall distribution of the customer locations is spread out nationally or over a relatively wide region.  If, for example, you limit the search criteria for 500 records to the state of Massachusetts, the map will become too cluttered to be effective. Try it and see how it works. You can always delete the work.

In some cases, this means the boss’s desire to see every customer color-coded on the map is a bad idea from a mapping perspective. So, brace yourself. You know how very stable geniuses can be.

Once the territories by ZIP code are established, you can use the Color-code by Territory button in Map and Data to color-code each territory by a column within your data.

MapBusinessOnline provides options for color-coding points, territories, or map layer objects.  Try the various options to decide what is the best solution for your business requirements.

Just make sure your map is understandable for your map audience. Because when the attendees at the meeting tell your boss the map makes no sense, who do you think will take the heat?

_______________________________________________

Find out why over 25,000 business users log into www.MapBusinessOnline.com for their business mapping software and advanced sales territory mapping solution. The best replacement for Microsoft MapPoint happens to be the most affordable.

To access MapBusinessOnline, please register and then download the Map App from the website – https://www.mapbusinessonline.com/App-Download.aspx.

After installing the Map App, the MapBusinessOnline launch button will be in the Windows’ Start Menu or Mac Application folder. Find the MapBusinessOnline folder in the Start Menu scrollbar. Click the folder’s dropdown arrow and choose the MapBusinessOnline option.

The Map App includes the Map Viewer app for free non-subscriber map sharing.

Please read customer reviews or review us at Capterra, or g2crowd

Contact: Geoffrey Ives geoffives@spatialteq.com or Jason Henderson jhenderson@spatialteq.com
Posted in Business Mapping Software blog post, How to instruction | Tagged , , , | Leave a comment

4 Simple Business Map Approaches for First-time Users of MapBusinessOnline


Jason was out on vacation last week, and I found myself once more in the hot seat answering phones and chats. As usual, I came away thinking about new blogs I could write.

One of the challenges in providing map instructions to new users, especially users new to business maps in general, is giving them a basic map to work with that satisfies their immediate requirements. Later a user can try more complex mapping options.

In the past, I’ve tried to find the most basic map example and write about it. But within a month or so, I run across a new map user with new requirements for a still pretty basic business map. So, below are four examples of basic maps a first-time user could try:

A Basic Map View Around a Central Point or ZIP Code

Not every new map user has a location dataset to import. Customer or patient datasets are a great place to start, but if your mapping doesn’t involve a dataset, try starting with your current address or ZIP code.

Put your address [Street, City, State Abbreviation, ZIP] into the Address Bar in the upper left corner of the business mapping application.  If all you have is a ZIP code, key that in. Click the Binocular Icon to the right of the Address Bar.

MapBusinessOnline will zoom into your address or ZIP code and place a point on the map with a Mini-toolbar associated with the point present in the map view. Use the Navigation Scrollbar in the upper right of the application to pull back and set an adequate map view around your area of interest.

Next, in Map and Data, turn on the primary map layers you’d like to include in your map view.  ZIP codes and States are a great starting point for map layers. You’re going to be upset now because the ZIP code layer blocks your map view of the Street background. No worries.

In Map and Data, hover your cursor over the Map Layer and click the Edit Map Properties gear. Under the General Tab, push the Transparency Scrollbar to the right to adjust the opacity of the ZIP codes. You will also find adjustments for boundary line thickness and color and a Fill check box with color options.  These tools provide controls for your map’s look and feel.  Learn to love them. Each map layer has identical controls.

Tweak the map to your liking. Consider additional layers in the Add Map Layer button on the Master Toolbar. Add city limits, highways, or even Census Bureau marketing statistical areas (MSA’s) to your map.

Sit back and review your work.  Check you spelling. Delete layers and draw objects you don’t need. Keep your map simple and focused on your map’s purpose. Try different map backgrounds or even no map background.

A Basic Map Around a Zip Code with National Geographic Background Map

A ZIP Code Map

ZIP code maps come in several different flavors – Read more about ZIP code maps. So, flavor-wise, there are multiple approaches to ZIP code mapping for the new user:

  • Use a polygon Search Tool to select a group of ZIP codes and save that selection as a territory or area of interest. This initial group of ZIP codes will be color shaded. You can easily add or remove ZIP codes as required. Read more about map editing.
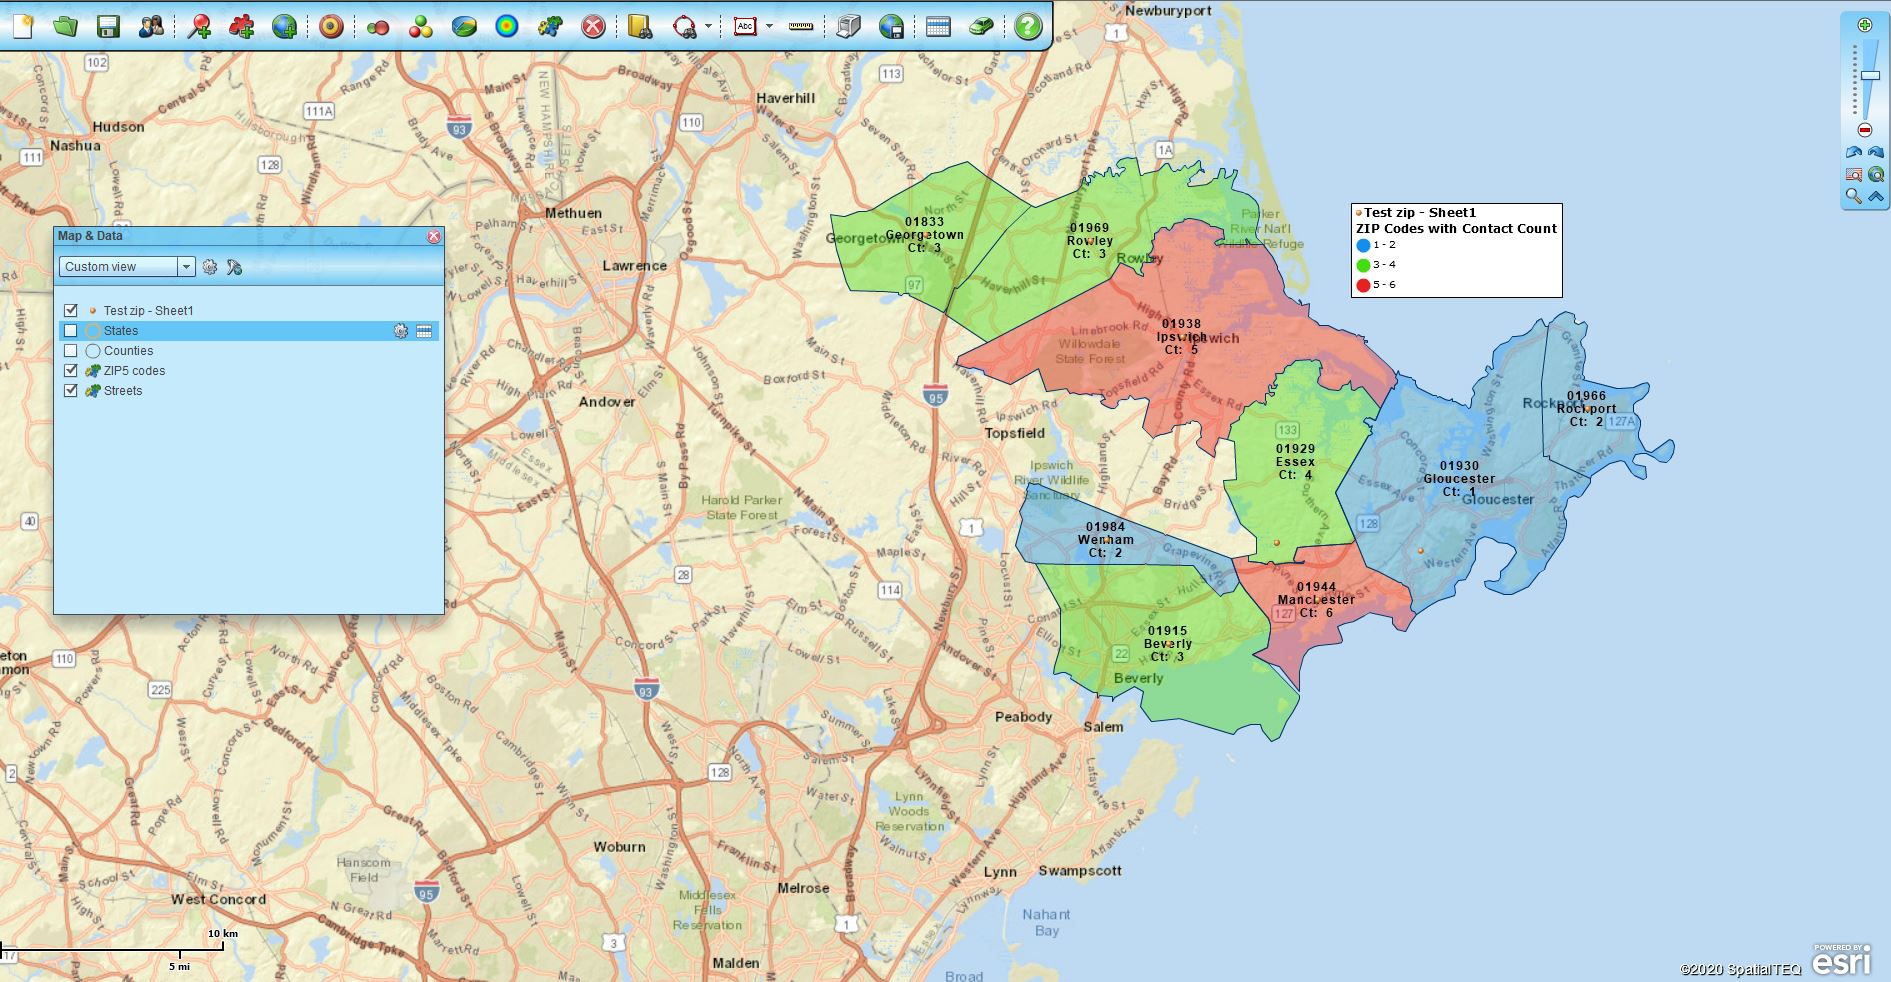
  • Import a list of ZIP codes and color-code MapBusinessOnline’s ZIP5 code layer based on your imported list. Turn off the imported point layer and view the color-shaded ZIPs. You can color-code based on Count or a numeric column in your imported data. Use the Boundaries button on the Master Toolbar’s Color-Code section to color shade ZIP codes based on imported data.  For some users, this is all they require from MapBusinessOnline.
  • You could leave your imported ZIP code dataset or address dataset on the map and color-code those points you’ve imported using the Color-Code Symbols button on the Master Toolbar. Remember you can always aggregate numeric data from your spreadsheet into the flexible label fields of your data points or map layers (like ZIP code labels.) Read more about labeling here.

ZIP Code Map by Count

An Imported Address Spreadsheet Map

Many first-time MapBusinessOnline users import address spreadsheets that show customers, patients, or resources against an accurate map. MapBusinessOnline provides an easy Dataset import process that begins by clicking the Datasets button in the Adding to Map section of the Master Toolbar.

Follow the import dialogue provided when you click Datasets under Adding to Map or  read more about the process.

With data imported into the business map, there are a plethora of things you can do with it:

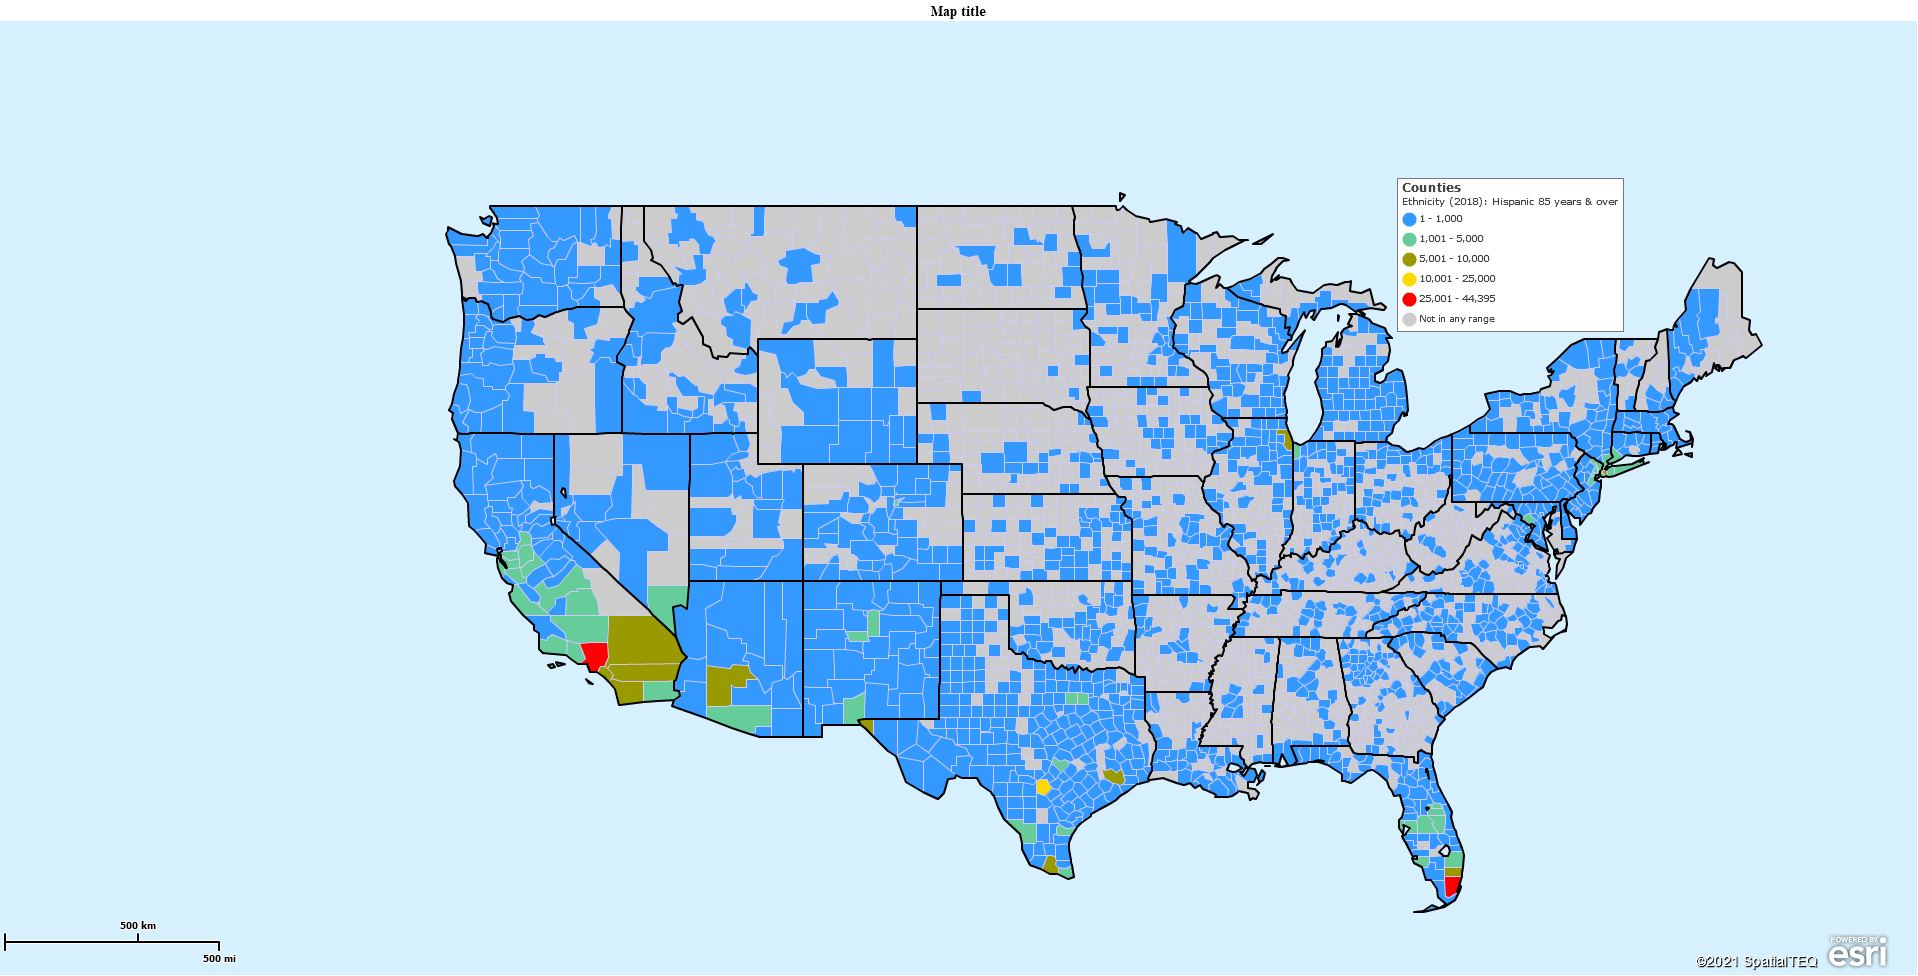
A Basic Demographic Map

Another common first map requirement is a basic Demographic map.  This mapping approach doesn’t necessitate importing user address data. But it will likely include map objects on the map.

MapBusinessOnline lets users access Demographic Data through the Summary Button.  Any selected map object includes a mini-toolbar with a Summary Button option.  Select the Summary button and choose up to ten Demographic categories to add to the map object for quick and easy export or map placement of a spreadsheet. Read more about quick demographic maps here.

Open the Data Window for a more detailed tabular data view of mal layers including, ZIP codes, counties, city limits, and user-created territories.  Use the Choose Columns button to add demographic layers to your map analysis. Read more about Choose Columns here.

Any of the above basic map approaches are an excellent place to start business mapping.  The new user, armed with an understanding of how these basic mapping processes work can consider sales territory mapping as a next step.

_______________________________________________

Find out why over 25,000 business users log into www.MapBusinessOnline.com for their business mapping software and advanced sales territory mapping solution. The best replacement for Microsoft MapPoint happens to be the most affordable.

To access MapBusinessOnline, please register and then download the Map App from the website – https://www.mapbusinessonline.com/App-Download.aspx.

After installing the Map App, the MapBusinessOnline launch button will be in the Windows’ Start Menu or Mac Application folder. Find the MapBusinessOnline folder in the Start Menu scrollbar. Click the folder’s dropdown arrow and choose the MapBusinessOnline option.

The Map App includes the Map Viewer app for free non-subscriber map sharing.

Please read customer reviews or review us at Capterra, or g2crowd

Contact: Geoffrey Ives geoffives@spatialteq.com or Jason Henderson jhenderson@spatialteq.com

Posted in Business Mapping Software blog post, How to instruction | Tagged , , , | Leave a comment

Private Map Sharing for Co-Editing in MapBusinessOnline

Business map users sometimes desire to share map editing privileges with their associates.  In other words, one subscriber to MapBusinessOnline business mapping software would like to share their business map with another subscriber to get more editing input – to leverage more than one head towards a solution.  Sometimes two or more map editors are better than one. Sometimes a whole team of map editors is the best solution.

[See Terms of Use Agreement that prohibits multiple editors logging into the same Standard Subscription. Collaborative editing through private sharing requires a minimum of two MapBusinessOnline Standard subscriptions.]

MapBusinessOnline encourages users to share maps. We offer two different approaches to map sharing:

  1. Public Sharing (View only) – Sharing your saved map as an interactive, view-only, web map. We call this public sharing and it does not enable collaborative editing. Public map sharing is provided at no charge for up to one hundred web sessions per month. Through this process the map creator can share interactive web maps for view only access.
  2. Private Sharing (Co-editing) – Sharing your saved map for collaborative editing.  We call this private sharing and it requires annual subscriptions to MapBusinessOnline for both the initiating map editor and the collaborative editing map user.

Any two annual MapBusinessOnline subscribers can share maps for co-editing. Private sharing allows two or more subscribers to have the privilege of editing a shared map.

The two critical points to remember:

  1. All map editors must be annual subscribers to MapBusinessOnline
  2. You can only have one Editor at a time using the map. Once the editing is complete, save the map and let the next person know it’s their turn

Private Sharing – Allows Editing | Public Sharing – View Only 

Shared editing functionality is not possible with publicly shared interactive web maps.  That process allows shared map viewing only. An allocation of publicly shared view-only map sessions is included with every MapBusinessOnline subscription, at no additional fee.

To share maps for co-editing between two MapBusinessOnline subscribers, the initiating map editor first creates a map and saves it.

Invite the Targeted Shared User to Your Map

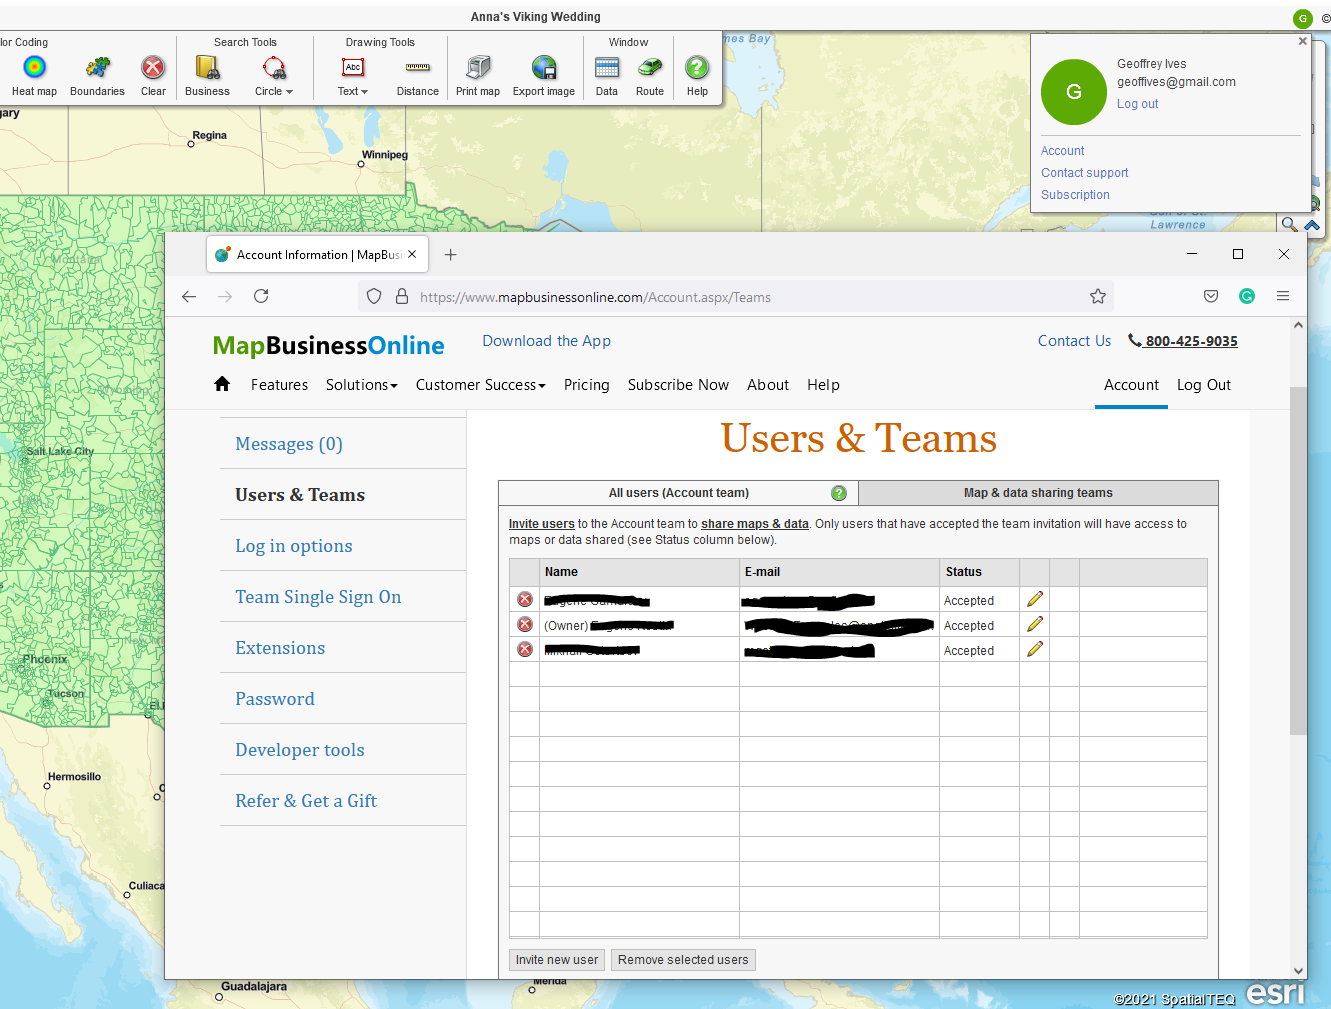
  • To Share a map for editing, a map editor must go to Account, now located in the Green Circle with the user’s first Initial above the upper right-hand corner of the application. Click that Green Circle button.
  • Click Account and select Users and Teams. Under All Users, at the bottom, click Invite User.  Fill in your shared target user name and email, then click Invite User.  Your target co-editor will receive an email from you. From that email they must accept the invitation.

Private Sharing Users & Teams Setup in MapBusinessOnline

  • Once the map creator receives confirmation that the invitation has been accepted. He or she clicks the Share Map button on the Master Tool Bar and chooses Private Sharing
  • In Private Sharing click the Share with Users button
  • Select the target co-editor’s email address, which should now show in the list of users
  • Select the desired role you’d like the shared co-editor user to have – that’s up to you. Options are View Only, Map Editor, Data Editor, or Map and Data Editor.
  • Click Add Selected Users in the lower right
  • Back in the Share Map dialog, click the Apply Sharing Settings button in the lower right

Maps Shared with Me Folder

Now the process moves to the co-editing target user’s Map Business Online application.

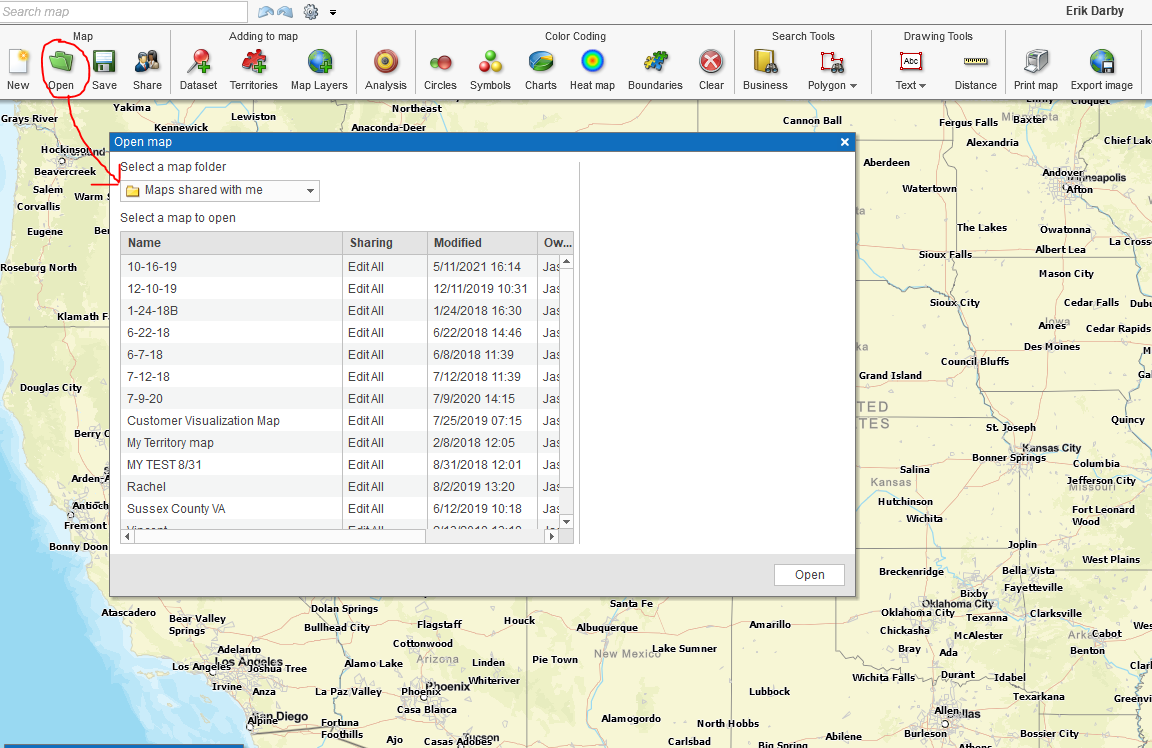
  • The receiving MapBusinessOnline user, targeted to co-edit the shared map, clicks the Open Maps file folder button on the Maser Toolbar
  • In the drop down choose Map Shared with Me
  • Choose the map shared with you by the initiating map editor
  • Proceed to edit the map – save  the map when changes are complete

Maps Shared with Me Folder

Substantial Therapies

Solicit feedback with shared editing

Team Co-Editing

MapBusinessOnline also offers Team Subscriptions starting at quantity five. These team subscriptions offer a quantity discount and provide administrative tools for setting up groups of co-editing users.

Team subscriptions require a designated Team Administrator to manage the subscription and the groups of co-editors. Sometimes the admin and the user are two different people, but usually the same person manages team and the subscription.

Once purchased, the Team Administrator sets up the protocol for their team’s MapBusinessOnline experience. The administrator must manage the following tasks:

  • Sharing the subscription with the individual members of the team. Tools to do this are located in the MapBusinessOnline Account section of the application. Click Account and find the listed menu item – Users & Teams
  • Once subscriptions have been confirmed the Administrator configures Users and Teams for sharing
  • Maintenance of teams and users – deletions, additions, and adjusted controls
  • Subscription renewal notices will be sent to Team Administrators

Co-Editing User Allowances

Team members sharing a MapBusinessOnline subscription have full MapBusinessOnline functionality to create and manage their own maps. Maps that are shared for co-editing with team members include access privileges which are controlled by Team Administrators and Map Creators. Co-editing user privileges include the ability to edit maps, edit data, edit both maps and data, or be set up as view-only.

View-only makes sense for Teams that require private sharing and full subscription features, but may need to limit data access.

Suggested Use of Shared Maps

Maps created for informational purposes like call center support, ZIP code look ups, sales territory sharing, and website location maps should utilize public map sharing, view-only maps. No map editing is allowed for these map viewers.

Maps used for group problem solving, cross-department operational planning, hands-on sales management, and other strategic applications may do better with private map sharing, shared map editing privileges.

Maps are for sharing and communicating, which is why businesses should be aware of how they are sharing maps. Know when your work demands privately shared map co-editing, or when public view only maps could be more appropriate.

Maintain Cyber Security at All Times

Your imported data is your data. It is important that you and your users know what data is allowed to be imported and what data is not allowed. Never import private information to a web application. Do not import social security information, bank accounts, credit card information, or patient healthcare information. Your imported data is your responsibility.  If you have questions about your data and privacy see your data manager or your boss.

_______________________________________________

Find out why over 25,000 business users log into www.MapBusinessOnline.com for their business mapping software and advanced sales territory mapping solution. The best replacement for Microsoft MapPoint happens to be the most affordable.

To access MapBusinessOnline, please register and then download the Map App from the website – https://www.mapbusinessonline.com/App-Download.aspx.

After installing the Map App, the MapBusinessOnline launch button will be in the Windows’ Start Menu or Mac Application folder. Find the MapBusinessOnline folder in the Start Menu scrollbar. Click the folder’s dropdown arrow and choose the MapBusinessOnline option.

The Map App includes the Map Viewer app for free non-subscriber map sharing.

Please read customer reviews and review us at Capterra, or g2crowd

Contact: Geoffrey Ives geoffives@spatialteq.com or Jason Henderson jhenderson@spatialteq.com
Posted in Business Mapping Software blog post, How to instruction | Tagged , , , | Leave a comment

How Can Business Mapping Help Solve Business Problems?


Online business mapping software looks kind of interesting, but I’m not sure if it would benefit my business.”

Clearly, those of you thinking these ‘interested only’ thoughts haven’t solved all your business problems using traditional methods. Traditional methods involve the usual seat-of-our-pants approaches most businesses I’m familiar with use including, Excel spreadsheets, endless speculation & mansplaining, and SWAG.

Spreadsheets are a Godsend, without a doubt. But spreadsheets only tell part of the story. Spreadsheets may let you know if your business is in the black or in the red. They may indicate that things are trending better or trending worse. But spreadsheets can’t show spatial patterns or demographic trends by area, absorbed at a glance. For example, spreadsheets can’t show the relationship between crime patterns and an address, or a pandemic spread by county over time.

Maps transform spreadsheets into map visualizations of customers, sales histories, and progress towards company goals. Maps turn a compilation of data records into visualizations that drive actions. Business maps display business over an area and over a duration.

A great example is sales territory mapping. I’m sure some companies track sales territories by spreadsheet. “Adam has these ZIP codes in his territory,” Said Ethel. But that list of ZIP codes doesn’t help Adam decide which account to visit this week. A business map could inform Adam which accounts to see based on a color-coded symbol indicating overdue visits. It can even suggest additional stops for prospects or legacy accounts that can fill in for cancelations. Maps drive actions.

A Territory Map Using MapBusinessOnline

Maps Solving Problems

A spreadsheet is just a list of customers. Even a CRM is still only a database, albeit a fancy one.  Business mapping software converts that customer address list into an awareness of where all your best customers exist. A map creator can augment that awareness to include other important facts or characteristics about your customers like:

  • Median income levels in their ZIP code
  • Population levels by age, gender, or household in their immediate area
  • Business resources within 25 miles of their home address
  • Crime records
  • Donation histories
  • COVID-19 recovery statistics
  • The number of cats owned over a lifetime (well, that data should be out there)

Solving business problems takes time. Sometimes that time can stretch into years. Geographic and demographic map perspectives, provided by business mapping tools, present a new view of old problems. Moreover, new perspectives tend to generate new ideas.

Not all business problems are sales-related. Sure, business mapping can show where sales are happening and NOT happening, but what other solutions do business maps provide?

Because maps represent spatial reality, they can provide unique perspectives on operational activity. Maps have a habit of pointing out the obvious, such as the most efficient driving directions from point A to point B, but via points, C, D, and E. These efficient routes are called optimized routes. Optimized routes can help solve traveling sales problems like workload balancing and customer retention issues. Driving efficient routes saves time and money.

Law enforcement pros use business maps to clarify events. For example, crime maps provide a geographic view of repeat offenses where the offender is still at large. In addition, a crime map tends to narrow down the likely perpetrator list because it connects criminal acts with home or work locations. So often, crime maps indicate clusters of crimes within an area, and some other clue points to a suspect’s home location within driving or walking distance of the cluster.

Crime Map Using MapBusinessOnline

Getting the Word Out

Every business must work diligently at getting its marketing messages across to their existing and potential customers. Today, marketing messages must travel across multiple mediums. Online mediums and ‘old school’ mediums compete to attract eyeballs and bend ears towards a finely tuned marketing message.

Business maps help organize marketing campaigns. They provide a platform for recording the placement of marketing messages and tracking each campaign’s effectiveness . MapBusinessOnline has customers using business mapping to monitor the following types of marketing campaigns:

  • Advertising flyers inserted in local and regional newspapers. Ads are placed based on demographic characteristics of urban area ZIP codes. Campaign results tracked by matching coupon redemption to purchases by ZIP code
  • Retail stores design sales promotions focused on specific populations sorted by ethnicity, age group, or income level. Stores sort mailed marketing pieces various ways that can then be monitored to reflect which offers were most successful by demographic category or area
  • Billboards are old school as hell, but they work. Business maps track billboard placements and monitor campaign deadlines for ad change-outs. Effectiveness is tracked by billboard calls-to-action, but that may be a little sketchy. Keep those hands on the wheel!

Map-based Market Analysis

Sometimes the business problems we undergo require analysis:

  • Strategic problems – How will we expand our core market to assure business viability over the next ten years?
  • Logistical problems – Where should we locate our next transportation hub to support our new customers west of the Mississippi?
  • Financial problems – Profit margins for core products in the Northeast have been significantly lowered due to competition. Do we consolidate and downsize or find more profitable areas and expand?

For example, MapBusinessOnline market analysis suggests the most lucrative growth areas identifying core customer demographics by region. With existing demographic drivers identified, vital demographic characteristics can be revealed in untapped regions of the nation, solving one part of the ‘where to grow’ strategic puzzle.

For example, MapBusinessOnline market analysis suggests the most lucrative areas of growth through the identification of core customer demographics by region. Once existing demographic drivers are identified, key demographic characteristics can be revealed in untapped areas of the nation, solving one part of the ‘where to grow’ strategic puzzle.

A free trial of MapBusinessOnline is available – no credit card required. You can access the help documentation, blog articles and get Chat, e-mail, and Phone support, to build your first business map. Once onboard, you are well on your way to using map-based business analysis to help solve your business problems.

Sign up for MapBusinessOnline today and get geographicized, or locationated, or spatially woke.  Or just sign up and start mapping.

_______________________________________________

Find out why over 25,000 business users log into www.MapBusinessOnline.com for their business mapping software and advanced sales territory mapping solution. The best replacement for Microsoft MapPoint happens to be the most affordable.

To access MapBusinessOnline, please register and then download the Map App from the website – https://www.mapbusinessonline.com/App-Download.aspx.

After installing the Map App, the MapBusinessOnline launch button will be in the Windows’ Start Menu or Mac Application folder. Find the MapBusinessOnline folder in the Start Menu scrollbar. Click the folder’s dropdown arrow and choose the MapBusinessOnline option.

The Map App includes the Map Viewer app for free non-subscriber map sharing.

Please read customer reviews or review us at Capterra, or g2crowd

Contact: Geoffrey Ives geoffives@spatialteq.com or Jason Henderson jhenderson@spatialteq.com

Posted in Business Mapping Software blog post, Sales and marketing | Tagged , , , | Leave a comment