How Do I Create my First ZIP Code Map?

Many first-time users land on MapBusinessOnline because they looked up the search phrase “ZIP code map,” or something relatively close to that phrase. Typically, these new users have a spreadsheet or a basic list of ZIP codes and they want these ZIP codes highlighted on a map.

MapBusinessOnline can quickly achieve your ZIP code map and more. But let’s not get ahead of ourselves. If you’re new to business mapping and you’ve got a list of ZIP codes, this is how you import them.

Read More About ZIP Code Maps

Tweak Your Spreadsheet

Give your spreadsheet a little tender loving care. Look at your list in Excel or some other database tool. Make sure you don’t have any superfluous notes on your spreadsheet – just headers and data. Put a heading on your ZIP code column. Maybe call it, “ZIP Codes.” You choose. If you don’t add header rows the application uses the first row as a header and you lose those data records.

Feel free to add other related data if you have any – a column for territory names, sales data, or the number of ATM machines per ZIP code. Whatever data is most relevant to your business.  All that extra data comes along for the ride and may be useful to you in MapBusinessOnline.

Import Your ZIP Code Data

With your spreadsheet cleaned up and any relevant data included, you’re ready to begin the import process.

  1. To directly color code ZIP codes areas choose the Create Territories button on the master toolbar – six buttons in from the left. Use this button even though you may not feel you are creating territories. Go ahead and click the Create Territories button
  2. Click next through the spreadsheet example
  3. Select the top options and browse to your data location on your desktop/laptop. Select your data and then select the sheet in your spreadsheet you want to base the map on. Click Next
  4. Review your data column selections in the geocoding drop-downs. All you need is to make sure your ZIP column is being pulled by the ZIP drop-down
  5. Click Next to Creating Territories. Make sure to select ZIP 5 code both as your Territory Name and as the Create Territories By option. Click Create Territories

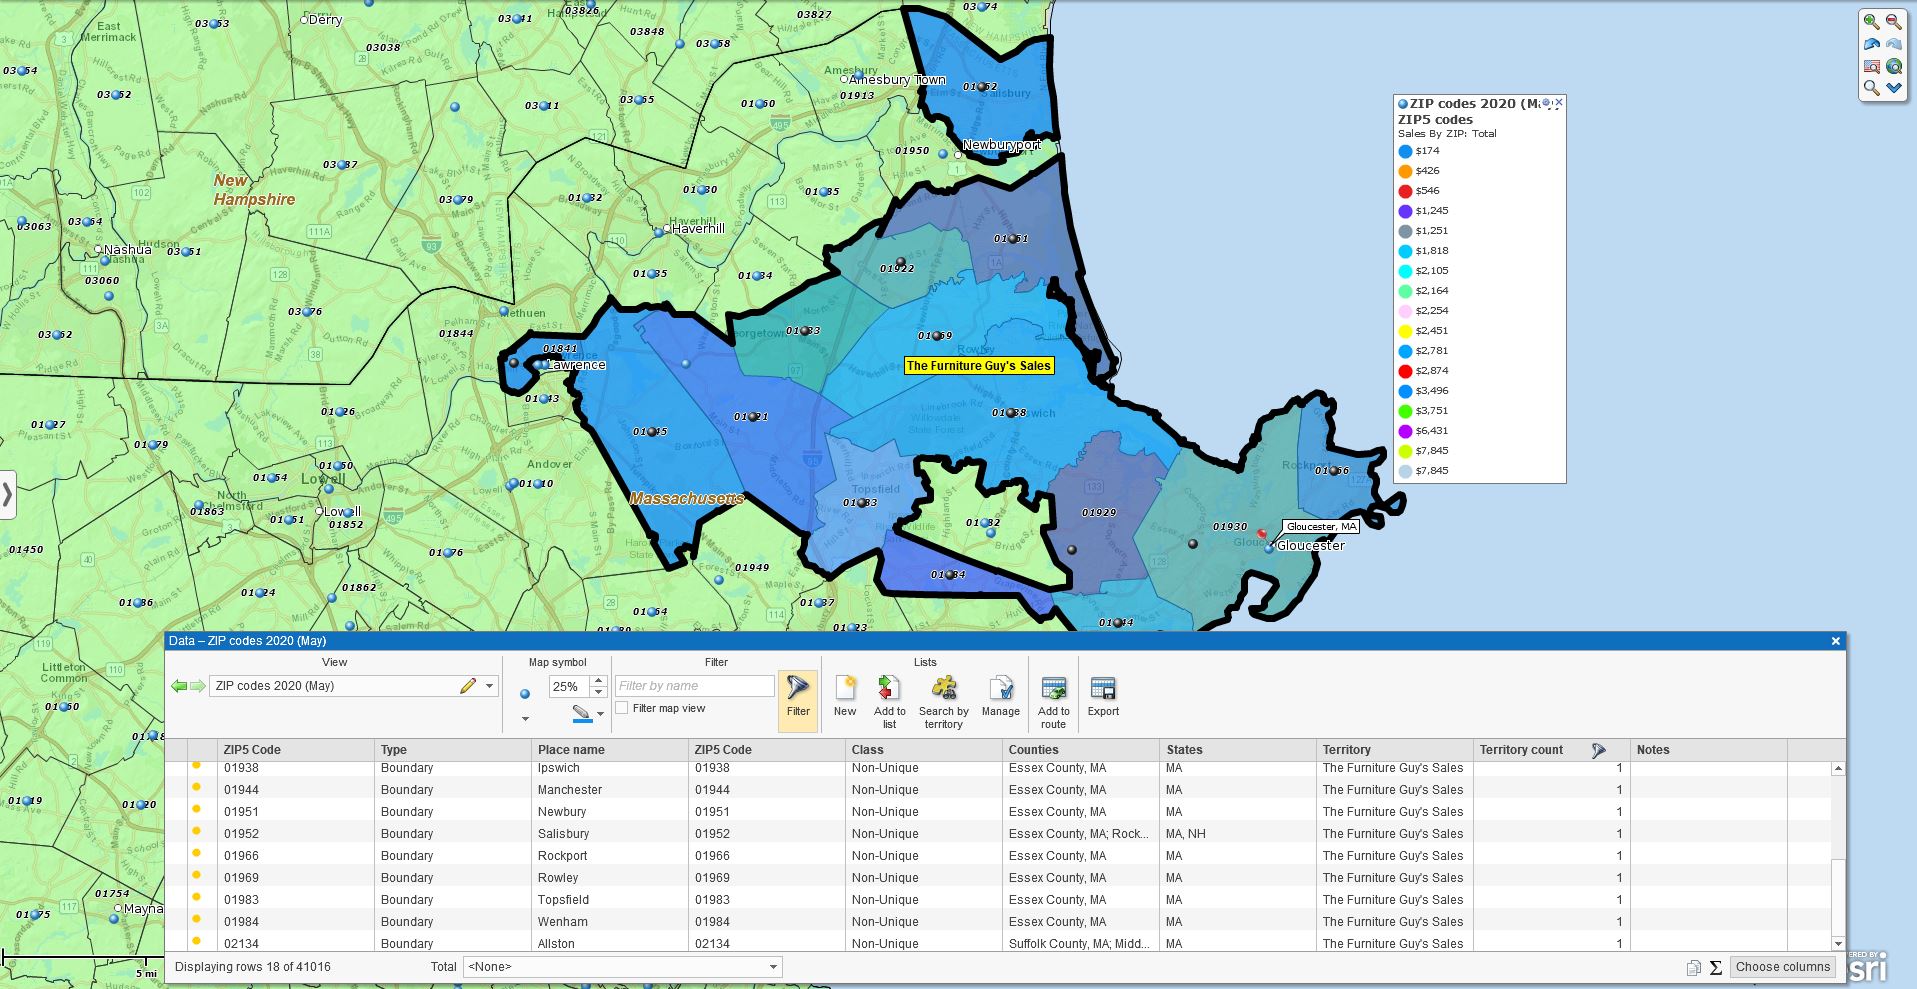
Now you should see your ZIP codes color coded on the map with labels displayed for each ZIP code.  Hover over the Territory layer in Map & Data and click the Edit Gear to turn off the labels, or to re-color code by Demographic Data.

There are more things you can do with your data uploaded:

  • You can adjust the transparency bar in Map & Data on the ZIP code layer making those ZIPs a little see-through, so you can see the map data through them
  • You can pull from your imported data and append up to five flexible label fields underneath your ZIP code label
  • You can add demographic data to your ZIP code labels
  • Add other dataset fields you’ve imported to your labeling options
  • Color code your imported ZIP code data by Demographic Data category

ZIP Code Maps  are a popular basic map for projecting your business location data onto a business map for new perspectives. Another approach to ZIP code mapping is heat mapping. Read more about Heat Mapping here.

_______________________________________________

Find out why over 25,000 business users log into www.MapBusinessOnline.com for their business mapping software and advanced sales territory mapping solution. The best replacement for Microsoft MapPoint happens to be the most affordable.

To access MapBusinessOnline, please register and then download the Map App from the website – https://www.mapbusinessonline.com/App-Download.aspx.

After installing the Map App, the MapBusinessOnline launch button will be in the Windows’ Start Menu or Mac Application folder. Find the MapBusinessOnline folder in the Start Menu scrollbar. Click the folder’s dropdown arrow and choose the MapBusinessOnline option.

The Map App includes the Map Viewer app for free non-subscriber map sharing.

Please read customer reviews or review us at Capterra, or g2crowd

Contact: Geoffrey Ives geoffives@spatialteq.com or Jason Henderson jhenderson@spatialteq.com

Posted in Business Mapping Software blog post, How to instruction | Tagged , , | Leave a comment

Let’s Create Two Quick Demographic Maps of the USA

Let’s build a demographic map of the USA. This process is fast and easy and should help you understand how to create your own demographic maps  using business mapping software.

The first step, Click the New Map button and select the USA map template.

I’m going to walk through a variety of Demographic subjects with a basic map set-up. By set-up, I mean the visual layers turned on to make the map quickly understood and easy on the eyes. Those set-up options are:

  • We’ll stick with a contiguous USA-wide view by County map layer. The County layer is checked on in Map and Data
  • We’ll have the State layer checked on with labels and fill turned off. I have darkened the state boundary. Read more about editing map look and feel
  • I’m completely turning off the background map data so the user can focus on demographic analysis. Remember that – you don’t always require a background map

MapBusinessOnline Demographic Subjects

MapBusinessOnline sources demographic data from the US Census Bureau’s American Community Survey program (ACS).  The Census Bureau begins releasing the data from a decennial count six months to two years after the count takes place.  Updates are released a few times a year after that until the next official decennial count takes place.

MapBusinessOnline incorporates those Census Bureau ACS releases into our software offering as soon as possible, depending on our planned development cycle. If you’ve paid attention to the Census news over the past two years, you can see how politics gets in the way of on-time Census data updates.

Customers sometimes inquire about differences between MapBusinessOnline Census data results and other third-party demographic sources they’ve used. Census data comparisons are often inaccurate. It can be difficult to achieve accurate apples-to-apples comparisons. Here are some critical criteria to consider:

  • What is the data source? MapBusinessOnline uses the American Community Survey’s most recent release. That is not the only source available.
  • What year and release data are you comparing? The MapBusinessOnline Census data is listed by year. The two most recent years are projections. The third most recent year (currently 2018) is the most recent ACS release
  • What area on the map are you querying? Different mapping applications may vary in how they compile Census data by spatial query. For instance, ZIP5-Codes may not precisely match Census ZTCA ZIP code areas
  • Your assumption on data trends from year-to-year or around category population shifts may be inaccurate. Local issues we’re not aware of impact demographic estimates. So an unexplained uptick in one city’s population may be explainable

Remember, Census releases and demographic services are always providing an estimate of demographic reality. Do not expect exactitude when it comes to demographic data analysis. It’s not like Census people can get everybody’s attention and scream, “People! People! Will everyone please sit down so we can count you?”

Demographic Data Categories in MapBusinessOnline

Now let’s create a demographic map.

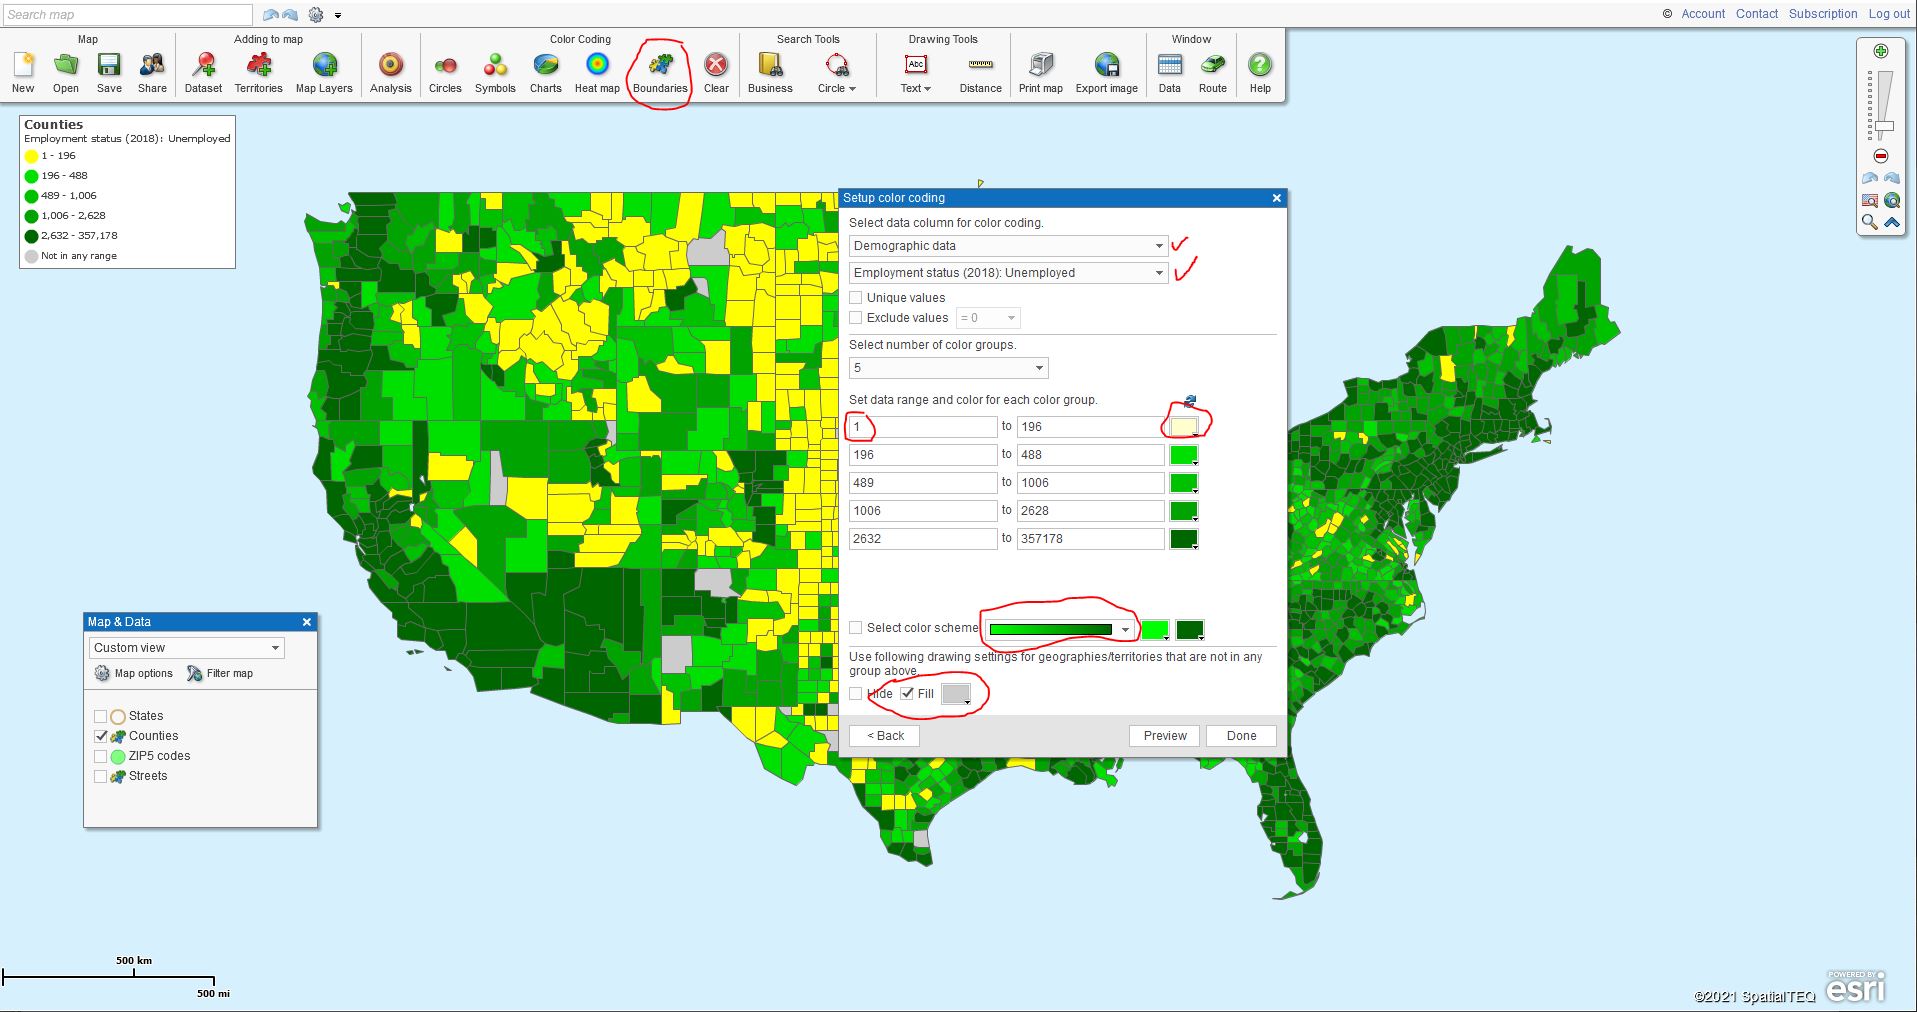
With a full USA map, select the Color-coding by Boundaries button on the Master Toolbar. Select the Counties map layer and click next. For this blog, we’re sticking with Counties. You have many map layer choices – ZIP codes, City Limits, and more.

At the Setup Color Coding dialogue page, in the top dropdown select Demographic Data. In the following dropdown scroll down to the 2018 Census release section, find and select Employment Status (2018): Unemployed.

Leave the number of color groups, or ranges, displayed in the dialogue at 5.  You could color-code and symbolize up to 100 groups. Who wants that?

  • Let the MapBusinessOnline Numeric Range default control the color group’s numeric values.
  • Beneath the color box section, select the Green Color Scheme by dropping down to that option
  • In the top group, the lowest numeric range, click into the color-box and make the color a pale yellow, and set the lowest quantity numeric value to 1 instead of 0
  • The other boxes should all be a shade of gradually darkening green. If they are not, simply Dropdown on the color scheme options and select graduated green as your choice, and then reset that lowest color range to pale yellow
  • In the final step, select a gray color for the Not in any Group color group – make sure to check Fill.  Now click Done

In this first slide, I’ve circled in Red the key elements listed above.

Demographic Mapping Set-up in MapBusinessOnline

Demographic Map using ‘2018 Employment Data’ in MapBusinessOnline

View the demographic map for a minute. Notice how the Yellow areas nicely reflect the least unemployed counties. In this map, that lowest ’employed’ rate could be the most important color group, depending on your map’s purpose. So, it’s nice to make the layer your want to emphasize more obvious. Here we made that color group stand out with a pale yellow.

Notice also how the gray gently displays counties with no data. The gray counties are sparsely populated areas that Zombies have taken over. Zombies are always color-shaded gray in business mapping.

Find the Map Legend. Drag the legend box to the area above New York state, which offers a perfect out-of-the-way legend placement nestled between Michigan and Maine. Click the Legend Edit Gear in the upper right corner and uncheck the State layer.  It’s not necessary and clutters your legend. Always place your map legend where it doesn’t impede map viewing yet remains a prominent information source.

If you view the map and drink in the data, you will see the darker greens reflecting more unemployment in 2018. You should be able to see the county boundaries. You can adjust the boundary layer in Map and Data to be more noticeable. You might make it a lighter color to stand out against the predominantly dark green color. That’s a personal preference mapping decision.

Where Are All the Old Hispanics?

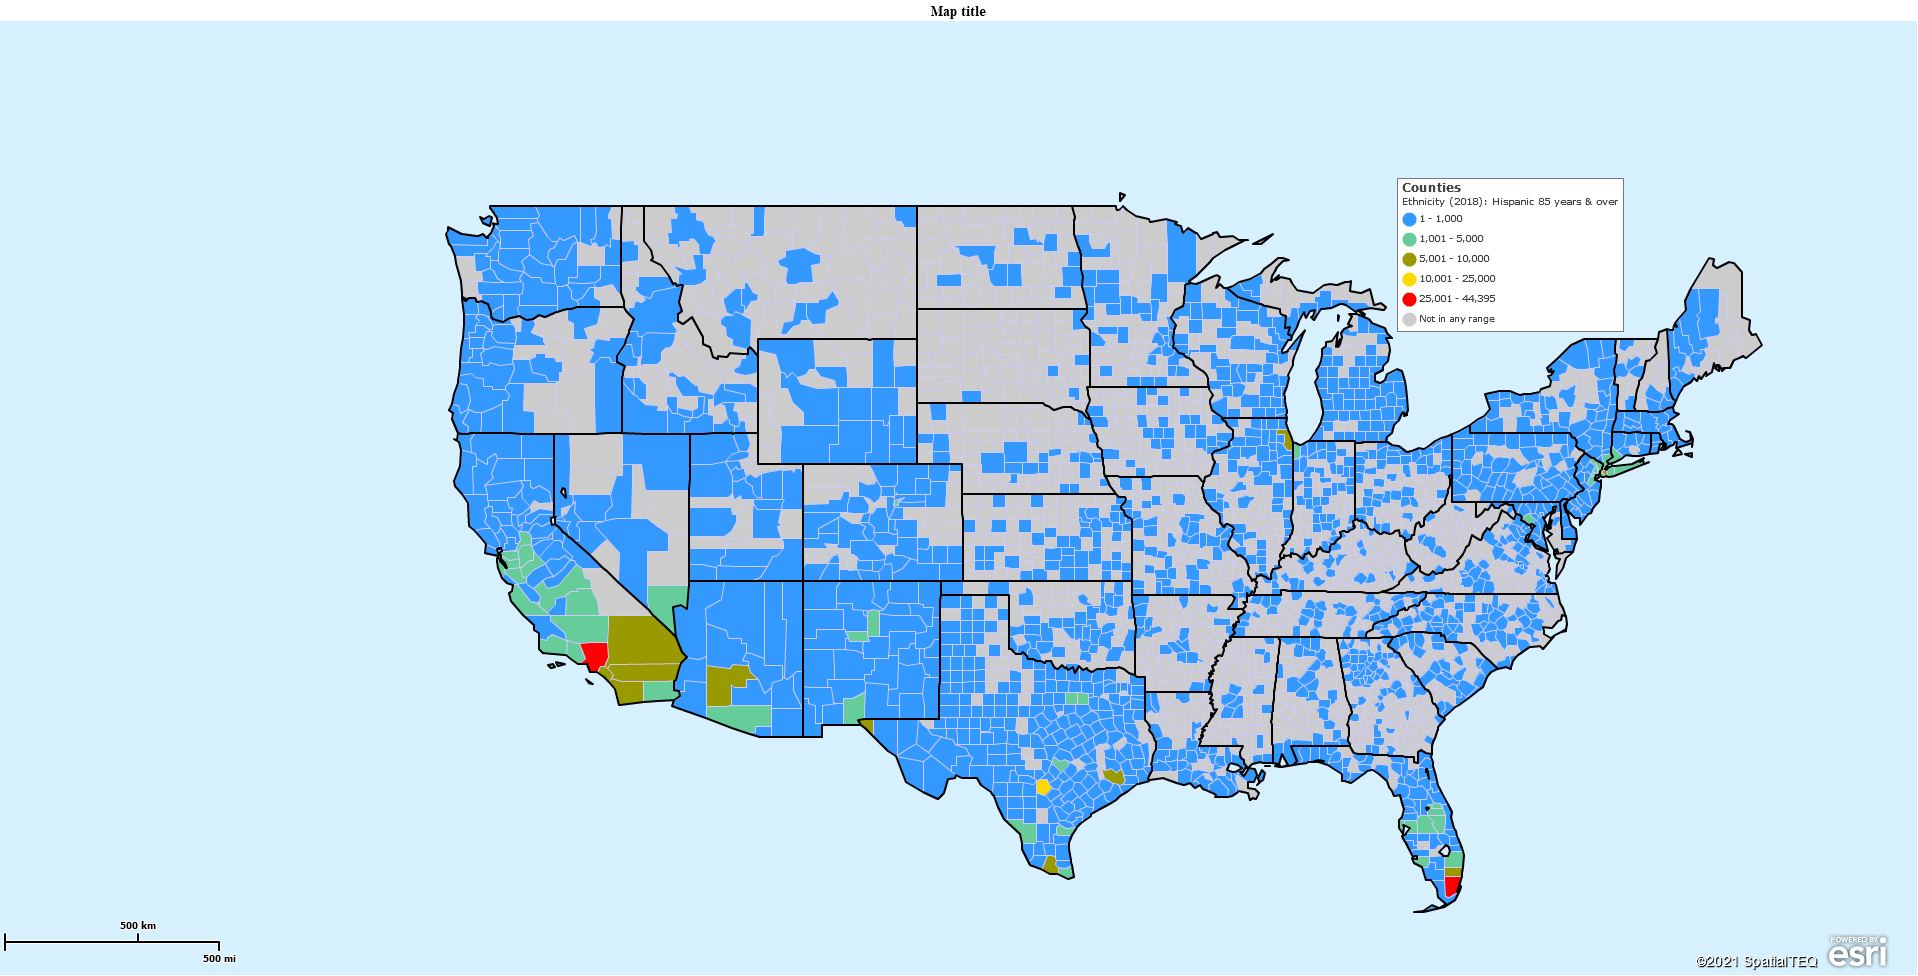
Funny you should ask. Let’s find out. Using the same map and set-up you ended up with, Dropdown and scroll up to Ethnicity (2018): Hispanic 85 years & over. You’ll see multiple age groups listed, but let’s just select the oldest group of Hispanics.

This time you’ll note that MapBusinessOnline’s suggested range and coloring is whacky. We need to decide what to do for ranges and colors. The bottom-most color group displays the highest numeric value of Hispanics in one county – 45,395. Use that number as a target maximum by county for your color scheme.

Five Color Scheme Spread

  • 1 to 1,000 – Blue
  • 1,001 to 5,000 – Pastel Blue-green
  • 5,001 to 10,000 – Pastel Green
  • 10,001 to 25,000 – Pastel Yellow
  • 25,000 to 45,395 – Bright Red

My selected numeric range above is how I like to manage color groups for general mapping. It’s balanced between sparse population and dense. It covers all numeric options. Be careful not to leave out a numeric segment. I like to number subsequent numeric ranges with the following exact number – 1001 to 5000.  It feels more accurate than starting where you ended – 1000 to 5000.

Color-wise, for this map, I was not too fond of the Green graduated shading.. I choose the multi-color color scheme.  Make sure to check the check box associated with Select Color Scheme. Then adjust your color boxes to reflect what I have noted above. I have bright Red as the color for the most significant number of Older Hispanics. The rest of the colors are simply supportive, and pastel shades make them easy on the eyes.

Process your demographic map color-shading by clicking done.

Review the Hispanic 85 Years and Over map. Although not surprising, I thought it was interesting to see the two red areas – one in Southern California and the other in Miami-Dade county Florida.

I added the Hispanic 85 Years and Over category to my map’s County Custom Labels for fun. Custom Labels in MapBusinessOnline are the pop-up labels that occur when you point to a county (state or ZIP code.)  Here in Maine, in Piscataquis County, there is a quantity of 7, 85-year-old, and older people of Hispanic descent. Good to know.  Piscataquis County Association of Hispanic Americans.

This process gets you familiar with the MapBusinessOnline demographic mapping process. Now you can build your map and search for other ethnicities or economic categories on your own time.

MapBusinessOnline users apply demographic mapping to sales territory analysis, market analysis, political mapping, and strategic planning. The list goes on and on.

Once the pandemic is over, I’m headed up to Piscataquis County to find those old Hispanic citizens and verify the Census count, and apologize for the Rick Roll.

_______________________________________________

Find out why over 25,000 business users log into www.MapBusinessOnline.com for their business mapping software and advanced sales territory mapping solution. The best replacement for Microsoft MapPoint happens to be the most affordable.

To access MapBusinessOnline, please register and then download the Map App from the website – https://www.mapbusinessonline.com/App-Download.aspx.

After installing the Map App, the MapBusinessOnline launch button will be in the Windows’ Start Menu or Mac Application folder. Find the MapBusinessOnline folder in the Start Menu scrollbar. Click the folder’s dropdown arrow and choose the MapBusinessOnline option.

The Map App includes the Map Viewer app for free non-subscriber map sharing.

Please read customer reviews or review us at Capterra, or g2crowd

Contact: Geoffrey Ives geoffives@spatialteq.com or Jason Henderson jhenderson@spatialteq.com
Posted in Business Mapping Software blog post, How to instruction | Tagged , , , , | Leave a comment

4 Industries Accessing the Unlimited Value of Location Data

http://https://www.youtube.com/watch?v=LejqSeYxsZ8

MapBusinessOnline business mapping software lets the subscriber create map analysis, map visualizations, and territories that reflect and evaluate their operations. While MapBusinessOnline mapping tools are crucial to the software’s performance, the service’s real value is the user data overlaid on top of business maps.

A subscriber to cloud-based business mapping software, like MapBusinessOnline, should find and catalog the location data they currently have on hand that may add value to their business mapping projects. I often use the example of customer locations, which are generally easily accessed, but let’s look at other location data and analysis accessed or generated using business mapping tools.

Learn More About Location Data

Distribution Centers

Can a business mapping software support a business that depends on distribution centers to supply regional or national markets? I answer ‘yes’ to that question.

Inventory managers must maintain stock levels with proper turn-and-earn ratios to support a marketplace effectively and profitably.  Market areas are often defined by ZIP codes, counties, or City and Town boundaries.  These market areas of interest require various commercial products to be stored at adequate levels to thrive. Maintaining supply levels is the raison d’etre for a distributorship. (Tish – you spoke French.) It is why distribution centers exist.

Driving time and distance maps can be used to define coverage areas for distribution centers.  Inevitably those coverage areas will be challenged as the customer lists expand over time. Sooner or later, the need for a new distribution center will arise, and business map analysis will reveal:

  • Areas of no coverage
  • Areas with excess inventory
  • Product demand by city or distribution center

Read more about warehousing and storage mapping.

Territory maps and coverage areas will naturally define deliverability polygons – areas where standard deliveries work and places where special delivery accommodations will be necessary. At some point, when enough ‘special’ deliveries occur in a region, additional warehousing will be seriously considered. Alternatively, the better idea may be to move the existing warehouse to a new location. Business maps are used to  determine which path makes the most sense.

Maps can  describe product trials by distribution center, human resource activities by distribution center. or employee home locations by drive time area. A ZIP code demographic profile map could identify the best ZIP codes for hiring warehouse labor.

Assisted Living Facilities

While assisted living facilities are not home care agencies with mobile-medical and caretaker staff, there are still plenty of location elements impacting their operations. Many assisted living facility maps include layers for local resources. Especially as we’ve moved through the Pandemic, local resources are critical to congregate home success or failure.

Local resources for assisted living are eminently map-able:

  • Medical services – hospitals, ambulance, pharmacies, dentists, and other critical care services, must be easily reached. Imported resource datasets help visualize how close resources are. Drive times can be vital to decision processes in an emergency. A review of drive time estimates  to critical resources should be required in calculating emergency response-times
  • Food services – Restaurants, grocery stores, convenience stores, pet stores are essential services. Home delivery services in a COVID world are now crucial to a healthy congregate home. Where are these facilities located? Do they support wearing masks, eating outside, and other safety protocols? What are the tipping requirements? We live in a brave new world, and advice is helpful.
  • Van pick-up and delivery services – Many assisted living facilities struggle with pick-up and delivery requirements for residents. Scheduling is one thing; drive time maps can help define pick-up and drop-off points and monitor route timing. Publishing and monitoring bus locations can be critical to the health of residents who must maintain their regular medical appointments. Business mapping tools can publish maps that reflect an accurate map schedule in the face of a changing world.

In-Home Services – Pet services are a thing. Pool cleaning is a thing. Lawn maintenance is a big thing. Any service must determine how to price out its services. Inner-city dog training services may warrant a higher price point than training in rural service areas. Demographic maps in conjunction with radius or driving distance queries can help to define areas related to pricing.

MapBusinessOnline can be used to define both pricing services and delivery services based on driving time polygons or simple concentric circle maps.  Service pricing levels are sometimes assigned to radius circle doughnuts. In other cases, drive time/distance polygons, covering specific ZIP codes, are used to reflect a delivery price by area. Much depends on the population density and traffic patterns of the coverage area.

Service businesses also use MapBusinessOnline to publish coverage areas or territories.  Field service staff assignments often reflect ZIP codes within a certain proximity to a technician’s start-of-day location. Clear territory assignments lower travel expenses, clarify accountability and generate more facetime with clients.

Manufacturing & Retail

Manufacturing concerns utilize sales territory mapping to establish regional or national sales networks. The power of sales territory mapping helps direct salespeople or manufacturing sales representative firms, whose job it is to find the most appropriate sales channels to market.

Those manufacturing sales channels may demand parts for bigger ticket items. Think automotive or aerospace industries. Or those channels may be retail sales channels that manufacturers from all over the world compete to play in. Think ‘The Mall’ and the myriad of stores surrounding any significant national-chain outlets.

Retailers use business maps too. They use maps for a wide variety of location-based analysis:

  • Define store market areas (territories) by customer drive time tolerance or by local demographic characteristics. Stock and price product accordingly
  • Visualize and track store marketing outreach through newspaper advertisements and insert offers – typically, a marketing campaign tracked by ZIP code response rates
  • Retail store expansion planning maps analyze new store site selection by market demand and competitor placements
  • Retail store site selection maps expose the best locations for new stores
  • Competitor maps reveal where competitive stores exist and where they do not exist

My point is that any industry will use, generate, or require location data. Cloud-based business mapping software can generate, leverage, and expand upon those location datasets in ways that enhance business analysis.

Any business can benefit from business mapping. Innovative businesses leverage business mapping to expand and prosper in an ever more competitive world that never fails to surprise us.

_______________________________________________

Find out why over 25,000 business users log into www.MapBusinessOnline.com for their business mapping software and advanced sales territory mapping solution. The best replacement for Microsoft MapPoint happens to be the most affordable.

To access MapBusinessOnline, please register and then download the Map App from the website – https://www.mapbusinessonline.com/App-Download.aspx.

After installing the Map App, the MapBusinessOnline launch button will be in the Windows’ Start Menu or Mac Application folder. Find the MapBusinessOnline folder in the Start Menu scrollbar. Click the folder’s dropdown arrow and choose the MapBusinessOnline option.

The Map App includes the Map Viewer app for free non-subscriber map sharing.

Please read customer reviews or review us at Capterra, or g2crowd

Contact: Geoffrey Ives geoffives@spatialteq.com or Jason Henderson jhenderson@spatialteq.com

Posted in Business Mapping Software blog post, Sales and marketing | Tagged , , , | 1 Comment

Guidelines for Territory Mapping

Not everyone is born able to create territory maps. Some of us need a little guidance here and there. MapBusinessOnline is a map creation toolkit for businesses of all industry types. Our cloud-based map maker tool is easy-to-learn and even fun for businesspeople who require map visualizations to supplement their business work.

Territory Map Creation

Sales territory mapping is one of the core features of MapBusinessOnline. But like all software processes, there are best practices to follow. Below are some of the recommendations and guidelines surrounding the use of MapBusinessOnline territory mapping software.

Preparing for Territory Mapping

First-time business mapping users should take some time to think about your territory requirements. Read about preparing for sales territory mapping here.

Map Alignment Layer – Give some thought to your map alignment layer. Will your territories be based on States, Counties, ZIP5 Codes, City Limits, or Census Tracts?  Read more about map alignment layers and territory considerations here.

Territory Creation by Polygon vs. Data Import – If you are brand new to business mapping, consider using the Polygon Search Tool to create your territory map. This basic tried and true method gathers ZIP Codes or Counties by lassoing them with a polygon draw tool. You’ll pick up on this process quickly. Collecting territories with a polygon tool gives the user a basic understanding of how to create a map.  For more on territory map creation, read this article.

Lassoing territories is easy. Ensure your map alignment layer of choice is turned on (ZIP code, County, State, etc.) Then click the polygon tool and run that line through the ZIP codes. Every ZIP code your drawn line touches will be included in your territory. Once the line returns to the starting point, the alignment map layer list is presented for selection. Save your territory with a name. Move on to the next territory.

Color-code Territories by Demographic Makeup

Alternatively, users can select individual map layer units, like ZIP codes, with their mouse cursor. Select the first layer unit, hold down the shift key and select as many more as you like. Save as noted above.

Importing Territories from a Spreadsheet – Another method for creating territories is through spreadsheet import.  A ZIP code-based territory spreadsheet should include a Column for name, ZIP code, and columns for what other additional datasets your business may require.

A county-based territory spreadsheet must include a column for state. County names across the United States are not unique. For example, Montgomery County occurs in three states. MapBusinessOnline won’t know what to do with just Montgomery County. It needs a state, or its day is ruined.

The create Territories button is on the Master Tool Bar under the Adding to Map section. That’s the button to use to import territories. Keep in mind you can repeat the process of importing territories into the same map, but if you do your imported layers will show as multiple layers in Map and Data and the Data Window. Beware of accidental or deliberate territory overlap. See the Overlap section below.

Gathering all the territories you can in one territory spreadsheet is more efficient. Adding territories to your territory map can also be achieved by lassoing or incremental unit selection.

One Map Alignment Layer per Territory

A business map user can only apply one map alignment layer per territory. For example, a single territory can be made up of ZIP codes or Counties, but not ZIP and Counties. If, for instance, a user desires to add a territory that is a state section to a State-based territory map, then the territory with the segment of a state must be based on Counties or ZIP codes.

Editing Territories

Editing Territories in MapBusinessOnline is easy. Select any map layer unit, and click the Edit Territory Puzzle Piece icon in the mini-toolbar. Next, choose from the  operations menu.  You’ll see these operation options:

Create new

Add to

Move to

Update

Intersect with

Remove from territory

Remove from all territories except

Once the operation is selected, the user chooses which territory to edit. Read more about editing maps in MapBusinessOnline.

Overlapping Territories

Accommodating territory overlap is a feature in MapBusinessOnline territory mapping tools. In Map and Data, select the Edit Map Layer Properties button for the Territory map layer.

In the Territory Options Tab, select the intersection options listed. Next, click on Edit Territory Options at the bottom of the Territory Options section. Along the right side, make sure you are in the Intersections Tab. Once there, you’ll have some other choices for displaying where overlap exists on your map.  Click the Highlight Territory Overlap checkbox and choose a color to define your territory overlap. Usually, MapBusinessOnline users pick a bright obnoxious color to make overlap obvious.

Map Object Territory Creation

Sometimes business map users are asked to create territories based, not on map alignment layers, but between Highways, Rivers, and Mountains. Map object alignment means the organization bases sales territories on large identifiable objects in real life.

The reason a company might decide to build territories by map object could be due to travel impediments. Highways and rivers can create hard-to-reach areas that make it more efficient for a sales-rep from another location to cover.

MapBusinessOnline accommodates these oddball territory requirements using the Draw Tools. Territory areas will be manually constructed using a Polygon tool or a Line tool. The territories will not include an analysis datasheet view. We recommend using the previously noted Map Alignment Layer method for territory creations. But if you must use the draw tools to create territories, read more here.

Additional Territory Tips

My Territory Labels Disappeared – Hold down the shift key and click the territory. The Shift Click brings the Label back after removal.  You can also Edit Map Layer Properties in Map and Data. Under Labels, click Add All Labels to the map.

Can’t Select ZIP Code or County to Create or Edit Territory – Make sure no filter exists on the territory layer. In Map and Data, edit the properties of the Territory Layer. Under General, make sure Map View Filter reads: None.  If there is a CLEAR button noted, click the clear button to remove the filter.

Incremental Territory Selection – Make sure the target map alignment layer has Fill checked on. Map Objects must have a fill to be selected for a territory.

Recommended Additional Reading

Read more about territory map creation

Append data to labels

Create territories from ZIP code ranges

How to configure drive time-based territories

Building franchise territories with MapBusinessOnline

3 key aspects of territory mapping     

Territory mapping may not be instinctual you, my friend, can learn to be a map geek.

_______________________________________________

Find out why over 25,000 business users log into www.MapBusinessOnline.com for their business mapping software and advanced sales territory mapping solution. The best replacement for Microsoft MapPoint happens to be the most affordable.

To access MapBusinessOnline, please register and then download the Map App from the website – https://www.mapbusinessonline.com/App-Download.aspx.

After installing the Map App, the MapBusinessOnline launch button will be in the Windows’ Start Menu or Mac Application folder. Find the MapBusinessOnline folder in the Start Menu scrollbar. Click the folder’s dropdown arrow and choose the MapBusinessOnline option.

The Map App includes the Map Viewer app for free non-subscriber map sharing.

Please read customer reviews or review us at Capterra, or g2crowd

Contact: Geoffrey Ives geoffives@spatialteq.com or Jason Henderson jhenderson@spatialteq.com
Posted in Business Mapping Software blog post, How to instruction | Tagged , , | Leave a comment

Don’t Try to Solve All Business Problems with One Business Map

One of the most basic yet far-reaching features of a MapBusinessOnline subscription is the ability to save more than one map. A subscriber to MapBusinessOnline Standard can save up to 200 maps. A Pro subscriber can save 500 maps and a Team subscriber up to 400 maps.  Additionally, a user can always delete saved maps, which restores the used map’s slot in the saved map allowance.

You might ask, why is this important? How can a cloud-based business mapping subscription allowing a map user to save up to 200 maps be ‘far-reaching?’ The 200-map allotment per subscription means nobody has to worry about solving all business problems with one map.

There’s no need to be miserly about your map usage.

You smirk. I can see your smile behind your laptop screen. But, the fact of the matter is, many people come to us with a laundry list of issues they want to solve with their business mapping software, and they often expect to solve all these issues with their first business map.

Just last week, a guy called, he’s been in business for years, but he had only recently realized his company could use online business mapping software. He wanted a map that would:

While MapBusinessOnline is more than capable of helping to achieve all of these business mapping goals, I advised the eager mapping beaver to slow down and begin his mapping journey one map at a time.

You do not have to solve all problems with one map.

Start with a Customer Map

Start with a map showing all customer locations.  A good customer location map, seen for the first time, can provide a new perspective on your company’s business. A customer map is a simple import of an address list. In minutes you’ll be looking at your business arena geographically.

MapBusinessOnline Used to Create a Customer Map

Another MapBusinessOnline Create Customer Map

Customer address lists are easy to come by. And please (PLEASE) do not import a ZIP code-only address list. Always build the full address for your customer list to provide more accuracy.  Too many people think that ZIP code lists are good enough. They are not.

Real addresses will spread the points around the map’s area of interest. By using an actual address, you’ll get a realistic view of your geographic customer base. While a ZIP code-only spreadsheet, once imported, will stack multiple customers at ZIP code center points all across your business area of interest. Take the time to get those customer address records corrected in your system.

People work for you.  Make them do it. The data is out there online, and you know it.  At any rate, if you have a CRM, your customer had better be stored in the CRM by full address. Your customer records are stored this way, right? Right?

With a customer map created, start thinking about territories.  Read some of our previous articles about territory creation. Try importing a list of territories by ZIP code or county.  Study your business’s overall coverage area. Think about growth, resources, and employee locations and how they may impact your business.

Save Your Map as a Template

With a customer map in front of you, perhaps on top of territories, you’ve got a good sense of your business’s area of operation. You’ve also got a sense of where you’re next area of growth will be. Save this map as a My Map Template in MapBusinessOnline. Template maps serve multiple purposes:

  • Templates protect your map work. Maps, like spreadsheets and word documents, can be over-written and lost. Protect your investment in time.
  • Templates serve as a jumping-off point for other maps. Your first business map may or may not end up being the map template that saved New York, but through this process, you’ll come to recognize the specific maps that are critical to your business. Many MapBusinessOnline customers use Map Templates once a quarter or once a year to create working maps for their business processes.
  • Map templates might be a place to store maps that are critical legal documents, safe from editing. These legal maps serve as base-line definitions of franchisee maps, real estate deals, and other business matters that could end up in court someday.

Business Hint: If maps are sometimes critical to your business’s legal disputes, make sure you purchase a business mapping license for a person with a map-keepers dedicated role. Keep their license up-to-date and make sure they get proper training on map use, map storage, and online security.

So, as you can see, business maps cover a lot of ground. (Get it?) There’s no need to solve every problem with one business map. Use your first maps as a learning experience. Gradually work your way from customer map to sales territory map and beyond – into strategic maps, competitor maps, and maps that can help find all the good chocolate in the region.

Two-hundred maps takes you a long way. In MapBusinessOnline, you can always delete maps to regain map allowances, and if you really need to, you can contact us to purchase more map storage.

So the key take-ways from this blog are:

  • Don’t try to solve all problems with one map
  • Use map templates
  • Make sure your customer address records are stored as complete addresses
  • I’m not sure what saved New York

_______________________________________________

Find out why over 25,000 business users log into www.MapBusinessOnline.com for their business mapping software and advanced sales territory mapping solution. The best replacement for Microsoft MapPoint happens to be the most affordable.

To access MapBusinessOnline, please register and then download the Map App from the website – https://www.mapbusinessonline.com/App-Download.aspx.

After installing the Map App, the MapBusinessOnline launch button will be in the Windows’ Start Menu or Mac Application folder. Find the MapBusinessOnline folder in the Start Menu scrollbar. Click the folder’s dropdown arrow and choose the MapBusinessOnline option.

The Map App includes the Map Viewer app for free non-subscriber map sharing.

Please read customer reviews or review us at Capterra, or g2crowd

Contact: Geoffrey Ives geoffives@spatialteq.com or Jason Henderson jhenderson@spatialteq.com

Contact: Geoffrey Ives geoffives@spatialteq.com or Jason Henderson jhenderson@spatialteq.com

Posted in Business Mapping Software blog post, How to instruction | Tagged , , , | Leave a comment

3 Key Aspects of Sales Territory Definition – Accountability, Sharing Data, & Franchising

Defining a territory has become somewhat routine for business mapping software users. It’s easy to simply run a polygon search tool across an area of ZIP codes and grab a selection of ZIP codes and call that a territory.

Similarly, it’s easy to import a sales rep’s list of ZIP codes and define that as a territory. But is sales territory creation really that cut and dry?

It isn’t. Territory management is more complicated than selecting a batch of counties and calling it ‘good.’ There are many considerations in today’s complex business world. Here are three aspects of sales territory definition that repeatedly occur for MapBusinessOnline customers:

  1. Defining sales accountability – Who owns what?
  2. Sharing opportunities and information
  3. Franchise Mapping

A territory manager should consider these three elements as they define their sales territory alignment and assignment details.

Read About Business Expansion Using MapBusinessOnline Territory Planning

Accountability – Who Owns What?

Whether your field-staff are salespeople or support technicians, the assignment of sales territories is a process designed to designate accountability by area. For the most part, if your field reps are assigned an area (ZIP code, county, or other), that area is their responsibility. While shared accountability can occur, it should be the exception.

Shared accountability adds confusion to the marketplace and detracts from a salesperson’s ability to achieve goals. This is largely due to human nature. Salespeople are motivated by earnings, and territory sharing dilutes earnings causing resentment and possibly obsession with the other guy’s accounts and activities. Their focus shifts from earnings to backward glances.

Territory maps provide visual lines of demarcation that define an area of responsibility. If a clearly defined area proves to be more than one salesperson can handle, it may be time to create a new territory. Alternatively, it could be time to find a new salesperson. But that decision is for a sales manager to ponder and not for us to kibitz over.

Regardless of how you measure sales success, keeping territories clearly defined helps focus sales efforts on results. Salespeople are motivated by commission, not by sharing commission.

Legacy account possession is one of the most common reasons for overlapping sales. The old-school workhorse sales guy ‘has a relationship with the papermill’s buyer, and we’re not going to disrupt that for the sake of accountability.’ Really? Instead, you’ll assign overlapping sales territories that will pin the old workhouse against the aggressive young upstart and create several years of animosity until someone retires, has an incident, or there’s a murder. Good luck with that.

Change is good. Smart businesspeople survive in the workplace because they adjust as changes occur. Push past legacy relationships and clearly define areas of accountability for each sales representative. Keep commission structures fair. Don’t solve personal problems by territory assignment. Use territory assignments to determine the organization’s one-to-five-year strategic plan. Your competitors will be busy organizing theirs.

Read about the 6 Top Considerations When Creating a Business Map

Map-based territory assignment logic defines where traveling sales reps should focus their time. Those same territories suggest where inside support services should focus their energy.

Sharing Inquiries by Territory

Incoming service chats or phone calls may or may not require face-to-face sales follow-up. However, it’s vital that incoming calls from customers or prospects are shared with the people responsible for those areas. Shared business maps for inside people should replicate the territory segmentation of the outside sales force. Likewise, inside technical support (as opposed to sales support), staff should view the same maps as traveling technicians.

A routine inquiry about a particular electrical fixture might feel like no-big-deal to a helpful inside salesperson. Still, the outside salesperson may be aware of an upcoming project that involves those specific fixtures. Make sure those territory maps are shared across the organization so any inquiry can be logged and directed to the correct salesperson – who is, after all, held accountable for growing sales in that district. Why would you hold a person accountable for sales by region and not make them aware of all activity in the region?

It’s easy to share sales territory maps across a team’s network. Searches by ZIP code and address accommodate fast identification of territory assignments. These shared sales territory maps can also display nearby resource locations, construction sites, repair stations, cell towers – you name it.

Empowered with shared sales territory maps, a sales team can create more effective solutions for customer care. Inquiries can be tracked and ranked by success and failure. Picture a quarterly review of all prospect inquiries ranked by sales value and color-coded by success or failure. The most successful results can then be reviewed for optimized sales growth while failing opportunities become demonstrated dead ends to avoid.

Franchise Territory Maps

Franchise maps are a special-case sales territory map. Franchise businesses often make sales territory maps the cornerstone of their business model. It’s a natural fit. Franchise areas or territories are sold to and owned by franchisees. Territory areas make up a critical component of the sold franchise. Other components might be customers, intellectual property, product access, or service rights. These territories represent the authorized area where a franchisee can do business.

Franchise territories are usually sized based on a critical demographic or measurable business metrics by area. Example metrics would be population by ZIP code, disposable income by ZIP code, product expenditures by county, or a sales metric like cost-of-goods sold in a ZIP code.

ZIP codes are the most applied map alignment layer for franchise maps. Analysis and planning by ZIP codes are convenient and relatable for franchisee managers. In populated urban areas, ZIP code coverage areas are generally the first franchises sold for new franchising businesses.

Counties come in second for franchise map alignment layering. Counties may be more appropriate for more rural franchise selling, for businesses like homecare agencies that must travel far and wide. Such agencies might sell ZIP code franchises in urban areas and County franchises in outlying areas.

Shared franchise maps can display and track available and sold franchise areas. Team subscriptions can be handy for shared map Franchise analysis. A map administrator creates the franchise territory map and color-codes based on the franchise model requirement:

  • Red and green franchise ZIP code areas of one or more ZIP codes display where franchises are still available or sold
  • Franchise maps include critical demographic or business metrics that define the most lucrative areas
  • Market analysis maps help investigate and plan business expansion for both franchisers and future franchisees

Franchise mapping is a bit of a no-brainer. One of our happy customers once exclaimed, “Maps sell franchises!” And we agree.

Dreaming up new territory schemes for an existing business or a new venture can be both intimidating and exhilarating. But for those wary of stepping off the ledge, you will generally be choosing between ZIP codes and counties for your territory alignment layer.

Think about who will use the territory assignments to gauge metrics, estimate commissions, or communicate opportunities. Avoid overlapping areas and include all the relevant business location and demographic data you can get your hands on. Start there, and your business territory map will follow in short order.

_______________________________________________

Find out why over 25,000 business users log into www.MapBusinessOnline.com for their business mapping software and advanced sales territory mapping solution. The best replacement for Microsoft MapPoint happens to be the most affordable.

To access MapBusinessOnline, please register and then download the Map App from the website – https://www.mapbusinessonline.com/App-Download.aspx.

After installing the Map App, the MapBusinessOnline launch button will be in the Windows’ Start Menu or Mac Application folder. Find the MapBusinessOnline folder in the Start Menu scrollbar. Click the folder’s dropdown arrow and choose the MapBusinessOnline option.

The Map App includes the Map Viewer app for free non-subscriber map sharing.

Please read customer reviews or review us at Capterra, or g2crowd

Contact: Geoffrey Ives geoffives@spatialteq.com or Jason Henderson jhenderson@spatialteq.com
Posted in Business Mapping Software blog post, Sales and marketing | Tagged , , | Leave a comment

Measurement Tools in MapBusinessOnline

MapBusinessOnline is a business map designed to support organizations with map visualizations that depict aspects of their work, such as:

  • ATM and vending machine placements
  • Billboard placements
  • Construction site placements
  • Customer locations
  • Delivery and pick-up ranges
  • Infrastructure maps
  • Insurance coverage areas
  • Investment zones
  • Significant field resources – such as fuel stops, hospitals, repair locations
  • Market analysis areas
  • Retail store market areas
  • Sales territories
  • Service coverage areas
  • Staff placements in the field

Measuring on Your Map

The above list represents some real examples of business mapping applications. I could go on. I’m always surprised by the variety of applications our user-base finds for MapBusinessOnline.

Measuring can sometimes be necessary for a basic business map. In business mapping, there is more than one way to measure. In fact, in MapBusinessOnline, there are three or four ways that measure up.

MapBusinessOnline has Business Listings – Read More Here

The Line Measure Tool

MapBusinessOnline includes the ability to draw a line that measures distances. The Distance Measure Tool is located on the Master Toolbar under Drawing Tools, left middle of the toolbar.

By clicking on the Measure tool, a user activates the line measure function; the button will highlight in Yellow. Once engaged, the cursor is placed on the map, held down, and dragged in the desired direction. The line will display a distance in miles or kilometers. Turns are inserted by lifting your cursor and then continuing in a new direction.

To measure curves, repeat the mouse click as you drag and make the turn.  Turning can take a little practice.

Go ahead and try drawing a measure tool line on your business map.  It’s easy to delete the line and start again. Get a sense of how the measure distance tool works.

Settings for feet or line measurement units are stored in Map and Data. Click the Map Options button on the short Map and Data toolbar. In the panel that opens, you’ll find a section in the middle for Units of Measure. Adjust, as necessary, between miles and kilometers.

Once your line is complete and accepted, there is a properties button with the Measure Distance tool. Select the measured distance line to activate the Properties Gear. Click the Properties button to adjust the following:

  • Select from line-segments options (line only, arrow, double arrow)
  • Adjust the width of line-segments
  • Adjust the color of lines
  • Control the text labels associated with any line

When using standard Draw Tools (button to the left of the Distance tool), the straight and curved lines display distances as drawn. But those distance measures disappear after the drawn object is complete, so the resultant map object is clean.

The distance measure tool is excellent for defining distances on a map.  A free form Draw Tool is a good solution for a quick measure of a curved line. The Distance Measure Tool is useful for posting the distance of that curved line on the map.

Routing as a Measure Tool

MapBusinessOnline includes an optimized routing tool. A user can specify stops one-by-one through the Address Bar or import a list of address stops for one-button route creation in the Data Window.  Up to 150 stops are allowed per route, so the Data Window views of imported address lists may need to be filtered to enable the one-step Add to Route button on the Data Window toolbar. Read more about optimized routing.

But, once you’ve selected yours stops and processed a route, you will find, in the lower left of the Route presentation, the total distance and time duration expected for the queried journey. This calculation is like a Drive Time query, except it is focused on the specific stops used to calculate that particular route. Read more about Drive Time queries.

Driving time and driving distance queries are route measurements in all directions. In the Draw Tools, a user selects the Drive Time draw tool option, places a point on the map and, inputs a desired driving time or distance. The query results show the resultant polygon for that distance or time in all  directions.

Driving times or distances can be used to define delivery Zones.

One of my favorite map visualizations

Speaking of driving time and driving distance queries, MapBusinessOnline Pro can calculate multiple distance measurements as an array between two datasets. These are advanced queries but could be considered measurement tools. To explore this further, read more about generate multiple driving time and driving distance results using MapBusinessOnline Pro – here.

Measuring Square Miles

Another convenient measuring tool is the ability to quickly derive the total area in square miles or square kilometers associated with any map object. A map object could be a ZIP code, a polygon, a circle, or any other shape drawn on the map.

To measure the area in square miles or square kilometers of a map object:

  1. Draw and/or select the map object on the map
  2. When selected, the map object is highlighted, and the mini-toolbar displays. Click the Summary Button on the mini-toolbar
  3. Scroll down through the entire demographic library of categories. At the bottom, you will see two options for area calculations – one for Square miles and one for Square Kilometers. Choose your preference
  4. The map object area will display in a data report which, you can export or choose to display on the map

The area’s Square Mile text box also has a properties edit gear. You can choose the size, color, orientation, and italics for the text.

Totaling Data Columns

Another measurement option within MapBusinessOnline is the ability to total a column of data. In the Data Window view, any data column containing numeric values may be totaled. The Total Function is at the bottom of the Data Window. It reflects the sum of all values in a column across the geographic subject.

For instance, if a territory dataset had included a demographic category for Population 2020, the user, could move their cursor to the bottom of the Data Window and, in the box labeled Total, dropdown to the column of interest and select it.  The total population for the territory would show in the Total display.

MapBusinessOnline Pro let’s you add driving distances to an imported address list. You could use this Totaling option in the Data Window to total the entire column of distances. There could be value in seeing, for example, the total value of driven miles by a clinician team.

The ability to measure distance and area is useful for estimating project costs, work hours, and developing capacity plans. Just another way in which online business mapping tools help us all to get the job done.

_______________________________________________

Find out why over 25,000 business users log into www.MapBusinessOnline.com for their business mapping software and advanced sales territory mapping solution. The best replacement for Microsoft MapPoint happens to be the most affordable.

To access MapBusinessOnline, please register and then download the Map App from the website – https://www.mapbusinessonline.com/App-Download.aspx.

After installing the Map App, the MapBusinessOnline launch button will be in the Windows’ Start Menu or Mac Application folder. Find the MapBusinessOnline folder in the Start Menu scrollbar. Click the folder’s dropdown arrow and choose the MapBusinessOnline option.

The Map App includes the Map Viewer app for free non-subscriber map sharing.

Please read customer reviews or review us at Capterra, or g2crowd

Contact: Geoffrey Ives geoffives@spatialteq.com or Jason Henderson jhenderson@spatialteq.com
Posted in Business Mapping Software blog post, How to instruction | Tagged , , , | Leave a comment

A Word About Territory Mapping

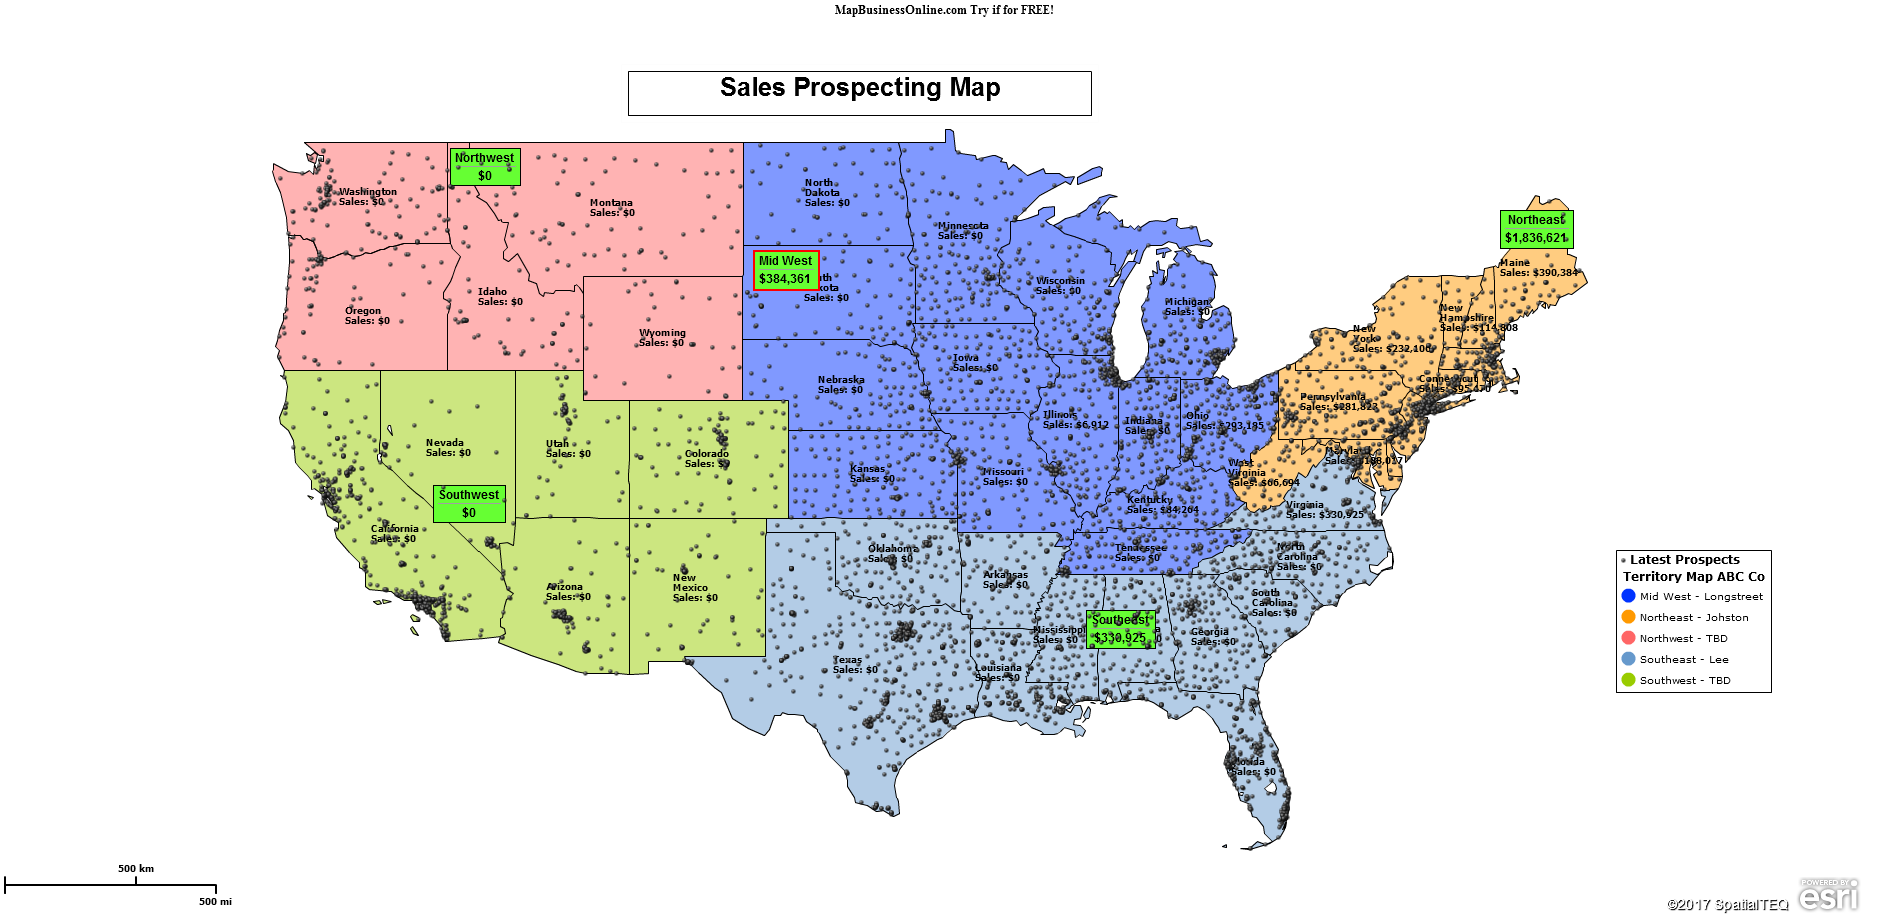
The most common application of territory mapping, a feature of MapBusinessOnline, is sales territory mapping. Territory mapping is sales territory mapping for 90% of the MapBusinessOnline user base. The application of sales territories is common and wrestles with the same challenges other territory applications wrestle with namely these six tasks:

  • Defining accountability
  • Managing areas of overlap
  • Controlling travel expenses
  • Clearly communicating company goals and objectives
  • Tracking progress against goals
  • Organizing outside travel tiers

The value of sales territory mapping is linked directly to financial results. Sales results are often tracked, posted, and compensated for a given period through sales territory mapping. Expense reporting is also tracked against territory results. Sales trip and expense reporting usually include the submittal of travel receipts, mileage reports, airline stubs, brief write-ups of contacts made, negotiated contracts, and purchase orders.  Sales territories organize the various sales pieces over a shared geographic coverage area.

Read More About Sales Territory Mapping

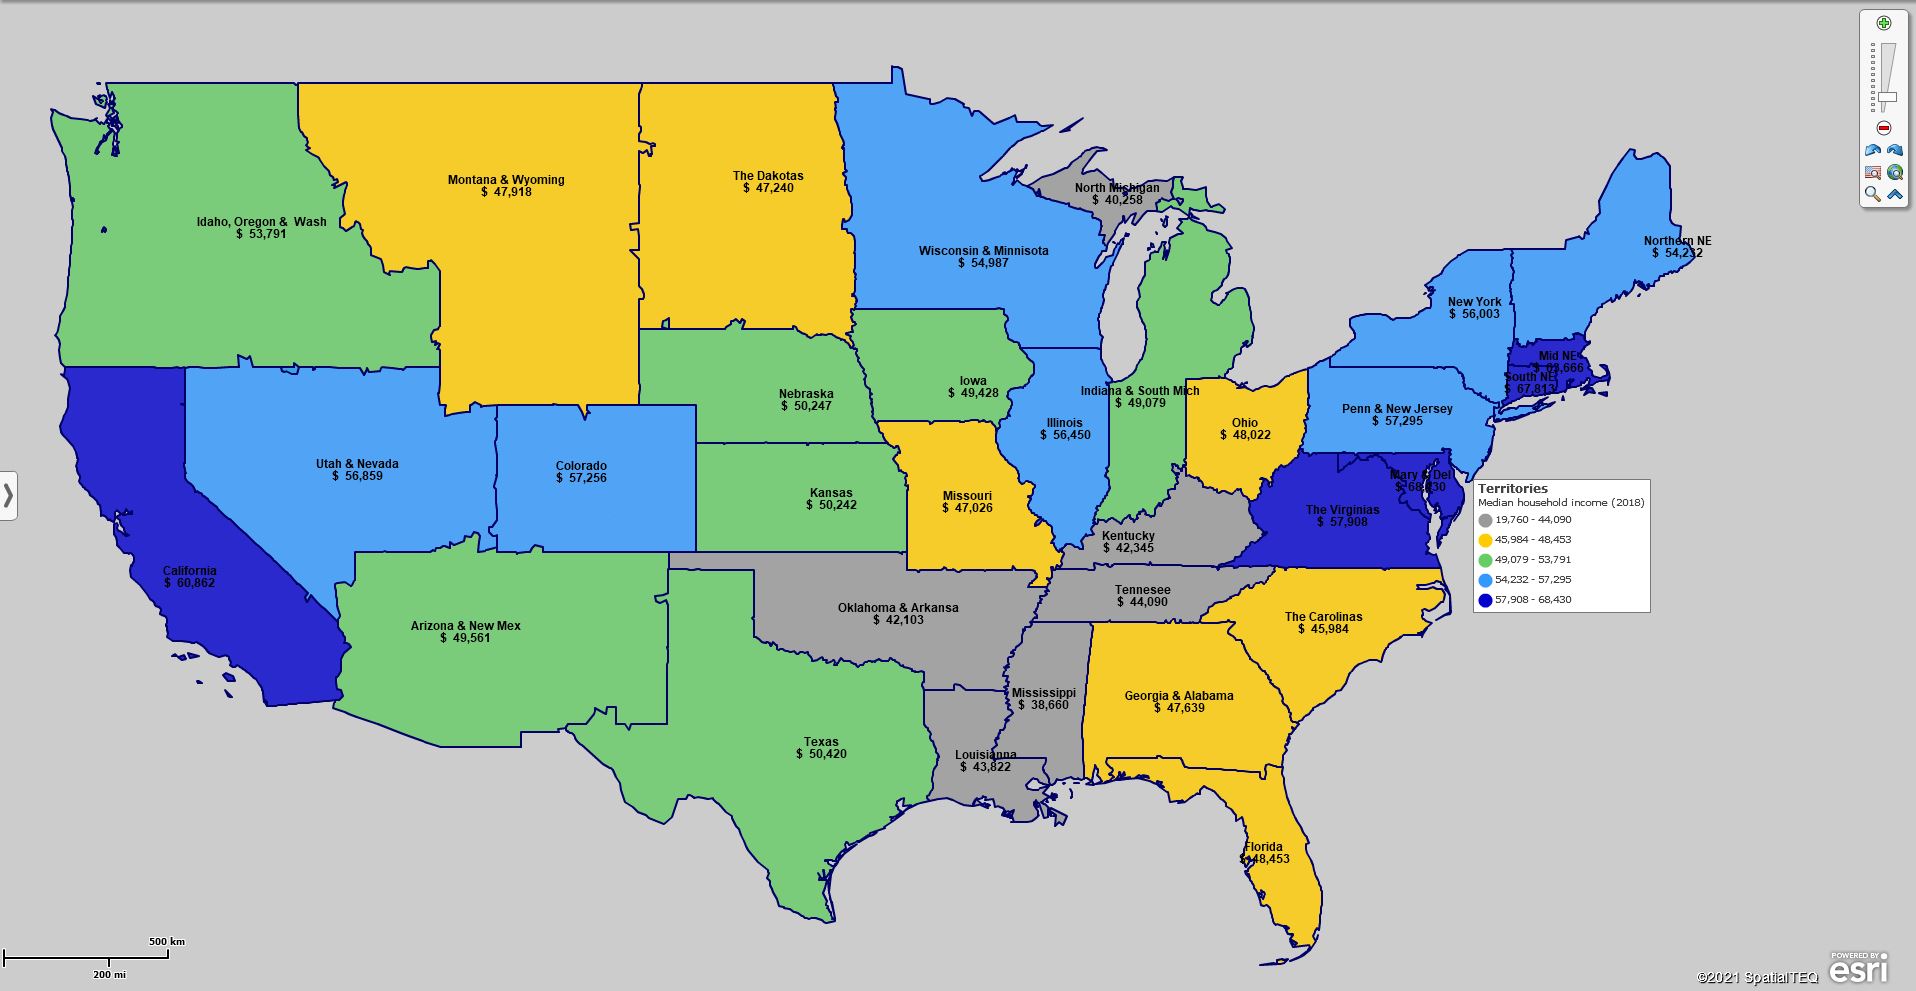
Color-code Territories by Demographic Makeup

Sales Territory Mapping & Organizational Structure

Huge companies may require sales territories that roll up into regions and divisions, better known as hierarchical sales territories (MapBusinessOnline Pro).  This way, management tiers are implemented to communicate clear company objectives across a sales force that could number into the thousands. Vice presidents at the division or national level oversee regional directors nationwide. Local sales managers supervise individual sales reps who travel within state or county jurisdictions.

Not all tiered sales operations follow this exact formula, but it is a common approach for online mapping software users. Simple sales territory maps usually suffice for companies catering only to regional areas.

Usually, sales territory maps are based on a business mapping application’s ZIP code map layer.  ZIP codes provide familiar and manageable area segments for territories that often cover cities with dense populations. Counties are also popular if the organization caters to a more regional, rural, or state-wide audience. The state map layer tends to be used by large conglomerates or businesses that cater to a worldwide customer base.

Map layer choices usually reflect the traveling representative’s areas of accountability. Traveling business people, those submitting only occasional overnight hotel receipts, will be well suited to ZIP code-based territories. Expenses should also coincide with map layer realities. For example, expense submittals from ZIP code-based territories rarely include airline tickets. If they do, you may want to investigate.

While I don’t believe most salespeople pad their expenses, I know from experience it happens. The excellent news is expense padding is wicked easy to expose because receipts, phone records, and mileages tell the story. All you need to do is spreadsheet out the details. Maybe make a few calls to verify dinners etc. You’ll catch the blatant violators.

Demographic Analysis by Territory Segment

The US Census Bureau publishes demographic data that conveniently matches standard map layer segmentations. Sales territory mapping enables demographic data inclusion in support of market analysis, assignment logic, and product applicability studies. Promotes demographic data inclusion in support of market analysis, assignment logic, and product applicability studies. The US Census Bureau publishes demographic data that conveniently matches standard map layer segmentations. These demographic categories are varied and regularly updated, meaning territory analysis is extremely useful for market projections and territory assignments.

Available demographic data covers various subjects, including, population, consumer spending habits, housing data, household statistics, and more.  A map creator may wish for additional categories that match a particular product or service requirement. If the data has a location component – a city, ZIP code, or county – a user can import that data into business mapping software.  Don’t be shy about asking MapBusinessOnline about additional demographic layers. We’ll consider adding new categories that come up often.

Territory alignment is often demographically generated, especially for consumer-oriented products. Retail establishments may prefer to view consumer expenditure patterns or ethnicity data by county or ZIP code. For instance, pharmaceutical companies may assign territories to sales reps based on the population levels of elderly residents by city or ZIP code – Census categories for population ages 65 and up.

Impactful though demographic data may be, the most critical location data a business can bring to bear on territory mapping is its business location data.  Historical sales data, customer locations, prospect locations, and other relevant location datasets magnify the power of territory mapping analysis. Viewing your key business measurements next to demographic categories can be very enlightening.

Additional Territory Map Segmentation

City limits, Census tracts, MSA’s, and ZIP3 Codes act in the same way as a ZIP5-Code map layer when applied. A City limits layer is ideal for urban area market studies. Less frequently, additional map layers serve as territory mapping segmentation.

Many companies must be tactical about sales coverages. Demographic data layered across urban areas is a telling projection of how the sale of a product or service will fare in that territory. Actively selling catheters in a New England college town is difficult to justify when Florida’s ever-aging population is buying up the USA catheter inventory faster than you can say UTI.

City limits or city limits grouped into urban territories ranked by demographic profile can indicate the most fertile areas for new distribution warehouses, retail stores, or sales hires. City limit demographic views are perfect for market expansion analysis and confirm the gut feeling of managers being asked to direct sales growth for expanding firms.  Read more about market expansion in this case study.

Non-sales Related Territories

While most businesses use territory maps as sales territories, many companies use territory management for other applications. Specifically, technical support, medical home care agencies, and construction site management are examples of non-sales territory map applications.

Those six aspects of territory mapping I referred to earlier still apply. Construction managers track progress against goals and monitor expenses just like sales managers. Technical support teams will meet out areas of accountability and monitor their reps’ activities, including travel expenses to trouble spots, as required.

Territory Map View

And traveling clinicians for homecare agencies may have the most challenging job. Homecare schedules are incredibly tricky. Unplanned cancelations, weather-related delays, and medical emergencies can all play a role in travel disruption, not to mention the incredible unpredictability of COVID-19 issues that can ruin a day. (Don’t get me started.) Within home care agencies, managing travel expenses and minimizing overlap while taking advantage of overlap are significant challenges.

Whatever your business’s challenges, territory management tools can help organize, communicate, and control areas of your mobile operations. Replace Microsoft MapPoint with MapBusinessOnline.

MapBusinessOnline territory mapping tools are available in both Standard and Pro subscription options.

Choose MapBusinessOnline Standard for basic sales territory mapping:

  • Create territory alignments by polygon lasso or imported spreadsheet.
  • Supports territory hierarchies – regions, divisions, and zones.
  • Edit territory segments with mouse cursor clicks, polygon data collection, or through data filtering.
  • Access complete demographic analysis views with location data reporting.
  • Address overlapping territory concerns with color-coding options.
  • Color-code territory assignments by demography or imported business data.
  • Segment territories by ZIP5 codes, ZIP3 Codes, City Limits, Counties, States, Census Tracts, or MSAs.

Choose MapBusinessOnline Pro for advanced sales territory mapping:

  • Includes all the features of MapBusinessOnline Standard.
  • Supports territory hierarchies – regions, divisions, and zones.
  • Automatically build multiple sales territories from radius searches or driving time and distance queries.
  • Enrich imported dataset with demographic and geospatial data,
  • Conduct map-based market analysis that combines geographic, demographic, and driving time analysis.

So, while territory mapping and sales territory mapping are virtually synonymous, pay attention to your organization’s unique requirements. Look for flexibility in your chosen applications, but remember, full customization of any software application can lead to the poorhouse.

_______________________________________________

Discover why over 25,000 business users log into www.MapBusinessOnline.com for their business mapping software and advanced sales territory mapping solution. The best replacement for Microsoft MapPoint happens to be the most affordable.

To access MapBusinessOnline, please register and download the Map App from the website – https://www.mapbusinessonline.com/App-Download.aspx.

After installing the Map App, the MapBusinessOnline launch button will be in the Windows Start Menu or Mac Application folder. Find the MapBusinessOnline folder in the Start Menu scrollbar. Click the folder’s dropdown arrow and choose the MapBusinessOnline option.

The Map App includes the Map Viewer app for free non-subscriber map sharing.

Please read customer reviews or review us at Capterra, or g2crowd

Contact: Geoffrey Ives geoffives@spatialteq.com or Jason Henderson jhenderson@spatialteq.com

Posted in Business Mapping Software blog post, How to instruction, Sales and marketing | Tagged , , , | Leave a comment

How A New User Gains Access to MapBusinessOnline

New users to MapBusinessOnline often start with the Free Trial.  Signing up for the Free Trial and registering for MapBusinessOnline is the same process. Click the Start Free Now button at www.MapBusinessOnline.com,  which sets up the free trial and registers you as an account owner.

Replace Microsoft MapPoint Right Now!

Registering is Important

The Free Trial has a period of 1-month. There are limits on some of the features available in the trial, noted on our pricing page. Scroll down to get familiar with the limitations.

For the most part, a full subscription will satisfy the average user’s requirements for the below noted features, but you can always purchase more at reasonable fees:

  • Import up to 100,000 location records per map (with the Standard Subscription)
  • Save up to 200 maps
  • Create up to 1,000 territories per map
  • Routing credits 1200 – applies to driving time & distance searches too
  • Stops per route 150
  • Publicly shared maps per subscription 1200

Once you’ve registered for the trial, you will want to access the business mapping software.  Adobe Flash Player, which MapBusinessOnline used to enable web browser access, has been discontinued.  Now all users must download the Map App and access MapBusinessOnline business mapping software through the Map App.

Download the Map App – Your Business Mapping Gateway

So, the current MapBusinessOnline onboarding process is this:

  1. Register for MapBusinessOnline through the Start Free Now button
  2. Download the Map App for Windows or Mac
  3. In the Windows Start Menu, or the Mac Applications folder, find the Map App, and inside the folder, click on MapBusinessOnline to launch the software
  4. Log in with your email and your password, which is set-up through the registration process, and launch MapBusinessOnline
  5. Click New Map on the left side of the Master Toolbar
  6. Read about creating your first business map here

Review the Your First Business Map Webinar

I recently provided a Webinar on creating your first business map that new users may find helpful. Find the webinar here: Your First Business Map webinar.  The webinar will walk you through the New Map process:

  • Starting a new map
  • Importing business data
  • Optimizing your map’s look and feel
  • Color coding data
  • Labeling

Maps for All Reasons

Asking for Help

Help is never far off. There’s Help documentation in the business mapping software. You can also refer to the Business Mapping Blog  for explorations of business mapping topics and application examples. For questions, we recommend you start by clicking on the Chat button in the lower right of the MapBusinessOnline website. You can also reach us through the Contact button on the website, which has options for email, web demo request, or phone calls.

Once you created a basic business map, you can enhance your map in many ways. Here are some additional blog subjects that could help you create a business map that achieves its purpose and might just turn you into a mini-star around the office:

All of the recommended blogs will help the new MapBusinessOnline user access the application, create a first business map, and enhance that business map for your specific purposes.

Business mapping is, like anything else we do in business, an acquired skill. The mapping techniques you learn in your current job will serve you well in your future roles, no matter where they are.

Our blog subjects include multiple write-ups on best practices for business mapping:

This blog explains the significant differences between MapBusinessOnline Standard and MapBusinessOnline Pro.

Now get mapping. MapBusinessOnline provides a full set of geographic analysis tools to conduct a variety of business applications:

  • Create and edit a sales territory map
  • Conduct map-based market analysis, a target market map, or generate areas of interest around the USA and Canada
  • Build comprehensive demographic analysis maps
  • Create spatial queries by radius search, polygon search, or drive time search
  • Build optimized sales routes with up to 150 stops
  • Research and download business listings by area, name, or industry
  • Construct ZIP code maps that support your business models
  • Extract ZIP code lists out of MapBusinessOnline
  • Build coverage area maps, competitor maps, dot-density maps, and more

By the time you’ve completed your first or second business map, not only will you be the envy of your department, but you’ll know the deepest secret of all about business mapping software – business maps are fun.

_______________________________________________

MapBusinessOnline access has officially transitioned from Web Browser (Adobe Flash Player) access to the Map App download access.

  • Please download the Map App from the website – https://www.mapbusinessonline.com/App-Download.aspx.
  • After installing the Map App, the MapBusinessOnline launch button will be in the Windows’ Start Menu or Mac Application folder. Find the MapBusinessOnline folder in the Start Menu scrollbar. Click the folder’s dropdown arrow and choose the MapBusinessOnline option. You can drag the Icon to the task bar for a quick launch button.
  • All saved maps will be available through your Map Library Folder, the second button in from the left on the Master Toolbar. (Green File Folder icon.)

Map App access to MapBusinessOnline.com provides enhanced features and a better user experience.

The Map App includes the new Map Viewer app for free non-subscriber map sharing.

Value-Added Resellers – Offer the tool to your customers as a reseller. Make money on training and consulting. Contact us with further interest in reselling MapBusinessOnline.

Find out why over 25,000 business users log into www.MapBusinessOnline.com for their business mapping software and advanced sales territory mapping solution. The best replacement for Microsoft MapPoint happens to be the most affordable.

Contact: Geoffrey Ives geoffives@spatialteq.com or Jason Henderson jhenderson@spatialteq.com

Posted in Business Mapping Software blog post, How to instruction | Tagged , , | Leave a comment

How to Add Map Layers to Your First Business Map

MapBusinessOnline includes a variety of Map Layers that are overlaid on top of a basic map background to provide the basic components of a business map.  The map background, usually the “Streets” layer, is the bottom layer that all the other layers overlay.

Read About Creating Map Visualizations

If you look at Map and Data, the Blue and Gray box that floats over the map view, you will see all the Map Layers listed with checkboxes assigned to each layer. The bottom checkbox is already checked on when you, the user, create a New Map by clicking the New button on the right side of the master toolbar. Read more about Map and Data here.

In a brand-new map, recently launched, Map and Data shows four map layers as noted below:

States – The map layer contains state boundaries, FIP’s code, and labels

Counties – The map layer contains county boundaries, FIP’s codes, state abbreviations, and labels

ZIP5 Codes – The map layer contains ZIP code boundaries, place names (towns), primary state and counties, state abbreviations, and labels

Streets – A map ground primarily consisting of streets with some land-cover, building footprints, and state and city labels

A new map launches with only the map background layer or “Streets” turned on. The other three layers are unchecked. Check them on to display ZIP codes, Counties, or States on the map.

Additional Map Layers are available to add to the map. Those additional map layers are in the Map Layers button, located under the ‘Adding to Map‘ section of the Master Toolbar.

Adding Additional Map Layers to Your Map

Select a layer in the Map Layers button and the layer will appear as a new checkbox option in Map and Data. When you add the map layer to the map the new layer shows up on the map and is checked on in Map and Data. Sometimes users inadvertently uncheck the added map layer in Map and Data and may look for the layer in the Add Map Layer button. It will no longer show in the Add Map Layer button, the user must recheck the checkbox associated with that layer in Map and Data.

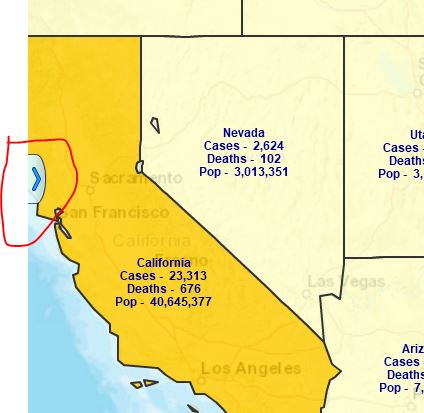
Hint: Map and Data can also be turned off inadvertently. To turn it back on, find the Blue Arrow on the far-left side of the map right in the middle. Click to relaunch Map and Data

Where did Map and Data go?


Many users may never find a need to add additional map layers, but it is nice to know they are there. Below is a list of the map layers available to add to the map and what they might be used for:

Census Tracts – A full map layer with boundaries of Census Bureau administrative districts, similar to ZIP codes only smaller. Census tracts let the user create smaller territories, or organize demographic data based on Census assigned areas. Territories based on Census tracts provide smaller area territory segments in crowded urban areas. Each Census tract includes its own FIPS code in the Data Window view.

Cities – A point layer of cities and towns across America. These points are just names associated with points that will be located on the map at the center of each city or town area. The City point layer is not editable or filterable.

City Limits – A full map layer with boundaries of all the cities and towns across America. Create territories and areas of interest based on city limits. City Limits, like ZIP codes, Counties, and States, have a Data Window analysis view, including access to MapBusinessOnline’s Demographic Data Library.

Congressional Districts – A map layer with boundaries. These are the official federal congressional districts. Color code the districts by party affiliation. Read more about Congressional Districts.

Highways – Exactly that. Highways come in handy when you’ve got a solid map layer of counties or states or territories and you want to add a transportation layer for reference or business reasons.

Metropolitan Statistical Areas – A map layer with boundaries that represent Census Bureau defined Marketing Areas. These are largely urban areas used for marketing purposes.

School Districts – Regional school districts. This layer is also a map layer with boundaries.  You see various school district layers listed by region. The data includes some information on schools and school classifications.

3-Digit ZIP Codes – A map layer with boundaries.  This ZIP code layer represents just those first three digits of a 5-digit ZIP code. Thus a 3-Digit ZIP code will be much bigger in area than a 5-digit ZIP code. For instance, Massachusetts has many different 5-digit ZIP codes that start with the digits 019. The 019 3-Digit ZIP code represents all those areas combined.  3-Digit ZIP codes are often used for territory management or direct mail analysis. Become an expert on ZIP codes.

Bonus Feature – Exporting FIPS Codes

I mentioned above that FIP’s codes are included with the Census Tract, County, and State map layers. FIP’s stands for Federal Information Processing Standards.  Government agencies like to use FIP’s codes. They help organize the analysis of counties and Census tracts. Who uses them?  Government employees, forest service people, and land management pros.  You know who you are.

To export FIPs codes associated with County or Census Tract territories:

  1. Select the layer in the Data Window Drop Down
  2. On the Data Window Toolbar select the Search by Territory (Yellow Puzzle Piece Icon)
  3. Choose the lower option, ‘Search and show territory assignments in the Data Window’
  4. Export via the far-right button on the Data Window toolbar
  5. The layer exports as a CSV file and will include FIPs codes

Where would a digital map be without Map Layers? I’ll tell you where – spread out on a desk in paper form. Map Layers allow modern-day map users to view a variety of perspectives.  These map views, complete with associated data, allow for analysis, filtering, and spatial queries. They are the secret sauce of business mapping.

Keep in mind, the most valuable map layer of all is probably the map layer you import made up of your business data.

_______________________________________________

Find out why over 25,000 business users log into www.MapBusinessOnline.com for their business mapping software and advanced sales territory mapping solution. The best replacement for Microsoft MapPoint happens to be the most affordable.

To access MapBusinessOnline, please register and then download the Map App from the website – https://www.mapbusinessonline.com/App-Download.aspx.

After installing the Map App, the MapBusinessOnline launch button will be in the Windows’ Start Menu or Mac Application folder. Find the MapBusinessOnline folder in the Start Menu scrollbar. Click the folder’s dropdown arrow and choose the MapBusinessOnline option.

The Map App includes the Map Viewer app for free non-subscriber map sharing.

Please read customer reviews or review us at Capterra, or g2crowd

Contact: Geoffrey Ives geoffives@spatialteq.com or Jason Henderson jhenderson@spatialteq.com

Posted in Business Mapping Software blog post, How to instruction | Tagged , , , | Leave a comment