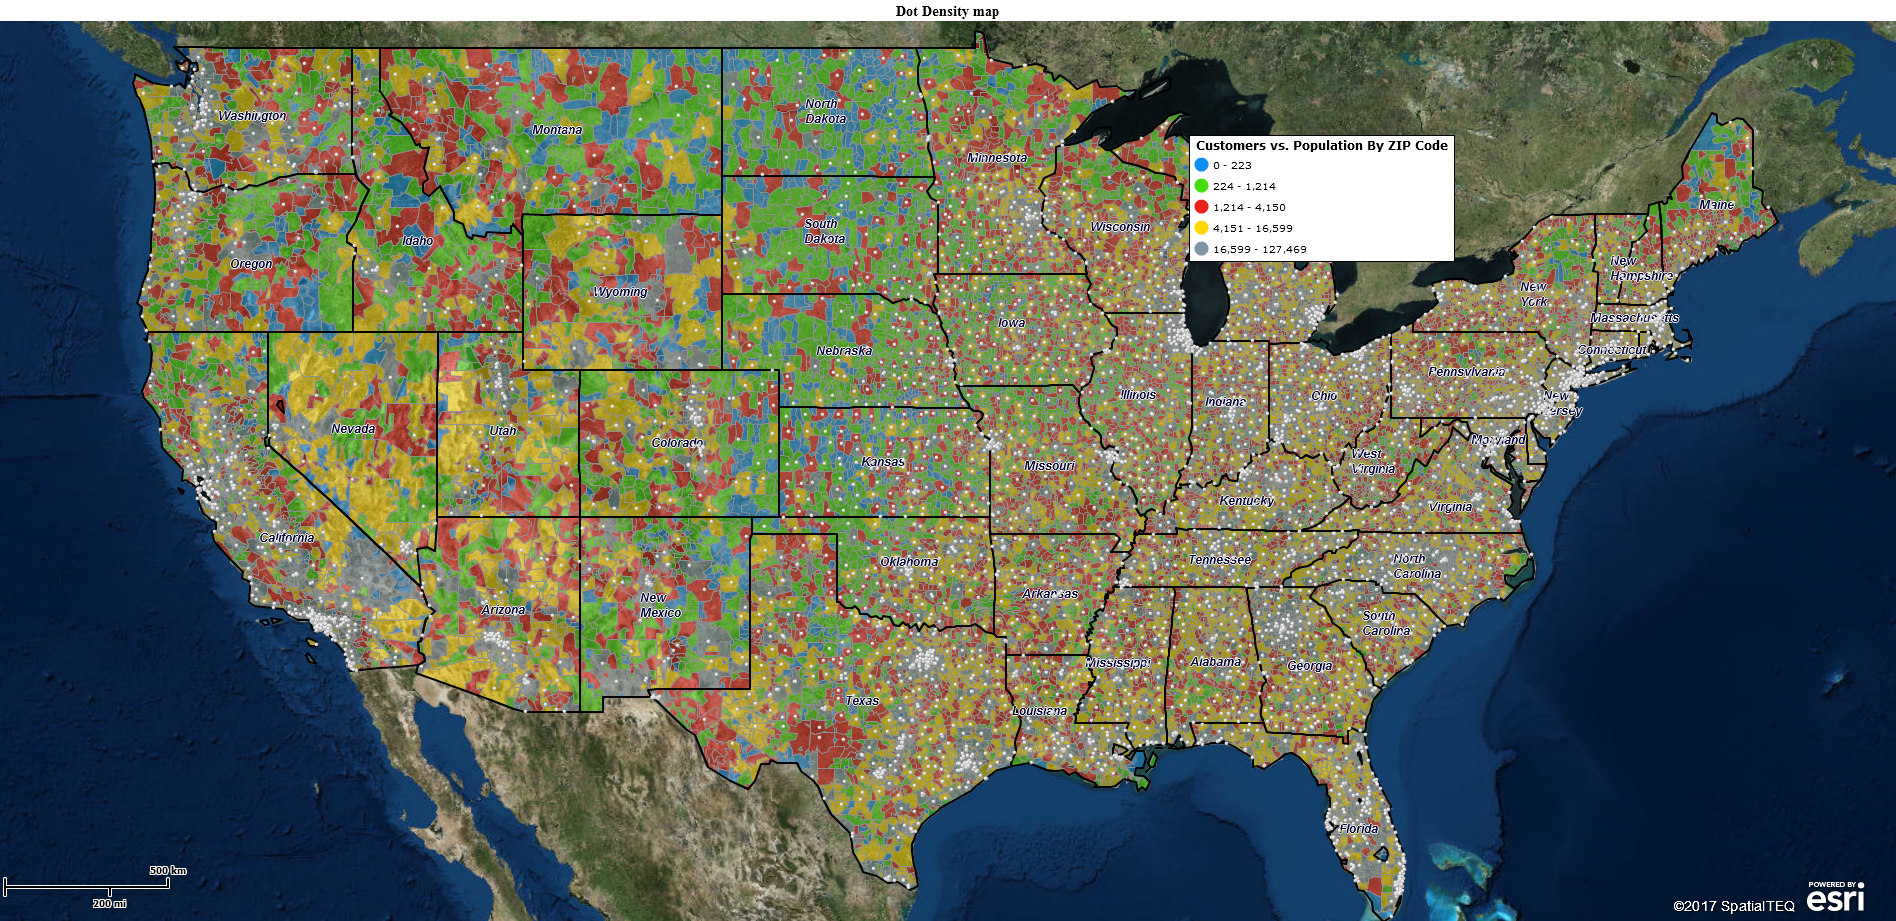
How Do I Create a Demographic ZIP Code Map?

Let’s create a demographic map by ZIP code. We’ll be using the ZIP code map layer and applying demographic data to that layer. ZIP code maps are one of the most popular uses of online business mapping software.

As preparation, make sure your ZIP Code options are set to ZIP5 Code with Fillers in Map and Data. That option provides the best ZIP Code options for building accurate ZIP code maps with no holes out west due to national parks. Trust us. It’s the best setting.

Read More About ZIP Code Mapping

Start with a New Map

Click the New Map button on the far-left side of the Master Toolbar. With a new USA map in view go to Map and Data, the blue, floating box with all layers listed with checkboxes, and turn on the ZIP code layer.

Hover over the ZIP code layer in Map and Data and click the Map Layer Properties button. In the panel that opens-up, move the transparency scrollbar to the right to perhaps 70% – enough to show a measure of the map background through the ZIP code layer.

Demographic data can be displayed in multiple ways in MapBusinessOnline. The first thing to do is decide what the map’s primary goal is. In our map, we’ve decided to visibly display the Number of Households and compare that to general Population data, and Household Income Levels. All the demographic data will be presented by ZIP code.

I would tweak the ZIP code layer a little more, making the boundaries slightly thicker and a darker color. On second thought, I would keep the boundary thickness at the thinnest option because ZIP codes are so dense when viewed from a national perspective. Use your judgment as you adjust your map look and feel.

Add Demographic Data

Now that your ZIP code map layer is tweaked let’s color-code the ZIP codes by a demographic category.

Still in Map and Data, with the ZIP code Map Layer Properties panel open, notice the button labeled Color-Code Map Layer. Click it.

Just as an aside, you could achieve the same functionality by clicking the Color Coding – Boundary button on the Master toolbar.

We decided earlier in this write-up to color-code the ZIP code layer by the category of demographic data associated with the number of households. Here’s the process:

  1. Click Color Code Map
  2. In the dropdown at the top, choose Demographic Data
  3. In the next dropdown, scroll down to 2018 and slowly scroll through the categories until you come to Households (2018). 2018 is the layer of data most recently released by the Census Bureau. The two more recent layers above 2018 are third party projections.
  4. Next, move to the color groups section. You could color up to 100 groups, but that’s not necessary for a simple demographic map. Choose five at the most.
  5. Looking at the five group color options, I usually break the numeric ranges into sensible breaks like 1 – 250, 251 – 1000, 1001 – 5000. Use your judgment. It’s easy to reprocess the color-coding and try different schemes.
  6. Click into the color-code boxes to tweak color shades, or choose from the dropdown of preformatted color schemes
  7. When you are satisfied, click Done

As always, it’s easy to go back to the Color-Code Map button and run through the process again. Your settings are saved and can be easily adjusted.

Append Supporting Demographic Data to ZIP Code Labels

Now that the map is a ZIP Code Map color-shaded for demography, it’s a good idea to consider adding supporting demographic data to your map labels. Because our map is focused on Households, we’ll want to add information like Median Household Income or Median Household Size. But you could add the overall population or some other relevant factor to your map.

To add labels with demographic data to your map, start by making sure the ZIP code labels show up on the map view at the nation-wide viewing level. Mapping applications will present ZIP Code labels only where they do not overlap each other. So you’ll see fewer labels displayed at a Zoomed Out level and more as you Zoom In.

  1. Hover over the ZIP Code layer in Map and Data, click the Edit Map Layer Properties button
  2. Along the right side, click into Labels
  3. In the label panel, scroll to the bottom to where it says Show Auto Labels. Auto Labels for a ZIP code are actual the ZIP code number. At the bottom, where it says Start Labeling From, click the Dropdown and choose North America. Now ZIP codes will begin to appear on your map. You’ll see more as you zoom in

Any Auto Label in MapBusinessOnline allows up to five flexible labels to be appended. To add demographic data to the ZIP Code Auto Label, scroll up to the top of the Label Panel:

  1. Click into Format Labels
  2. Click into the Auto Label Tab (make sure). The other option is Custom label which controls the pop-up labels generated when a mouse cursor hovers over a ZIP code
  3. Under Auto Label, below the “Select data values…” Select #1. In the top dropdown, find Demographic Data, in the second dropdown, find Household Income. Make sure to input some Prefix Text. Repeat for number 2, except this time grab Average Household Size data. Proceed through line 5, as required
  4. Click Change Labels in the lower-right

Other data could be appended to your demographic ZIP code map labels. You could import user business data and added columns to your ZIP code labels. You could also purchase MapBusienssOnline business listings and add columns from that data to your ZIP code labels.

And with that, you have created a ZIP code demographic map.  You could add more data to the map to expand its utility. One way to enhance your map is to import relevant business location data into the map. Imported business data could be left as dot-density points on the map, or it could be color-coded to reflect numeric values contained in the data imported.  One could also create a heat map view, using the Heat Map button on the Master Toolbar. The map is your oyster, as it were.

ZIP Code maps are used by a wide variety of businesses to visualize their business operations, layout their customer locations, or to share sales territories.

I believe ZIP code maps are powerful because all of us relate to the ZIP code as the area where we live. In many cases, our ZIP code is our town. We understand what a ZIP code is both in practicality, spatially, and demographically.

And for all you MapPoint users out there, come over to MapBusinessOnline and get those obsolete ZIP code maps up to date.

_______________________________________________

training and consulting. Contact us with further interest in reselling MapBusinessOnline.

Find out why over 25,000 business users log into www.MapBusinessOnline.com for their business mapping software and advanced sales territory mapping solution. The best replacement for Microsoft MapPoint happens to be the most affordable.

To access MapBusinessOnline, please register and then download the Map App from the website – https://www.mapbusinessonline.com/App-Download.aspx.

After installing the Map App, the MapBusinessOnline launch button will be in the Windows’ Start Menu or Mac Application folder. Find the MapBusinessOnline folder in the Start Menu scrollbar. Click the folder’s dropdown arrow and choose the MapBusinessOnline option.

The Map App includes the Map Viewer app for free non-subscriber map sharing.

Please read customer reviews or review us at Capterra, or g2crowd

Contact: Geoffrey Ives geoffives@spatialteq.com or Jason Henderson jhenderson@spatialteq.com

Posted in Business Mapping Software blog post, How to instruction | Tagged , , | Leave a comment

4 Enhancements for Your First Business Map

So, you’ve created a basic business map.  You’ve downloaded the Map App and accessed MapBusinessOnline from the Windows Start Menu or MAC Applications folder. Then you imported an address-based or latitude longitude-based spreadsheet and developed a map that pertains to your business in some way. Your associates were impressed, but could you do more? Could you enhance your first business map’s imported business data with symbolization in the map view?

Symbolizing Your Imported Business Data

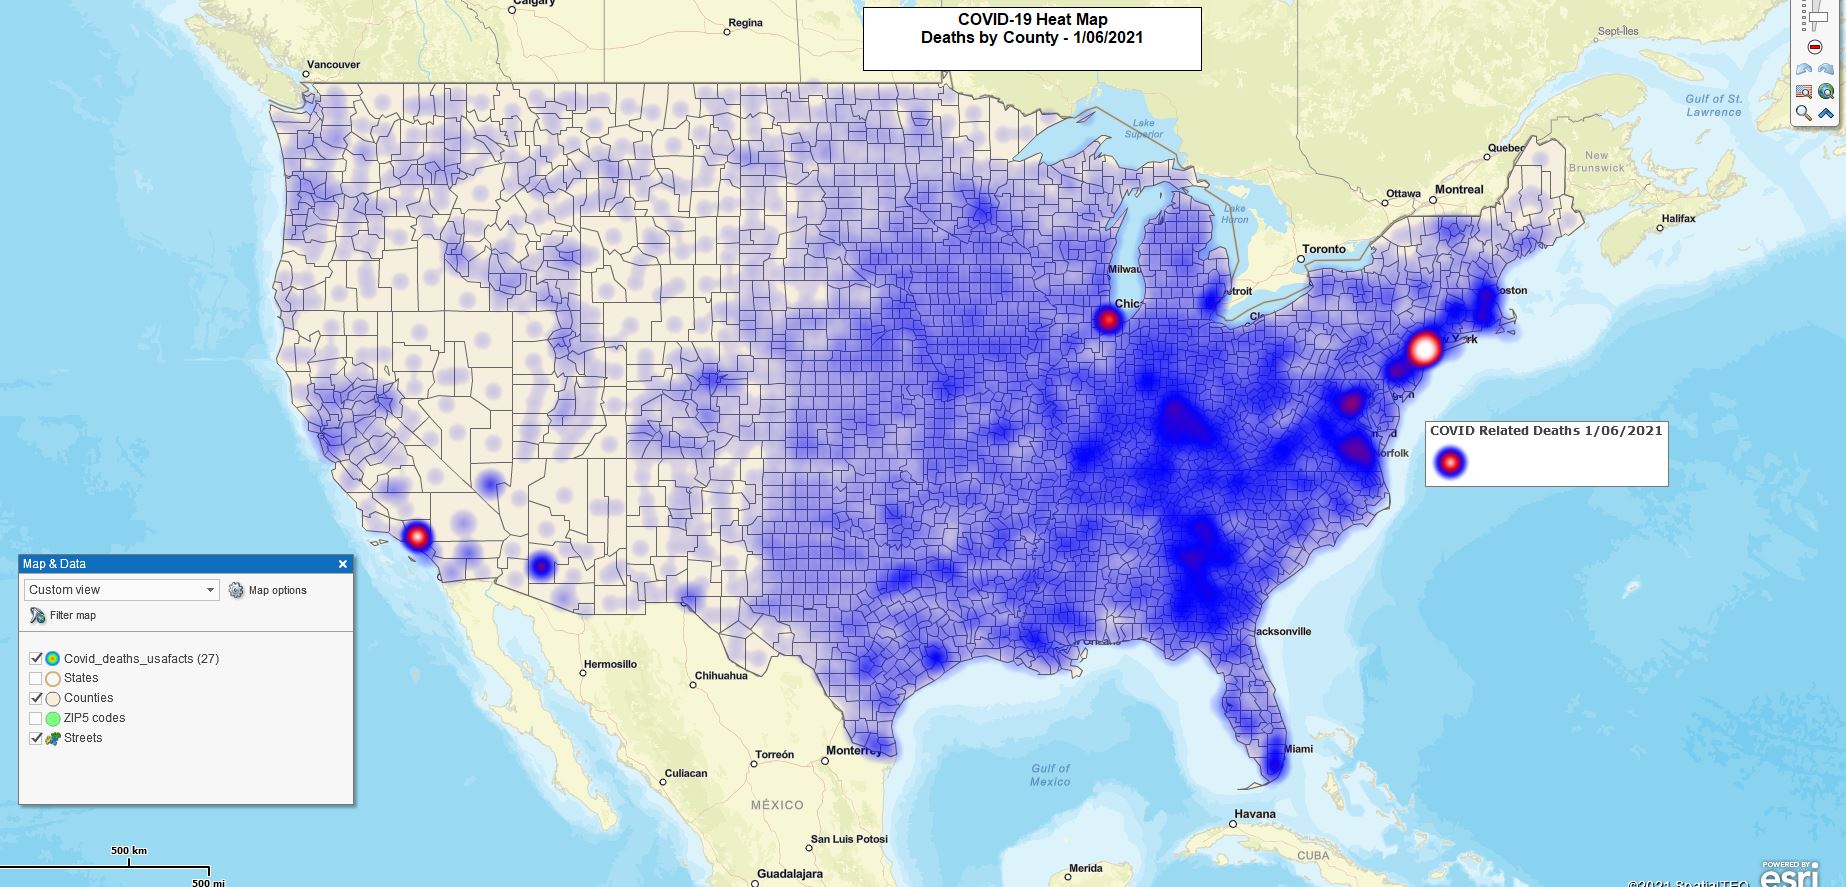
A recent COVID-19 Death map might benefit from a heat map enhancement.  We get our COVID-19 data from USA Facts.org. As of late, more counties are suffering from an expanding death rate, unfortunately. With the data already imported, a heat map, similar to a weather map, is easily achieved. MapBusinessOnline heat mapping works like this:

  1. In Map and Data make sure the imported COVID Deaths point layer is selected
  2. Select the Heat Map button under the Color-code section on the Master Toolbar
  3. Select your imported Death data layer and drop down to the appropriate column
  4. Choose a color scheme and move the scroll bar to an acceptable level of intensity
  5. Click Done
  6. Repeat the process to try various schemes

COVID-19 Deaths Heat Map

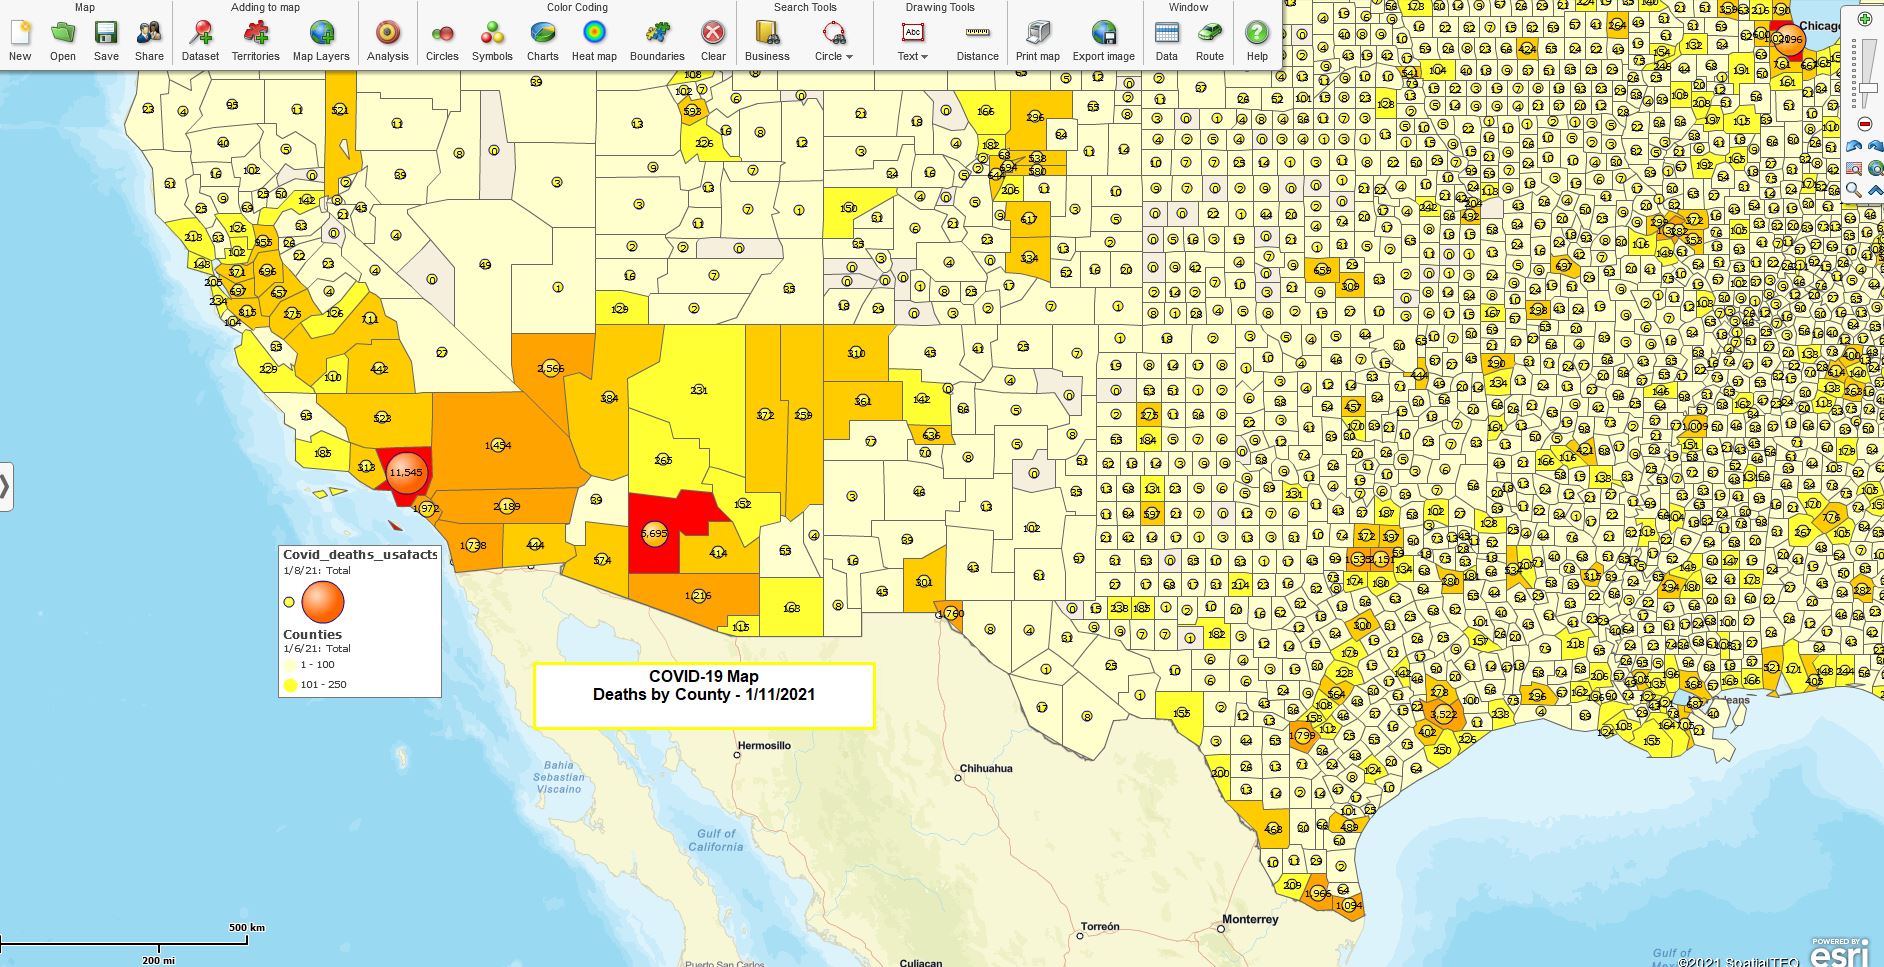
One could also color code the counties or states by the same imported dataset.  ZIP code color coding would not work in this case because the dataset happens to reflect deaths by County.  Color-coding imported data by ZIP code or county is  sometimes referred to as a “heat map.”

Heat Map by Administrative District

Using the same map, I unchecked the point layer in Map and Data to get rid of the heat map view.  Here is what I did next:

  1. Chose the Color Code Boundary option on the Master Toolbar
  2. I selected the County Map Layer
  3. I selected my data and chose the most recent death data column by date
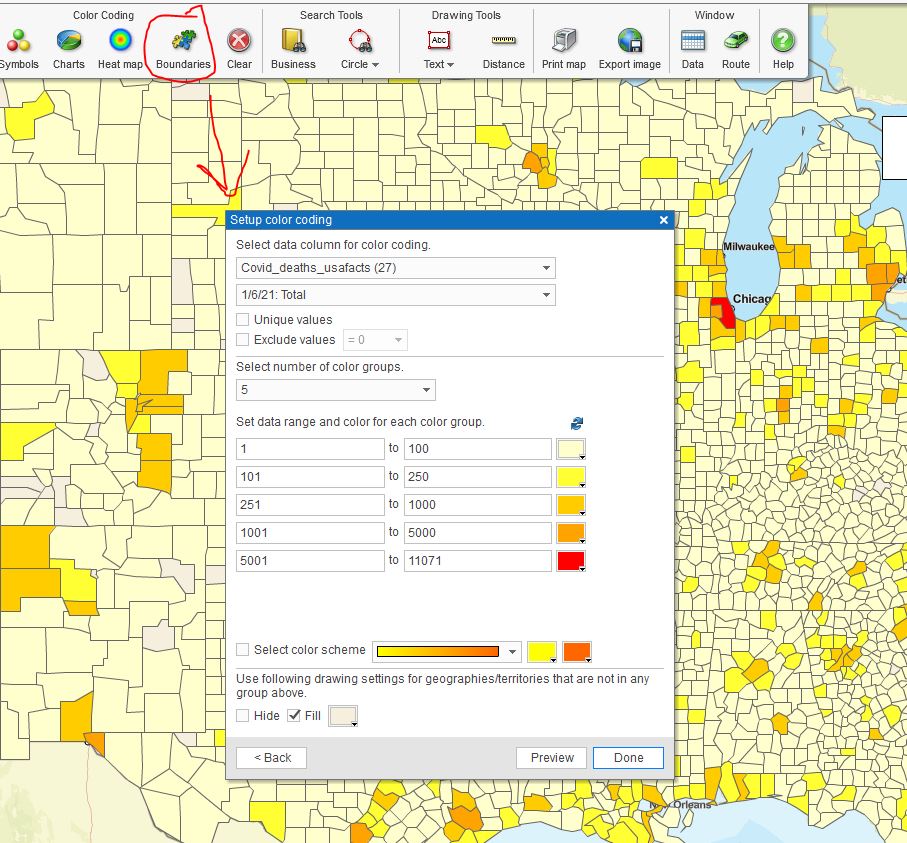
  4. I set up a 5-range color code theme. I believe 5 ranges are appropriate for the data subject at hand
  5. I manually assigned a numbering scheme to each of my five ranges. Beginning with 1 to 100, and ending with 5,000 to 11,071. Choose your own numeric ranges
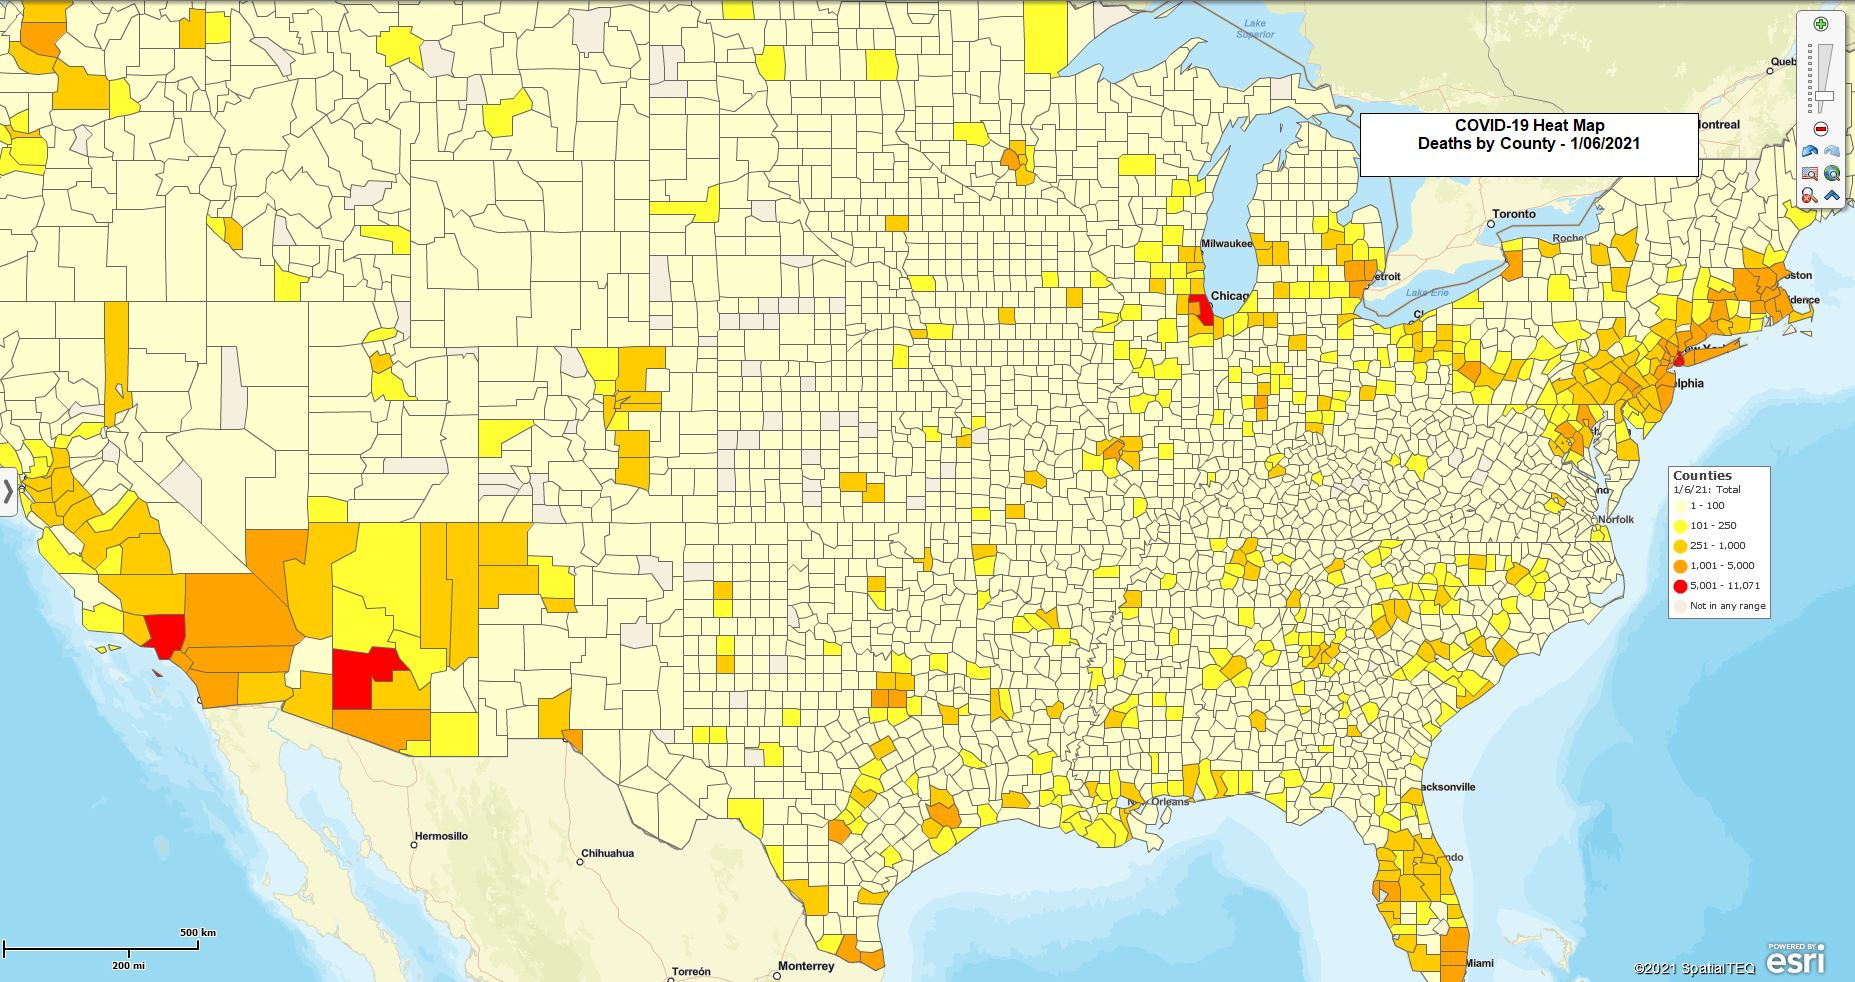
  6. I did select the prefabricated yellow-to-orange color gradated color option. But then I inserted some of my own color choices to enhance the gradated scale and color the highest deaths a bright red
  7. I clicked done in the Color-code process.
  8. I also edited my legend to explain the color scheme and I closed the Master Toolbar and Map and Data to create a pure map image

Setting up color ranges

COVID Deaths by County


Color-Code by Circle

Another valuable approach to symbolizing your imported location data is by circle symbols. MapBusinessOnline lets you apply a circle symbol to a numeric column of your data and then tweak that symbol to show the numeric value, associate a color scheme, apply a 3D symbol and apply a border color to that symbol. This all serves to include a numeric value within a color-coded circle at each point location.

  1. With your imported data layer checked on in Map and Data, select the Circle Color Coding button under Color Coding on the Master Toolbar
  2. Select your imported data layer
  3. Select the Map Layer to apply (in this case counties)
  4. Choose the column of numeric data targeted for symbolic display
  5. Apply the varying controls to your symbol’s look and feel
    1. Select a color scheme and 3-D
    2. Choose a border color and pixel width
    3. Tweak the minimum and maximum sizes for the circles related to numeric values
    4. Finally, set the overall numeric text value size, boldness, and color. Also, choose a box outline option, if you want that

Color code by circle map view

Remember to keep things simple and clear when selecting symbol options.

As you can see, there are many options for adjusting your map image to create a better visualization of a business, medical, or tactical situation using location data. But MapBusinessOnline also provides an analysis view through the Data Window.

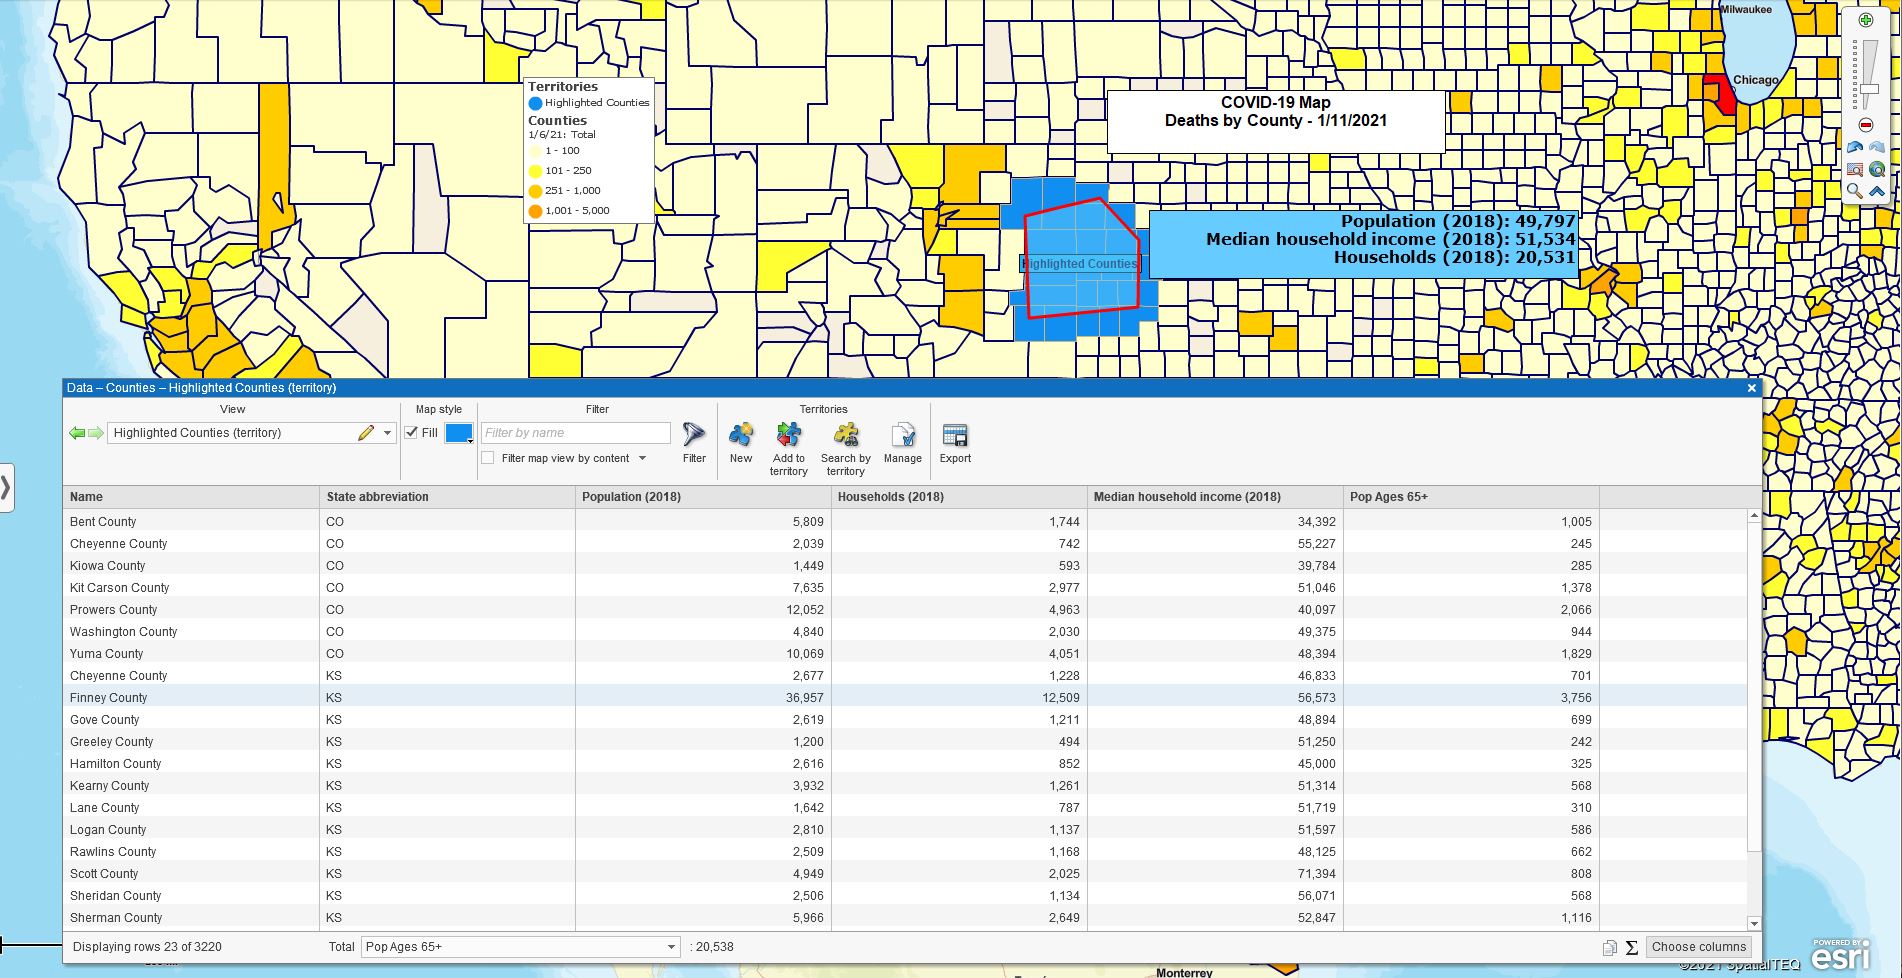
Click the Data Window button on the right side of the Master Toolbar.  This action opens up a spreadsheet view of the map. The Data Window includes its own toolbar. On the far-left side of the data window toolbar is a dropdown list. That drop-down accesses data available for the map user to work with.

Select the imported data layer in the drop-down list.  Now the Data Window displays the spreadsheet you imported. In the lower right of the Data Window view, you will see the Change Columns button. Read more about the Chang Columns button here.

Click the Change Column button and a database management tool opens up. On the left side of the database management tool click the drop-down to access the data available for import into your analysis view.

You can add imported location data, data from other map layers, demographic data, and even calculated data columns that display basic formula results and demographic category summations.

Probably the most powerful map enhancement you can bring to bear on a MapBusinessOnline business map is importing multiple categories of demographic data to the Data Window analysis view. Here’s a map view of the map we’ve been working with showing the Data Window and a demographic Summary insert from a polygon search of counties.

County COVID Deaths – data options

Once you’ve created your first basic business map, there are a variety of directions you can take to enhance your map. Always keep it simple, remember your map audience and your map’s purpose, and you can’t go wrong.

_______________________________________________________


Find out why over 25,000 business users log into www.MapBusinessOnline.com for their business mapping software and advanced sales territory mapping solution. The best replacement for Microsoft MapPoint happens to be the most affordable.

To access MapBusinessOnline, please register and then download the Map App from the website – https://www.mapbusinessonline.com/App-Download.aspx.

After installing the Map App, the MapBusinessOnline launch button will be in the Windows’ Start Menu or Mac Application folder. Find the MapBusinessOnline folder in the Start Menu scrollbar. Click the folder’s dropdown arrow and choose the MapBusinessOnline option.

The Map App includes the Map Viewer app for free non-subscriber map sharing.

Please read customer reviews or review us at Capterra, or g2crowd

Contact: Geoffrey Ives geoffives@spatialteq.com or Jason Henderson jhenderson@spatialteq.com
Posted in Business Mapping Software blog post, How to instruction, Uncategorized | Tagged , , | Leave a comment

Six Key Questions to Ask About Your Business Map Project

Managing a map project may seem like a daunting experience to the uninitiated. Not to worry, MapBusinessOnline provides most of what you’ll require to complete a successful business mapping project.

Someone in your organization has decided a business map is necessary, and they’re casting their beady eyes at you.  Breath, take a step back.   Put on your big boy or girl pants and volunteer.  You’re going to discover that business mapping, GIS, or geospatial work is actually quite fun and rewarding.

Your map project could be a customer map, a sales territory map, a resource map, or some other kind of  business map. Even if we are not aware of the type of map you must produce, MapBusinessOnline can probably achieve the situational awareness your organization is looking for.

Below is a suggested approach to implementing a business map project using online business mapping software.

Meet with the Stakeholders

When you sense a geospatial map-project is headed your way, the first thing you should do is meet with the stakeholders. Meet your stakeholders as a group or one at a time, but do it. Ask the stakeholders these six key questions and record their answers:

  • Who is responsible for the map project? As with any business project, it’s a good idea to understand who is being held accountable for the project. Understanding accountability will help you prioritize your effort.
  • Who will be the audience for the map project? This answer to this question helps with the design of your map project. Knowing who the map audience will be, helps to define the scope of the map project. Make sure you understand the general focus of the project, and the data that will be used to support the project’s intent. Does the executive team know the map project exists? Don’t get caught working on a rogue project.
  • What is the purpose of the map project? Beware of map projects with many themes. Do not try to solve multiple problems with one map unless they are inherently related.
  • How will the map project’s success or failure be measured? Will the map project itself solve a problem or will it simply contribute to a planning session focused on a larger issue? There’s a big difference. Your efforts should be measured by how well the map exposes a problem or  communicates results.
  • What is the geographic extent of the map project? Are there geographic boundaries that define the scope of the project? Is the map project national, regional, or local?
  • Is there location data to support the project? Where is the location data and how do I get access to the location data? Are there restrictions on data use and data sharing? See below.

What Location-Data is Available to Support the Project?

Geospatial data or location-data is commonly used in business systems like CRM’s or ERP systems. Location-data will be business data that includes address components (address, city, state, and ZIP code), or latitude/longitude coordinates.

Your IT department will know where location data is stored and what the access protocols will be. Examples of these address-based datasets include customer lists, resource locations, and store locations. Sometimes these datasets need to be cleaned up before they are used. For instance, address components need to be expressed in separate columns:

Address | City | State | ZIP code

Also, using ZIP codes only to locate points on a map, while entirely doable in MapBusinessOnline, is not very accurate. I recommend geocoding by ZIP codes only when you plan to create a ZIP code heat map.

An Insurance Mapping Project

In addition to securing access to your businesses or project’s location data, make sure you understand the rules around data use and data sharing. If you work for a medical firm, your work will be under legal HIPAA restrictions. Be very careful about how you expose personal health data. Even if your business is not in the health care industry sharing location data is often restricted by company privacy restrictions.  Get clear on your data-use rules.

Create a Focused & Compelling Business Map

With an understanding of your project’s purpose and access to supporting geospatial data established, it’s time to create a compelling business map. I have written multiple blogs that describe the process of creating a compelling just such a business map:

Six Easy Steps to Your First Business Map

The Top Six Considerations When Creating a Business Map

General Guidelines for MapBusinessOnline Territory Mapping

4 Advanced Territory Mapping Capabilities in MapBusinessOnline Pro

9 Ways to Access Demographic Data in MapBusinessOnline Standard or Pro

How Do I Create and Optimize a Business Map Visualization?

These blogs are just a few of the many blogs posted describing the use of MapBusinessOnline. For map-project development, I would also advise that map creators follow these tips:

  • Save your map work as a map template. Map templates preserve your work from inadvertent overrides and save your map work as a template easily converted to new map projects.  On the Master Toolbar, click the Save Button. In the drop-down select the Map Template option.
  • Double-check the spelling of all labels, legends, and text boxes. Rename imported file names. Good maps tend to be reviewed by the top brass. Make sure your work looks professional. A few seconds adjusting a file name in Map and Data can elevate your cred in the eyes of management.
  • Do not rush to publish your map work. Maps take time to develop. Secure second and third opinions on your work. Take your time. Keep it professional. Remember it maps are a visual medium. Maps are not as easily proofed as a Word Doc with a spellchecker.
  • Never publish personal or proprietary data – health records, contact info, financial records, sales records are all restricted data. Always make sure the data imported into your map work is approved for sharing. Assume that it is not approved.

Armed with all of these recommendations for creating and managing a map project, sally forth and ‘conquer la mode du geographique.’

“Ah, Tish. You spoke French!” said Gomez.

_______________________________________________________


Find out why over 25,000 business users log into www.MapBusinessOnline.com for their business mapping software and advanced sales territory mapping solution. The best replacement for Microsoft MapPoint happens to be the most affordable.

To access MapBusinessOnline, please register and then download the Map App from the website – https://www.mapbusinessonline.com/App-Download.aspx.

After installing the Map App, the MapBusinessOnline launch button will be in the Windows’ Start Menu or Mac Application folder. Find the MapBusinessOnline folder in the Start Menu scrollbar. Click the folder’s dropdown arrow and choose the MapBusinessOnline option.

The Map App includes the Map Viewer app for free non-subscriber map sharing.

Please read customer reviews and review us at Capterra, or g2crowd

Contact: Geoffrey Ives geoffives@spatialteq.com or Jason Henderson jhenderson@spatialteq.com
Posted in Business Mapping Software blog post, How to instruction | Tagged , , , | Leave a comment

How Do I Share Demographic Data Through An Interactive Web Map?

MapBusinessOnline allows a subscribing Map Creator to share interactive web maps that include demographic data at no additional charge. Make sure any business mapping software tools you subscribe to offer the same generous capabilities.

A subscriber can setup this publicly shared map by placing demographic information in the labels associated with map layers, including territories.  Map Layer labels can be shared interactively either as Auto Labels, which show up as static labels on a shared map, or as Custom Labels, which show when the map viewer hovers over the map layer object with their mouse cursor. Read more about map labels.

Territory map layers allow demographic data to be interactively shared as a static Auto label only. The pop-up ‘custom label’ is not an option in the territory map layer. MapBusinessOnline territory analysis views from the Data Window are also not sharable from public map sharing.

Here’s the Process

There are three overall steps to accomplishing this Demographic Map Sharing operation:

  1. Create a map with the demographic data in the map layer label
    1. With your data imported into your business map, in Map and Data hover your cursor over the layer you want to display your data. It could be ZIP code, State or County layers, or even Map Layers added to the map.
    2. Under the Label Tab, choose Auto or Customer label and in each flexible field, navigate to the Demographic options and select the category you prefer.
    3. Add text to the Prefix section as required
  2. Share the map with your constituent, non-subscribing map-audience
    1. Select the Map Share button, four buttons in from the left on the Master Toolbar
    2. Choose Public Sharing
    3. Check on “Enable Public Sharing, Copy the Map Link, be sure to click Apply Sharing Setting in the lower-right
  3. Make sure your non-subscribing audience has downloaded the Map App and understands how to access the Map Viewer App, which he or she will find in the Start Menu under MapBusinessOnline

Demographic Data Options

MapBusinessOnline’s Demographic data library is organized by year. Each year contains a wide section of Census Bureau (USA) data categories that cover population, ethnicities, income levels, housing data, expenditure data, and more.

Please keep in mind that the top two sections by year are projection data from a third party.  Census releases are updated as we get them from the Census Bureau. The most current Census Bureau release is 2018 data.

Read more about demographic data in MapBusinessOnline.

Calculated Data Columns

MapBusinessOnline users can also access demographic data from the Calculated Data Columns option, located in each map layer in Map and Data. This tool allows the user to sum a set of related demographic line times. For example, a user can build a Calculated Data Column calculation out of the population by age from ages 65 and up. This would include five demographic categories.  These results are then importable into map layer and territory labels and are then available for sharing.

Extending the Reach of Your Sales Territory Mapping

Publicly sharing an interactive MapBusinessOnline map enables businesses and non-prophet organizations to easily inform and update their constituents with relevant demographic and business data. Territory maps can be shared that display:

  • Current territory geographies defining areas of accountability
  • Progress toward shared company goals
  • Demographic components that makeup territory balancing
  • Account placements with key contacts within a territory scheme

MapBusinessOnline – We took MapPoint to the next level and beyond.  Explore what’s possible with the most affordable and reliable business mapping solution available today.

_______________________________________________________

Replace Microsoft Ma

Find out why over 25,000 business users log into www.MapBusinessOnline.com for their business mapping software and advanced sales territory mapping solution. The best replacement for Microsoft MapPoint happens to be the most affordable.

To access MapBusinessOnline, please register and then download the Map App from the website – https://www.mapbusinessonline.com/App-Download.aspx.

After installing the Map App, the MapBusinessOnline launch button will be in the Windows’ Start Menu or Mac Application folder. Find the MapBusinessOnline folder in the Start Menu scrollbar. Click the folder’s dropdown arrow and choose the MapBusinessOnline option.

The Map App includes the Map Viewer app for free non-subscriber map sharing.

Please read customer reviews and review us at Capterra, or g2crowd

Contact: Geoffrey Ives geoffives@spatialteq.com or Jason Henderson jhenderson@spatialteq.com
Posted in Business Mapping Software blog post, How to instruction | Tagged , , , , | Leave a comment

The Six Top Considerations When Creating a Business Map

What are the most important considerations when creating a compelling business map? Business mapping software generally includes a complete set of geospatial tools to help you create a beautiful business map, with a relevant array of corresponding analysis data.

These map creation tools include:

  • Draw tools for creating line, polygon, and circle map objects on your map
  • Search tools for querying data within a map object
  • Data import tools to import location points, which can then be symbolized, color-shaded, and queried
  • Map layers of city areas, countries, states, and ZIP codes that can also be color-shaded based on imported data or demographic libraries
  • Territory map creation options for sales accountability, staff tracking, and market analysis
  • Map layer look and feel controls over border, color fill, transparency, and label adjustments
  • Demographic data for further analysis and color-shading
  • Heat map assignment options for intensity of data display
  • Labeling options for data, map layers, and territories
  • Map Legend controls

All these tools and more were designed to create compelling and useful business maps for business professionals. But, in using the tools – in picking up a brush and painting a beautiful picture – what are the most critical considerations that ultimately lead to a compelling business map?

Get Clear on Your Map’s Purpose

Ask yourself, ‘What is my map project’s main purpose?’

  • Does the map describe a problem?
  • Will the map establish goals and objectives?
  • Does the map make a case for business expansion?
  • Will the map support strategic planning?
  • Will the map be viewed by the executive team and thereby have a potential impact on my reputation?

Each of the above map reasons, and other reasons, will lead you toward a map look and feel. For example:

Sales Goal Map – Sales data is going to be critical to this map, so you’ll be importing data and color-coding map layers based on imported sales activity.  These spreadsheets are usually customer or account address lists with additional data columns.  Map Legend adjustments will be important. Avoid superfluous data. Keep close to the point of your map.

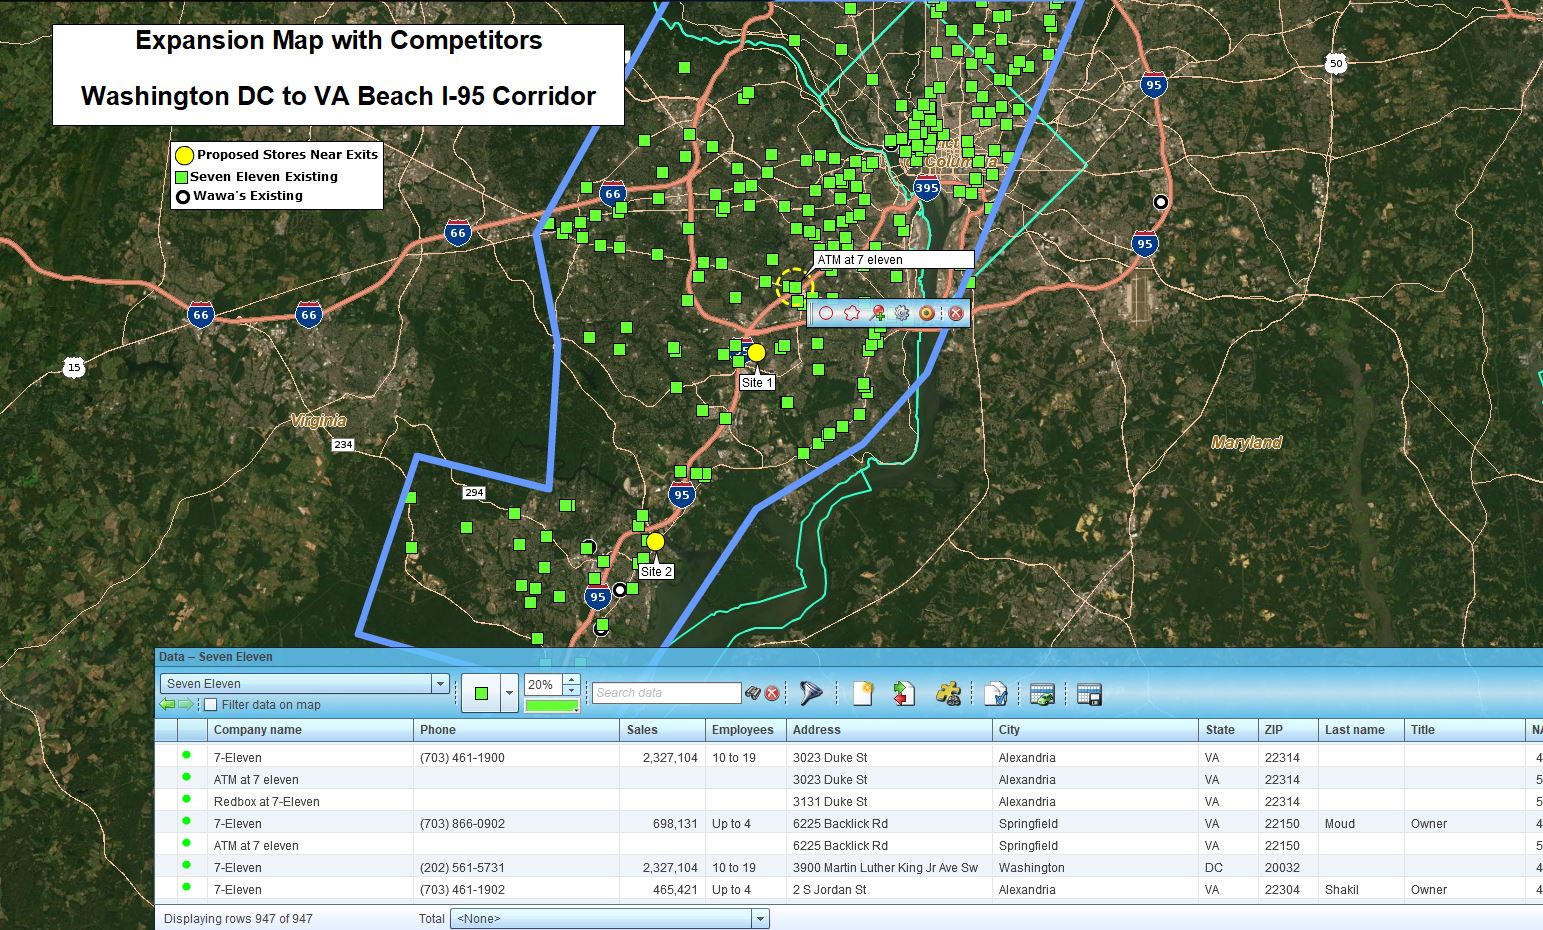
Competitor Mapping – You’ll want to import competitor store locations, representative home locations, or shipping/warehouse locations.  Remember address locations are more accurate than ZIP code only.

Non-profit Funding Campaign – Donor address lists will be important. Outreach campaigns will benefit from maps that describe direct mail campaign deliveries and responses. Even phone outreach can be tracked by ZIP code.

Maps the Executive Team Will Review – Remember, this audience is the most educated and critical of all possible map audiences. Take the time to get your map uncluttered and legible. Double-check spelling, file names, and eliminate superfluous information.

Your Original Map Idea – Your map could be a random weird business idea. Look for location-based data that supports your map intent. And follow all of the above and below advice.

Develop a Map Look and Feel

Focus on One Theme

With your map’s purpose front and center, create a business map that focuses on one major theme, such as:

  • The Sales Goal for 2021
  • Our Top Three Competitors in the Western Market
  • Untapped Areas of New Donor Potential

Too often, business map creators try to solve multiple business problems with one map.  Limit your map’s reason for being to one purpose. Solve world hunger with another map on another day.  Remember, you can save your map work as a Map Template in the MapBusinessOnline save dialogue. A map template preserves broad and repetitive map views as starter maps for new projects.

Maps are a visual medium. Use them to support specific business objectives. Too many data layers and map layers can dilute the benefit of a map presentation. Map viewers are easily distracted, especially today. I guarantee that every single American businessperson seated in a focused business meeting today spends 75% of their time thinking about personal, political, or societal issues and not on the business issue at hand. We’re all very easily distracted. Avoid adding to the cacophony by keeping it simple.

Select and Display Location Data to Support Your Map Intent

Selecting data means creating it or finding it. It could be sales data in your CRM system, or it could be that the data you require must be compiled from several other datasets. Do the research and get the requisite permissions to use and share the data.

Next, think about how to optimize that data for business map use.  Do you have thousands of data points that will look great as a dot density map – a map with lots of data points and obvious clusters of data? Or would your data be better served as color-coded ZIP codes? Think it through.

This decision may require some experimentation.  MapBusinessOnline can be used to import data by address, lat/long, or by map layer (ZIP code). The map creator can import location datasets and then try different symbolization and color-code schemes until he or she lands upon the best representation of imported business data. Ask a trusted associate for their opinion. Remember, simple is better. Don’t give map viewers a reason to lose focus or focus on ‘errors’ in your map presentation. You know the guy in your audience I’m talking about…

Use the Map & Data toolkit to Optimize Your Business Map Look and Feel

With data imported into your business map, it’s time to optimize the way your business map looks. Using the Map & Data box, that floats over your map view, click the Edit Map Layer Properties gear for each map layer that is checked on.  Adjust these critical elements for each map layer:

  • Darken or lighten map layer boundary lines. Adjust the boundary thickness to your liking, keeping in mind that extra thick boundaries should only be used to focus attention on an area
  • Try different fill color shades to see which ones complement your business map look
  • Adjust the Fill Transparency of all map layers to your liking. Leave fill unchecked for the State layer unless using the State layer for territories. Keep in mind, large layers, with opaque transparency settings, will block more granular layers like ZIP codes or Census tracts
  • For Territory Layers – In the Territory General map option check internal boundaries unless viewing internal boundaries are essential to your map intent
  • Tweak Label options – The Label Tab offers an array of settings for labeling. Tweak colors, sizes, and bolding to your liking. Add or aggregate data into the five flexible label fields as benefits your map intent

Declutter Your Map

You’re are getting close to a finished map now.  Don’t rush to present it.  Sit back and look at your map. Is the map too cluttered? Consider the following adjustments to fine-tune that map look and feel:

  • Does your map require all the map layers currently turned on? ZIP codes can add quite a lot of clutter to a map. Make sure you need them.  Ask yourself if the map layers you have selected add value to your map viewer
  • Is your background map necessary? To new users, this may seem like a silly question, but if the map is about a specific business issue that isn’t focused on a particular area or region, consider turning off the background map to simplify things
  • Are your labels succinct and spelled correctly? Can map viewers see and read your labels? Map labels are used to provide critical information. Do not fill them with minutia or random text. Watch out for imported file names: “DougsStupidList.xls won’t look good as your imported dataset label. You can easily change that in MapBusinessOnline

Know Your Map Audience

Finally, know your map audience. If your map is to be presented to the executive team, keep your map content at a high level.  Feed that audience only the detail they require.  If you don’t know, ask.  The last thing a map creator should do with an opportunity to present before the executive team is to bore or confuse them.

On the other hand, if you present a well thought out map, with a clear purpose and clearly notated data, your executive team will remember you and your map work, and you will be forever labeled a Map Geek. Wear that badge with pride.

Lastly, if your business map presentation before the board is bad news get your map all set up and then ask Jim to present it because ‘Your Nana called and she needs a ride to the hospital, stat.’

MapBusinessOnline business mapping software for PC or MAC.

_______________________________________________________

Replace Microsoft MapPoint with MapBusinessOnline Standard. The industry’s best MapPoint Replacement.  Try MapBusinessOnline – business mapping software for PC or Mac.

_______________________________________________

Find out why over 25,000 business users log into www.MapBusinessOnline.com for their business mapping software and advanced sales territory mapping solution. The best replacement for Microsoft MapPoint happens to be the most affordable.

To access MapBusinessOnline, please register and then download the Map App from the website – https://www.mapbusinessonline.com/App-Download.aspx.

After installing the Map App, the MapBusinessOnline launch button will be in the Windows’ Start Menu or Mac Application folder. Find the MapBusinessOnline folder in the Start Menu scrollbar. Click the folder’s dropdown arrow and choose the MapBusinessOnline option.

The Map App includes the Map Viewer app for free non-subscriber map sharing.

Please read customer reviews and review us at Capterra, or g2crowd

Contact: Geoffrey Ives geoffives@spatialteq.com or Jason Henderson jhenderson@spatialteq.com
Posted in Business Mapping Software blog post, How to instruction, Sales and marketing | Tagged , , , | Leave a comment

Adobe Flash Player Ending this Month! Download the Map App

This is it. December 15th is the day when access to MapBusinessOnline is no longer supported by the Adobe Flash Player platform. For a variety of reasons Adobe Flash Player is ending and all cloud-based software programs that use Flash Player must provide alternative access methods. Read more about Adobe Flash Player ending from Microsoft here.

Adobe Flash Player is ‘plug-in’ software that allowed web browsers like Google Chrome, Internet Explorer, Safari, Mozilla Firefox, and other less popular browsers to run a variety of software programs within a web browser.

Here at MapBusinessOnline, we used the cancelation of Adobe Flash Player as an opportunity to improve our online business mapping software service.  All MapBusinessOnline users should download and install the Map App which will provide direct access to the usual MapBusinessOnline user interface and all the geospatial software tools our users are used to.

We estimate about 90% of MapBusinessOnline users have already made the transition to the Map App based on the newsletter articles and emails we’ve been publishing over the last few months.

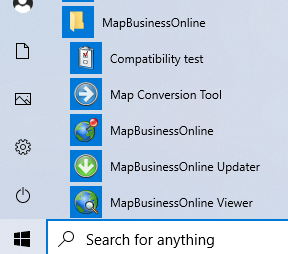
The Map App will download quickly. Users should click on the downloaded package and install the Map App.  Windows 10 users will find the MapBusinessOnline launch button in the Windows Start Menu in the lower-left corner of your PC or laptop.  Mac users will find the application loaded in the applications folder.  I drag the launch icon to my Windows taskbar for easy launching every morning.

MapBusinessOnline users will notice several other launch icon options in the downloaded MapBusinessOnline Map App section of the Start Menu or Mac Applications Folder:

  • Compatibility Test – a tool to help diagnose software issues if and when they occur
  • Map Conversion Tool – A tool for ex-Microsoft MapPoint users to convert MPT files to MapBusinessOnline map projects
  • MapBusinessOnline – Click to launch MapBusinessOnline
  • MapBusinessOnline Updater – Use this button to access updates to the software moving forward
  • MapBusinessOnline Viewer – Your non-subscribing Map Viewers can users can access publicly shared MapBusinessOnline maps using this button, In fact, as long as they’ve downloaded the Map App, just clicking an emailed map URL link will launch MapBusinessOnline

Here’s what the Map Viewer should experience.

Start Menu Access to the Map App

Same MapBusinessOnline User Interface

To be clear, after launching from the Map App MapBusinessOnline will look and perform the same as it always has. Saved maps will be located in the saved Open Map Folder – the second button in from the left on the Master Toolbar.

MAKE SURE TO SAVE YOUR CURRENT MAP WORK BY CLICKING THE SAVE MAP BUTTON BEFORE YOU SHIFT TO THE MAP APP ACCESS

That’s because web browsers always cache or store the last session of any user’s web experience. This situation has meant your MapBusinessOnline line map work from the night before would be there in the morning at login, cached in the web browser.  These cached map views were never officially saved in MapBusinessOnline until the user clicked the Save Map button.

That first time you login through the Map App, your map will not be there waiting for you. As long as you saved your work by clicking the Save Map button, your map work will be in the Open Map Folder waiting for you after you’ve logged in through the Map App.

Simply click the MapBusinessOnline icon to launch MapBusinessOnline.  Once again, all saved maps will be found in the Open Map Green File Folder button on the Master Toolbar.  MapBusinessOnline opens as an independent, non-browser software application.  MapBusinessOnline remains a cloud-based application that requires an Internet connection.

For non-subscribing Shared Map Viewers, have your map viewers download and install the Map App.  When you send them an email with a Map Share link, the application will launch as soon as your map viewers click the emailed link.

Once logged in, your MapBusinessOnline experience will be the same or improved through the Map App. Improvements include:

  • Faster data uploads
  • New vector map background options for improved map resolution for general mapping and PDF map print outs
  • Fewer web browsers headaches like Chrome freezes and Internet Explorer meltdowns
  • Drag the MapBusinessOnline launch icon to the Task Bar for a quick launch button

Technical Support is Available

Support for MapBusinessOnline and the Map App is available through Chat, email, or Call-ins.  Click on the contact button on the website or ask a question on the Chat service.

We now return you to our regularly scheduled blogs on Radius Mapping, Sales Territory Mapping, ZIP code maps, and general map geekiness.

_______________________________________________________

Replace Microsoft MapPoint with MapBusinessOnline Standard. The industry’s best MapPoint Replacement.  Try MapBusinessOnline – business mapping software for PC or Mac.

We recommend users access MapBusinessOnline via the downloadable Map App.

The Map App installation is fast and easy. The Map App is a cloud-based service. Once you’ve logged-in you’ll have access to all of your previously saved maps and data. The Map App is a better user experience and provides access to more features than the Web Map access. The Flash-based Web Map link will remain available until December 15, 2020.

The Map App includes the new Map Viewer app for free non-subscriber map sharing.

Value-Added Resellers – Offer the tool to your customers as a reseller. Make money on training and consulting. Contact us with further interest in reselling MapBusinessOnline.

Posted in Business Mapping Software blog post, How to instruction | Tagged , , | Leave a comment

7 or 8 New Ways to Use MapBusinessOnline Business Mapping Software

MapBusinessOnline is a very versatile tool. You may not realize just how versatile if you came to MapBusinessOnline seeking a specific geospatial solution and quickly satisfied your requirement.

Many new business map users are unfamiliar with online business mapping software altogether. Such users often come to MapBusinessOnline for a particular feature among the many offered. Perhaps one of these:

  • Sales territory mapping
  • Sales planning tools
  • Optimized vehicle routing
  • Customer visualizations
  • Map visualizations
  • Radius maps
  • ZIP code maps

Learn More About Radius Maps

New business map users are generally successful at achieving their goals with MapBusinessOnline. Many users achieve their objectives without requiring assistance.  Others find our chat, email, or phone support helpful in getting things moving.

Once you’ve achieved your goals by applying a particular business mapping feature, remember to consider MapBusinessOnline for other uses. No, we can’t potty-train the puppy or fix the dishwasher, but MapBusinessOnline may help solve additional business problems.

By using the My Templates dropdown option in the Save Map dialogue, as opposed to the My Map option, your business map work becomes available for fast and accurate repurposing. My Template maps are a great way to protect important map work and provide access to those maps for other uses. That complex territory map holds a lot of data that could be pertinent to additional business needs across the organization, such as:

  • Strategic Planning – The C-suite team may want to use your sales territory map as a base map for strategic planning for next year. Open that saved map template and add a few critical text boxes and perhaps a couple of new datasets. Now your company’s strategic plan meeting could include a map visualization session focusing on what’s possible over the next few years
  • Full-Featured Market Analysis – Based on your experience creating a sales territory map, your business can now quickly access market analysis maps of potential new markets for existing or future products. Those same tools used to analyze a territory are perfect for new Market Analysis. Just change how you look at territory maps. Call them area of interest maps and overlay demographic data, business listings, imported customer data, and any other location-based resources. Maps of territories are maps of specific markets
  • Fielded-Staff Planning – Where do your field staff of clinicians and/or technicians start their day? Where are all your customers or patients located? Import the address datasets containing home locations for all your customers and traveling reps. These map visualizations represent your organization’s area of activity. Coverage area maps, overlaid with a list of daily tech visits by address, can open your eyes as to how efficient and effective your mobile team is and could someday become

From Outlier to Company-Wide

Some companies start small. Like when a single salesperson decides to use MapBusinessOnline to organize his or her daily schedule. We’ve got lots of independent Sales Reps using the tool to manage their customer calls:

  • Customer Maps – Import address-based spreadsheets of customer locations and sales activity exported from the company CRM software
  • Territory Maps – Single-use sales reps often create maps of their territory assignments using MapBusinessOnline
  • Optimized Routing – Generate efficient sales call route maps to organize day-to-day travel while controlling company expenses

Eventually, they share a map with a work associate and the news spreads that maps are a great way to expand the use of a CRM and to organize day-to-day travel activity.  Customer maps and territory maps become part of the company sales process. And even folks who leave the company remember MapBusinessOnline at their next place of business. We get these calls all the time, “I used to be a MapBusinessOnline user at a previous employer. I want to bring the same functionality to my new company.”  (And keep in mind, MapBusinessOnline does reward referrals that lead to orders.)

Other business mapping application your company could find useful:

  • Concentric circle maps – Concentric circles – circles within circles – can be used to define delivery and service radii for your customer base. Concentric circles display the demographic makeup of drive time areas of interest created at a specified distance from a central point. These drive time areas could represent store delivery areas, medical-facility patient served areas, or workplace commute zones
  • Coverage area maps – Define and display the service areas your business will support as an overall ZIP code, city limit, or county map
  • Demographic analysis maps – Compare your organization’s collective business acumen with the demographic realities of where you do your best business. The chances are, this information will inform future business decisions as your company seeks to grow

Don’t limit your understanding of business to just spreadsheets and expensive ‘experts.’  Import your business location data into a business mapping application today and start understanding the where and why of your business reality.

If you’ve got data with addresses or lat/long coordinates – you can map it.

If you are aware of a general area where you do business – you can map it.

If your people have a sense of who buys your product – you can look for those customers on a map.

Use your first business map as a jumping-off point to expanding your location-based intelligence. Who knows, your use case could turn out to be a whole new category of business mapping.

_______________________________________________________

Replace Microsoft MapPoint with MapBusinessOnline Standard. The industry’s best MapPoint Replacement.  Try MapBusinessOnline – business mapping software for PC or Mac.

_______________________________________________

Find out why over 25,000 business users log into www.MapBusinessOnline.com for their business mapping software and advanced sales territory mapping solution. The best replacement for Microsoft MapPoint happens to be the most affordable.

To access MapBusinessOnline, please register and then download the Map App from the website – https://www.mapbusinessonline.com/App-Download.aspx.

After installing the Map App, the MapBusinessOnline launch button will be in the Windows’ Start Menu or Mac Application folder. Find the MapBusinessOnline folder in the Start Menu scrollbar. Click the folder’s dropdown arrow and choose the MapBusinessOnline option.

The Map App includes the Map Viewer app for free non-subscriber map sharing.

Please read customer reviews and review us at Capterra, or g2crowd

Contact: Geoffrey Ives geoffives@spatialteq.com or Jason Henderson jhenderson@spatialteq.com
Posted in Business Mapping Software blog post, Sales and marketing | Tagged , , , | Leave a comment

How Business Maps Add Value to Almost Any Industry

Glancing at our long list of MapBusinessOnline subscribers is like reading a Who’s Who list of North American businesses. Like Elaine Benes of Seinfeld, I don’t want to ‘name names or name names,’ but the list is quite comprehensive. If I search our CRM by a domain name, it’s pretty much guaranteed I’ll find a MapBusinessOnline registration for an existing or former employee of almost any major company.

Such ubiquity is both comforting and inspirational to a salesperson because it speaks directly to the value MapBusinessOnline brings to almost any major industry client. The tool is easy, it’s affordable, and it covers the bases for business mapping software.

Sales Planning & Optimized Routing

For example, lately, I’ve noticed quite a few companies using MapBusinessOnline for routing and sales planning. While this again is no surprise to me, the number of users applying MapBusinessOnline for  routing seems to have shot up largely due to the demise of Microsoft MapPoint.

MapPoint software was packed with much more than just mapping. Microsoft beefed up their offering with low-cost API/SDK development tools that enabled the creation of advanced and very customized routing tools. Many businesses built their routing business models on top of MapPoint. When MapPoint went away, these companies lost that vehicle route scaffolding and had few options that cost less than $10,000 a year to implement and operate.

A few of these MapPoint routing refugees have signed up for MapBusinessOnline, but our tool is not a Fleet Management system or multi-truck routing software. MapBusinessOnline optimized routing tools provide businesspeople with 150-stop routing for one vehicle at a time. I feel bad for ex-MapPoint users who have to find a routing system replacement. MapBusinessOnline will do it nicely for one salesperson at a time. Even our free map viewer allows 150-stop routing. But for routing and tracking multiple vehicle fleets, try RouteSmart.

Murderous Mapping

The term ‘map visualization‘ may sound somewhat redundant. A map is a visual tool, but the idea that location-based business data can be accurately laid over a map of the world for analysis, while not a novel idea, can provide a completely new perspective on any business model.

These murders, committed by the London Strangler and Jack the Ripper were not  solved by a business map.  However, your business problems can benefit from just such a business map. Business maps are eerily similar to the murderous map visualizations depicted in the link above.

As an example,  a convenience store retailer sales for specific products across a city landscape show stocks-outs of specific products dues to unanticipated sales. A thorough analysis of all related products sold reveals some store locations that sell these products are completely out of stock, while others haven’t sold any.

Convert sales location records into a heat map visualization that describes product-sales across an urban area. These map views offers a detailed analysis of product-sales. A basic map visualization can be overlaid with even more related data, including:

  • Demographic data describing ethnic, age, or income-related population statistics by ZIP code
  • Drive time statistics indicating how far a storefront may be from local parks or popular event centers
  • Specific places of business that compete with the product under review – see Business Listings
  • Internal company sales records geocoded by address or latitude/longitude coordinates

In this way, a map visualization becomes map analysis. The ice cream that sells out in three out of four neighborhoods becomes the centerpiece for a new map-based selling campaign. Inventories in non-selling stores can be pulled to support the campaign. Best of all, no one got murdered. At least as far as we know.

Retail Market Analysis & Expansion Planning

The Health of the Nation

Organizations dedicated to healthcare abound in the MapBusinessOnline customer base. Thank God for every one of these businesses. We need and appreciate healthcare workers so much these days. MapBusinessOnline is proud to support thousands of healthcare organizations around North America.

Tracking COVID-19 outbreaks requires patience and diligence. MapBusinessOnline maps enable easy imports of location-based spreadsheets of contacts by address or latitude/longitude coordinates. Further, for true contact tracing, MapBusinessOnline can provide the additional analysis tools necessary to track, log, and follow-up on people exposed to the virus.

But don’t stop with contact tracing. Business mapping tools can combine contact tracing, staff management records, and CDC virus data to provide a theater view of the situation as it unfolds, day-to-day.

Here in Maine, restaurants keep a tally of in-house customers by phone number. In the event of a related COVID-19 outbreak, contact tracers trackback the activities of the infected diners. All eateries involved will be able to reference the phone numbers of diners who later present symptoms and get diagnosed.  People who may have been exposed can then be contacted and quarantined.

By correlating the phone numbers of exposed diners, employees, and other impacted folks, through a map-based spatial search, addresses are quickly compiled. Business mapping tools provide the perfect platform for mapping these exposure events and elevating attention to areas of high risk for the surrounding community.

Business mapping software is especially effective at tracking long-distance exposures – as people travel around the nation. Contact databases can be symbolized and color-coded to reflect contact status, as well as risk rankings. In MapBusinessOnline, a risk ranking calculation could be developed from the contact data that examines the total number of people exposed, the rough time exposed, and compares this to the risk factors of each contact:

  • Number of comorbid medical complications
  • Age
  • Ethnicity
  • Blood type

By indexing these factors, a risk ratio factor can be applied to the map and color-coded accordingly.

The Wealth of the Nation

Continuing our review of MapBusinessOnline supported industries, banks, insurance, and finance organizations use MapBusinessOnline map visualizations for a variety of applications. Some finance businesses use the tool for typical sales planning operations:

  • Customer visualizations
  • Sales travel routing
  • Sales territory management

Banking industry map users turn client map visualizations into full market analysis at just a few mouse clicks. Return on investment-focused bank customers will want to virtually explore the areas surrounding their investment properties. They’ll be interested in demographic characteristics of neighborhoods, housing value statistics, as well as local amenities, among other critical buyer requirements.

Banks like business maps because they make it easy to assess risks and opportunities.

For similar reasons, financial services like to use map views as a way to show clients a fuller picture of a property’s features, benefits, and possible pitfalls. Map visualizations may be lenses of truth for wealth-related industries:

  • Reals estate map users paint a rosy picture of property values and future sales potential
  • Bank industry map users develop cautionary map images reflecting risks and encroaching crime areas
  • Insurance claim users build insurance maps that display storm damage and property values at municipal tax values

Regardless of the picture you want to paint, business maps provide the pallet upon which you can hang your image. A business map may incorporate all kinds of input and order the world to your liking.

_______________________________________________________

Replace Microsoft MapPoint with MapBusinessOnline Standard. The industry’s best MapPoint Replacement.  Try MapBusinessOnline – business mapping software for PC or Mac.

_______________________________________________

MapBusinessOnline access has officially transitioned from Web Browser (Adobe Flash Player) access to the Map App download access.

  • Please download the Map App from the website – https://www.mapbusinessonline.com/App-Download.aspx.
  • After installing the Map App, the MapBusinessOnline launch button will be in the Windows’ Start Menu or Mac Application folder. Find the MapBusinessOnline folder in the Start Menu scrollbar. Click the folder’s dropdown arrow and choose the MapBusinessOnline option. You can drag the Icon to the task bar for a quick launch button.
  • All saved maps will be available through your Map Library Folder, the second button in from the left on the Master Toolbar. (Green File Folder icon.)

Map App access to MapBusinessOnline.com provides enhanced features and a better user experience.

The Map App includes the new Map Viewer app for free non-subscriber map sharing.

Value-Added Resellers – Offer the tool to your customers as a reseller. Make money on training and consulting. Contact us with further interest in reselling MapBusinessOnline.

Find out why over 25,000 business users log into www.MapBusinessOnline.com for their business mapping software and advanced sales territory mapping solution. The best replacement for Microsoft MapPoint happens to be the most affordable.

Contact: Geoffrey Ives geoffives@spatialteq.com or Jason Henderson jhenderson@spatialteq.com


Posted in Business Mapping Software blog post, Sales and marketing | Tagged , , , | Leave a comment

General Guidelines for MapBusinessOnline Territory Mapping

MapBusinessOnline sales territory mapping is easy to use. Our sales territory alignment tools are designed to be accessible by any businessperson. These tools are similar to Microsoft’s MapPoint mapping software, canceled at the end of 2014.

That said, online business mapping software has rules of the road that help build compelling, well-defined sales territories.

Alignment Map Layer

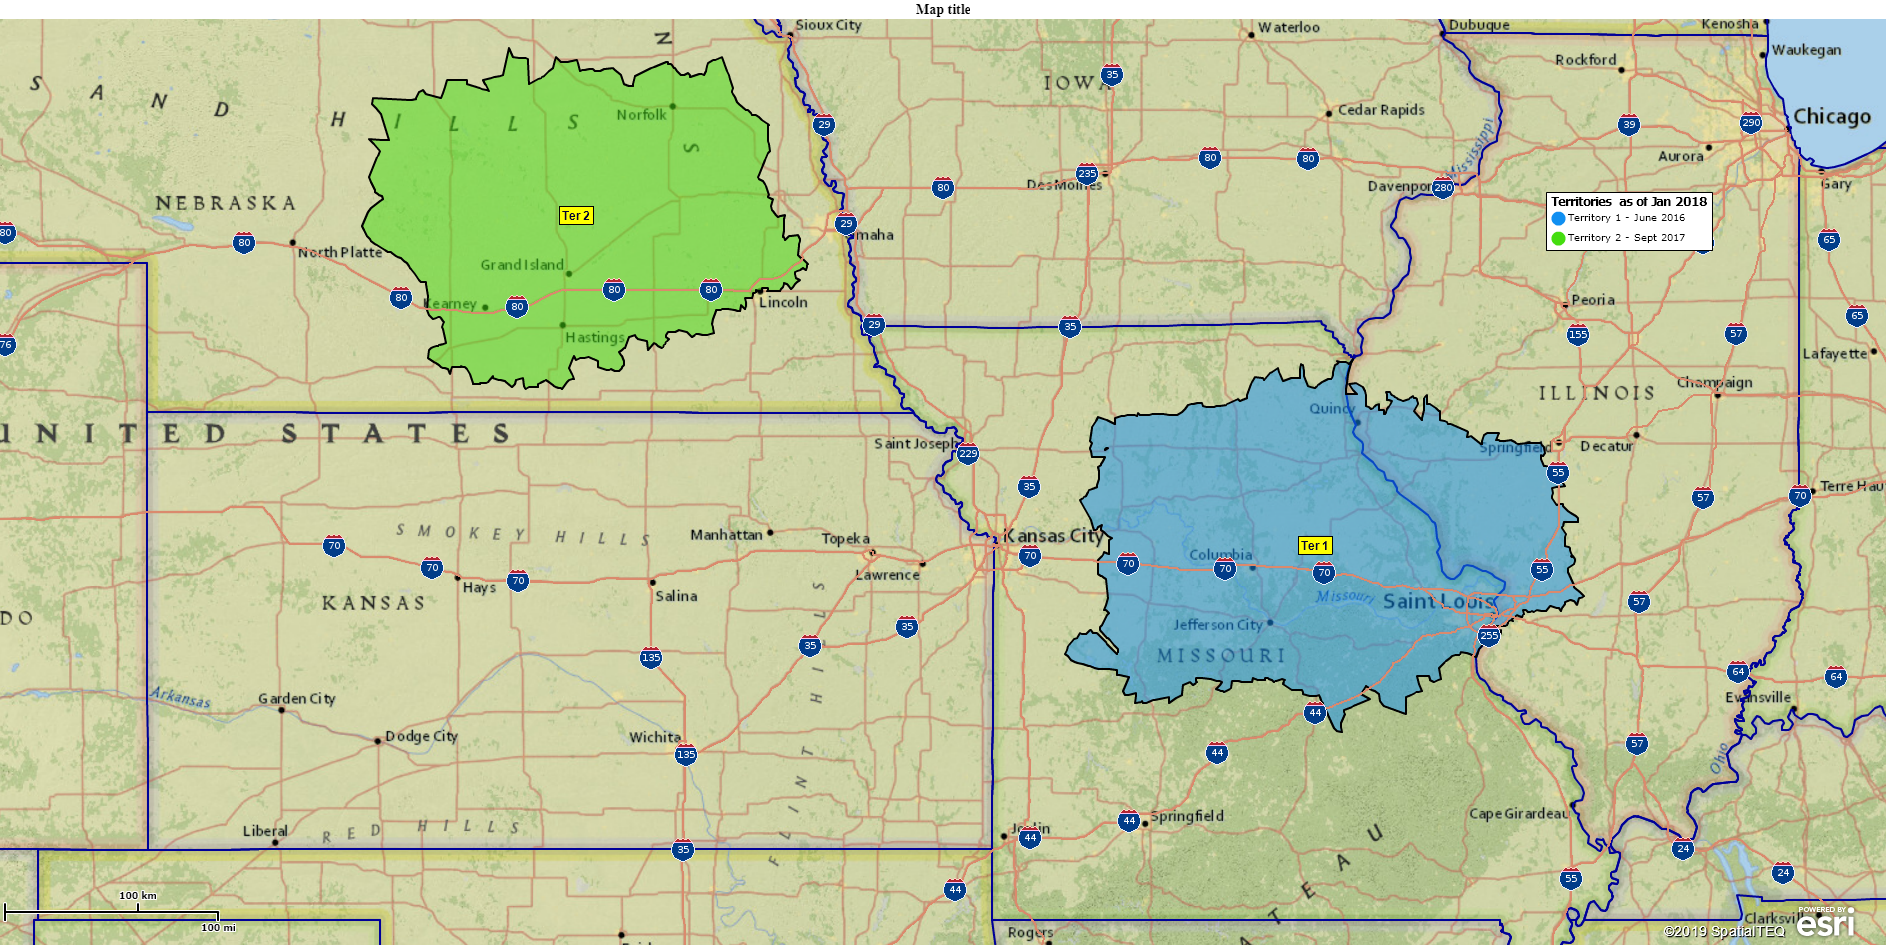
MapBusinessOnline sales territories are based on alignment map layers – ZIP codes, counties, states, and city limits.  There are two ways a user creates territories:

  1. Lasso using a polygon draw tool
  2. Data import of a territory spreadsheet

The user can lasso an area with a polygon tool to gather ZIP codes or other map alignment layer objects.  A user could also import a spreadsheet of districts like ZIP codes or counties. Either way, the user gets a territory based on a map layer.  Read more about sales territory creation.

One territory rule is, territories are created based on one alignment layer at a time. The territory map creator cannot combine State and County or County and ZIP code layers within the same territory.  Thus, if you want to change a State-based territory, to make the state area smaller or straddle state lines, you’ll need to reconstruct that territory out of counties or ZIP codes.

The above noted map layer constraint means, for example, a multi-state sales territory map is better served if the map layer applied is counties or ZIP codes rather than states because that provides more flexibility for area adjustments over time. Like life, most territory maps are not set in concrete. Things tend to change and territories should too.

While this can seem frustrating to a new user, territory creation is a quick process to master and takes just a minute or two to reassess a territory scheme.

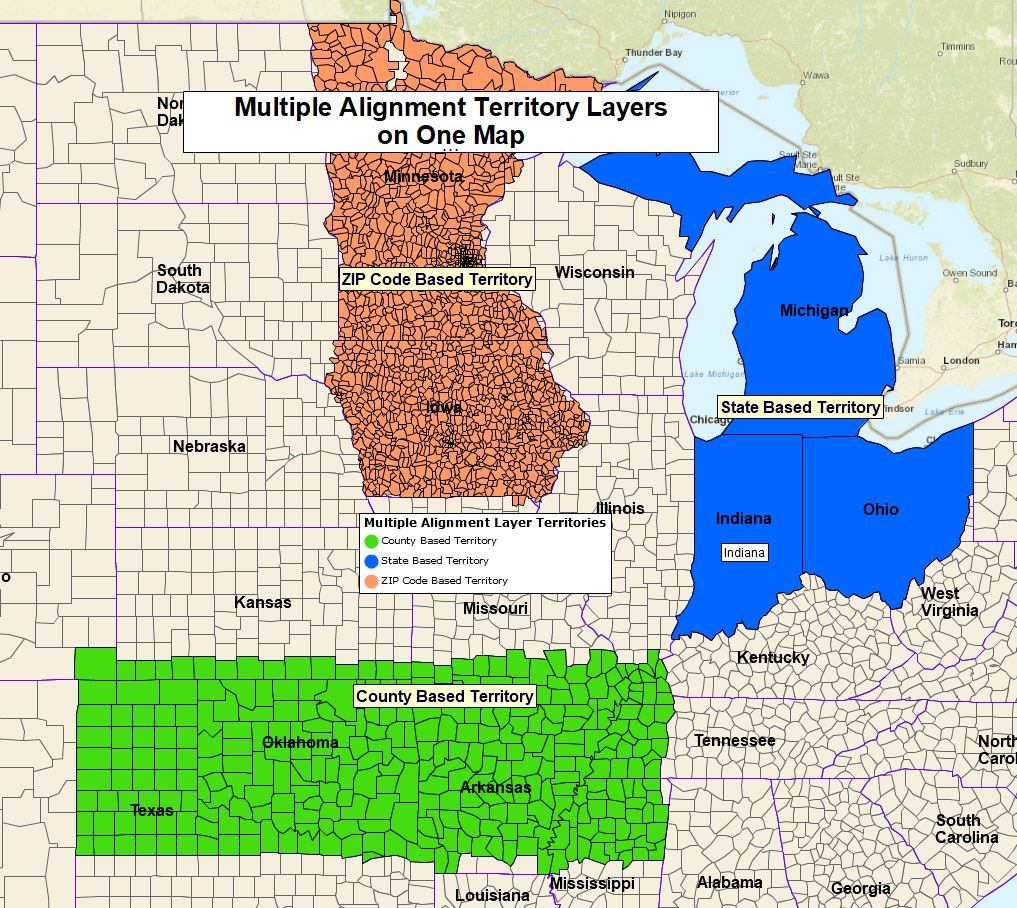
A territory map can contain more than one type of map layer-based territory.  You could have an overall territory map that includes both county-based and ZIP code-based territories. That is, you can have two territories based on different map alignment layers, but you can’t have two alignment layers in the same territory. Multi-alignment layer per allowance map can be helpful for businesses that cater to both urban and rural customer-bases like home care agencies or delivery services.

While the software does include draw tools, it does not provide a method for designating highways and terrain features as territory boundaries. This blog describes the challenges of non-alignment layer territory mapping.

MapBusinessOnline does provide additional territory map alignment layers you can add to your map from the Add Map Layers button. Additional layers that can be used for territory creation include Census tracts, MAS’s, school districts, and congressional districts.  Try building territories on the City Limits layer or the Census Tract layer.

Edit Your Territories

MapBusinessOnline includes a list of territory editing tools that make it easy to adjust your territories after you’ve created them:

  • Edit a territory map by selecting a ZIP code, county, or other map alignment layer target with your mouse cursor. Hold down the shift key to select more than one. Once selected, click the Blue Puzzle Piece icon and choose the required action – remove, update, add to, etc.
  • Select the Territory Name and click the associate toolbar’s Properties Gear to adjust territory color, territory name, or to format territory labels
  • Label formatting allows the map editor to add demographic data or imported data, like sales numbers, to the territory flex fields. All demographic segments can be summed into these territory and map layer label fields. For example, a territory made up of five ZIP codes will display the sum of the population for those five ZIP codes in a territory label flex field. You have five flex fields you can add data to. This is a powerful way to display relevant territory data

Here’s a video on editing territories.

Your Map’s Look and Feel

The Map and Data box holds the key to map look and feel when it comes to territories. Hover your mouse cursor over the Territory layer in Map and Data.  Here you’ll find controls over border color and thickness and fill color. Adjustments to label font sizes and color can be made through the Map and Data box. This is where you can make your map appear more professional, or, if you prefer, more whacky and cluttered.

Remember your territory map is just one aspect of your business. Don’t try to solve too many problems with just one map. Read more about making a business map look professional.

Analyze Your Territories

As each sales territory is created, the process opens the Data Window territory view.  This analysis view allows the user to open a simple database management tool by clicking the Choose Columns button in the lower right of the panel. I have written a recent blog about the analysis capabilities of MapBusinessOnline sale territory mapping. It’s an easy database tool to master that provides a wealth of information about your territories.

Territory analysis views allow the map creator and the map viewer to consider their territory’s metrics.  Every company bases its territory measurements on their particular industry metrics. Restaurants like to see the quantities of population and household segments. Retailers like household income data. Homecare agencies and franchises adore the 65-and-up age segments. Large manufacturing concerns may be focused on more industry-specific metrics, some of which you can derive from MapBusinessOnline business listings.

MapBusinessOnline provides access to multiple data layers that may be relevant to your territory analysis. All location-data layers (once imported) can be accessed from the Data Window territory analysis view.  They include:

  • Demographic Data – USA Census demographic data, USA projection data (most recent two years in the list of Demographic Data), and Canadian demographic data
  • Business Listings – NAICS/SIC industry code business listings. These are paid for data downloads using the Yellow Pages Icon button on the master toolbar
  • Imported business data – Typically sales data, this data could be any numeric business datasets available for your analysis

Regardless of the relevant location-data driving your product sales, import this information into your MapBusinessOnline territory analysis view and give the data some thought. Look for trends. Compare an area you are familiar with new areas of interest around the country. Do some analysis. You’ll be a better, smarter human being if you do.

Multiple Alignment Layers Across One Territory Map

Other Pertinent Territory Issues

Upper Limit – The maximum number of territories one can build with a MapBusinessOnline subscription is 1,000. Let us know if you reach this cap.

Color-Code Your Territories – Territory maps can be color-coded based on thematic data, just like any other MapBusinessOnline map layer. These tools are available in Map and Data or by clicking the Three Puzzle Piece icon button on the master toolbar.

Territory Overlap – MapBusinessOnline addresses overlap in the Map and Data territory settings.  Territory map creators can assign specific colors to areas of overlap. Map creators typically apply bright or dark colors that standout and alert the map viewer that overlap exists in the territory scheme under review.

Exporting All ZIP Codes from a Territory – ZIP codes come in two flavors – Boundary ZIP codes and Point ZIP Codes. To export all possible ZIP codes across a territory or all of your territories, you need to import the Total ZIP Code layer available through MapBusinessOnline Public Data.  Read more here.

Several other recent blogs may be helpful as you learn more about sales territory mapping:

_______________________________________________________

Replace Microsoft MapPoint with MapBusinessOnline Standard. The industry’s best MapPoint Replacement.  Try MapBusinessOnline – business mapping software for PC or Mac.

_______________________________________________

MapBusinessOnline access has officially transitioned from Web Browser (Adobe Flash Player) access to the Map App download access.

  • Please download the Map App from the website – https://www.mapbusinessonline.com/App-Download.aspx.
  • After installing the Map App, the MapBusinessOnline launch button will be in the Windows’ Start Menu or Mac Application folder. Find the MapBusinessOnline folder in the Start Menu scrollbar. Click the folder’s dropdown arrow and choose the MapBusinessOnline option. You can drag the Icon to the task bar for a quick launch button.
  • All saved maps will be available through your Map Library Folder, the second button in from the left on the Master Toolbar. (Green File Folder icon.)

Map App access to MapBusinessOnline.com provides enhanced features and a better user experience.

The Map App includes the new Map Viewer app for free non-subscriber map sharing.

Value-Added Resellers – Offer the tool to your customers as a reseller. Make money on training and consulting. Contact us with further interest in reselling MapBusinessOnline.

Find out why over 25,000 business users log into www.MapBusinessOnline.com for their business mapping software and advanced sales territory mapping solution. The best replacement for Microsoft MapPoint happens to be the most affordable.

Contact: Geoffrey Ives geoffives@spatialteq.com or Jason Henderson jhenderson@spatialteq.com
Posted in Business Mapping Software blog post, Sales and marketing | Tagged , , , | Leave a comment

5 Helpful Improvements to Location Data Imports Using MapBusinessOnline

Importing location-based or address-based data into MapBusinessOnline is a regular activity for almost every user. Importing data is easy to accomplish.  We try to keep things simple, but importing location data is still a process that entails the following basic steps:

  1. Clicking the “Add to the Map – Dataset” button on the master toolbar,
  2. Navigating to your data target is stored on your machine or network and selecting the data
  3. Processing the data through the import wizard, making sure Address, City, State, and ZIP Code in your imported data appropriately matchup to the application’s location buckets

These steps are straight forward, especially for people who’ve imported their own business datasets into other applications before. Online business mapping software is no different. But to help those who get a little nervous about location-data and address spreadsheets, we published a blog describing how to prepare your datasets for import.

Importing data is critical to the construction of customer mapping, competitor mapping, and sales territory mapping.

The Geospatial Mystique

Mapping and geospatial are technical terms that are practically synonyms. Like the words ‘meat’ and ‘beef’, they refer to the same subject – beef just carries a little more savoir-faire. (Although geospatial was not a word imposed by William the Conqueror.)

Just to de-mystify some geospatial terms for newbies, here’s a glossary of terms that intimidated me when I was but a wee-geo-pup:

  • Compass Rose – A map feature that generally tells the map viewer the North orientation on a map and may include other information, like distance scales
  • Geocoding – The process of importing location data and plotting points on the map
  • GIS – An acronym for Geographic Information System software, better described as mapping software for business and science. Esri.com is the big Kahuna in the GIS industry.
  • Location Data – Spreadsheet data that includes location components such as an address, city, state, and ZIP code columns. Location data could also be spreadsheets with Latitude and Longitude columns, a list of ZIP codes, the infamous ‘little black book’ of 1960’s bachelor fame. Sometimes referred to as spatial data
  • Navigation Scroll Bar – A digital map tool the enables zooming in and zooming out around a center point. In MapBusinessOnline, the navigation scroll bar is in the upper right corner of the map rectangle
  • Radius Search – Within a digital map, use a circle drawing tool to create a circular area within which you can search for data. Radius search is one kind of spatial query
  • Spatial Query – Any map-based search for data within a drawn shape or administrative district like a ZIP code. Read more about spatial queries here. Synonym phrases include spatial search, geo-search, and geospatial query. A common application of a spatial query is an internet search for the nearest Starbucks
  • Map Geek – See your reflection in a mirror. If you find yourself enjoying your map work, it’s you, my friend

Keepin’ it Easy

To no one’s surprise, I’m often import data into a business map for my work. Repeat data imports help you get familiar with how importing location data works. Map users have options when it comes to importing spatial data.

With my COVID-19 map updates, I repeatedly download nearly identical data every other day. The data is very well attributed with address information. I simply download that data to my Laptop and then import it into MapBusinessOnline. Because the data is well attributed, meaning the addressing is complete, accurate, and consistent, I just click Plot and let the data roll in. I don’t bother going through all the address mapping in the import wizard because I know it will work based on my experience. After it plots, I click Done and move on to my next mapping operation.

If you know your data and your map, you may not have to manually map each address component to the import wizard.

Updating Imported Data

Sometimes a map creator may repeatedly import an updated spreadsheet.  The original spreadsheet should include a Unique ID column to enable fast and easy updates with no need to reimport the spreadsheet. Instead, in Map and Data, just click the Edit Gear associated with the layer and the Click Update Dataset from File. Read more about the use of Unique ID Columns here.

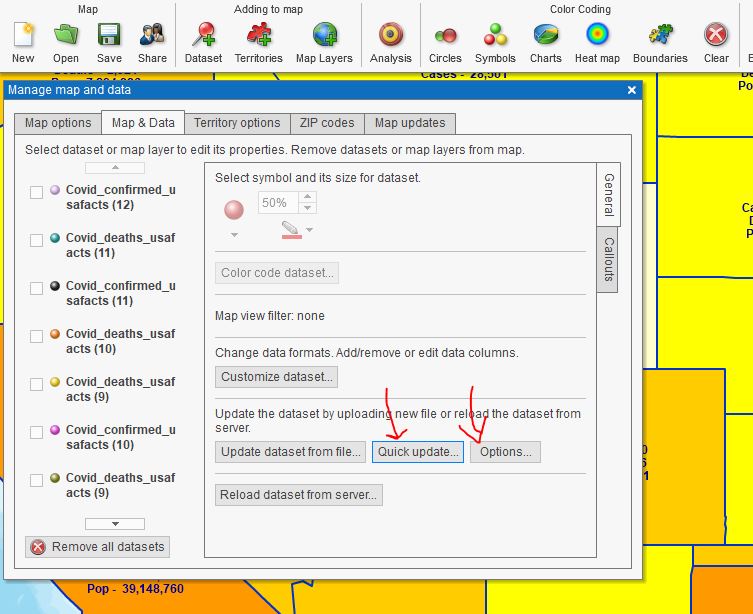
This month we updated MapBusinessOnline. The tool now allows the user to update previously imported map datasets without starting from scratch and adding a unique ID column.

  • The Map and Data box now contains a Quick Update button for spreadsheets whose formats have not shifted. A unique ID is not required. Try it.
  • Alternatively, the user can select the Options button, to the right of the Quick Update button to assign any existing column of data that happens to be a column containing unique numeric data

Quick Imported Data Updates

Frequently Imported Data

MapBusinessOnline also includes access to previously and or frequently imported datasets. These could be resource datasets for your business map, whose data components rarely change and are applied for reference on multiple maps.  To quickly duplicate the import of these data sets, choose the From Server option instead of pulling the data from where it is stored on your machine:

  • Click Add to Map – Dataset and then Next
  • Select the lower (third) option labeled From Server
  • Leave the Data Folder dropdown at My Data
  • Select your target data from the set of previously imported data listed
  • Import by clicking Plot

Did it Import Correctly?

I’ve been using MapBusinessOnline and handling technical support inquiries for almost ten years now. In all that time data import problems were rarely due to MapBusinessOnline issues. Still, we realize users need to feel warm and fuzzy about their data imports. Here are a few suggestions.

  • Be aware of how many records you are importing. Just as an import operation finishes, MapBusinessOnline reports how many records have been successfully imported.  It should be close to the number of records you expected. (I say ‘close’ because it’s not unusual to have a bad address here and there)
  • After import, check the lower left-hand corner of the Data Window.  There you will see your total record count noted.  Aside – When you filter or query that data the result will show the query segment count  and the original quantity
  • Review the Data Window view of your imported data. The second column from the left side of the datasheet view describes how well the data ‘geocoded’ or plotted. Green means ‘Great!’ Yellow signifies ‘could be better.’  And a Red X means try again, your data didn’t plot
  • Some day there will be a Jeopardy question, “What is MapPoint software?” Old Microsoft MapPoint data is just that – Old. Some of those ZIP codes have been deleted or changed

Remember, duplicate addresses (or in datasets using ZIP code only geocoding) and ZIP codes will lead to point stacking. Duplicate addresses stack the plotted points, one on top of another, at the exact same location.  Click the stack to get a list of points.  You may have imported 200 data records and only see fifty points on the map.  Look for point stacking.

Being aware of how well your data geocoded saves time in the long run.  We all make mistakes. Common importing mistakes include:

  • Bad addresses or bad address formatting. MapBusinessOnline requires Address | City | State | Zip. Sometimes importing users end up with many bad addresses. Especially if they inherit the data. Just be aware
  • Breakout location components that are stuffed into one spreadsheet field into separate fields – | 19 Norwood Ave Rockport MA | should be |19 Norwood Ave, | Rockport, | MA |. Be especially aware of County and State separations. This occurs most often in CRM or ERP exported data
  • Misleading column headers – Make sure the application knows what the column is. Labeling a column as ST or State works. Labeling it a ‘Preferred State’ might not.
  • Column formatting in your original data can be an issue from time to time. For example, you may want a number to be listed in a territory label field as text and not summed. In this case, your original data format for that column should be Text

Your data may have something wrong that you can’t identify. It happens. Let us know if you’re having data import issues that you can’t figure out. We’re happy to take a look at your data for you. After all, geospatial awareness starts with accurate location-based data and leads to an accurate business map.

In other words, we’re happy to help.

_______________________________________________

MapBusinessOnline access has officially transitioned from Web Browser (Adobe Flash Player) access to the Map App download access.

  • Please download the Map App from the website – https://www.mapbusinessonline.com/App-Download.aspx.
  • After installing the Map App, the MapBusinessOnline launch button will be in the Windows’ Start Menu or Mac Application folder. Find the MapBusinessOnline folder in the Start Menu scrollbar. Click the folder’s dropdown arrow and choose the MapBusinessOnline option. You can drag the Icon to the task bar for a quick launch button.
  • All saved maps will be available through your Map Library Folder, the second button in from the left on the Master Toolbar. (Green File Folder icon.)

Map App access to MapBusinessOnline.com provides enhanced features and a better user experience.

The Map App includes the new Map Viewer app for free non-subscriber map sharing.

Value-Added Resellers – Offer the tool to your customers as a reseller. Make money on training and consulting. Contact us with further interest in reselling MapBusinessOnline.

Find out why over 25,000 business users log into www.MapBusinessOnline.com for their business mapping software and advanced sales territory mapping solution. The best replacement for Microsoft MapPoint happens to be the most affordable.

Contact: Geoffrey Ives geoffives@spatialteq.com or Jason Henderson jhenderson@spatialteq.com

Posted in Business Mapping Software blog post, How to instruction | Tagged , , , | Leave a comment