CORNISH, Maine, Aug. 13, 2020 /PRNewswire/ — SpatialTEQ Inc., publisher of North America’s leading business mapping software Www.MapBusinessOnline.com, announced today the release of a free Map Viewer App, part of the MapBusinessOnline Map App download.
The Map Viewer app is for non-subscriber access shared business map views per year. The downloadable Map Viewer is free for anyone desiring access to shared maps. The MapBusinessOnline Map App now includes an in-app registration process for easy set-up.
MapBusinessOnline business mapping software provides affordable yet advanced map-based market analysis, map visualizations, sales territory mapping tools, with access to business listings and a comprehensive library of demographic data for general business users across the USA and Canada.
The MapBusinessOnline Map Viewer provides a set of features, in addition to map views including:
Point-to-point optimized vehicle routing for up to 150 stops per route
The ability to conduct geospatial queries on shared data
The ability to export geospatial query results
Jpeg and PNG map image save and export functions
Optional password protection
All MapBusinessOnline subscribers can share maps for public viewing as part of their subscription. The Map Viewer is included with all Map App downloads and is available at no charge at the MapBusinessOnline.com website. Shared Map Viewer sessions can be password protected for added security and to limit data access.
Updates for the Map App and Map Viewer occur through the included Map App Updater or from Map App launch. The MapBusinessOnline Apps, once installed, are in the Windows Start Menu or the Mac Applications folder.
The MapBusinessOnline Viewer is one of five apps packaged within the MapBusinessOnline Map App download. The newly released Map Viewer is available at no cost for both Mac and Windows PC machines. The tool provides non-subscribing users with interactive map views of business visualizations, sales planning maps, and territory alignment, independent of web browsers. All Map App applications are cloud-based services and require Internet connectivity. The complete list of apps included in the Map App download is Compatibility Test, MapPoint Map Conversion Tool, MapBusinessOnline application, MapBusinessOnline Viewer, and MapBusinessOnline Updater.
About Map Business Online
From the creators of BusinessMAP, www.MapBusinessOnline.com has been providing sales & marketing professionals with affordable and intuitive cloud-based business mapping software, for Mac and PC users, since 2010. Design, edit, and share maps that reflect your business. Create and manage sales territories that drive accountability into your sales force. Conduct map-based market analysis. Generate location-based business intelligence. Replace discontinued Microsoft MapPoint with MapBusinessOnline. Access optimized multi-stop routes to drive down travel costs. No other mapping software solves so many problems for such a small investment.
Every day we speak with MapBusinessOnline users about how they solve business problems with our business mapping software. Below are some common and interesting applications of the tool.
My Company Needs to be More Aware of Our Competition
A simple import of a location-based spreadsheet will provide a map visualization of your competitors which you can share with your constituents as required. You can compile that address list of competitors in several ways:
Have an associate go online and collect all the addresses of major competitor locations into a spreadsheet. Be sure to have a column for Name | Address | City | State | ZIP | Other. Import that spreadsheet into MapBusinessOnline and view the arrangement of competitor locations symbolized to stand out from your location(s). Include home location for traveling salespeople, major customer locations, and any other critical resource locations
Search for the competitor in the MapBusinessOnline Business Listing service. Business Listings search is included in MapBusinessOnline but the data download of listings is paid for at $0.15 each. These listing include contact info and some basic sales and employee data for each company.
Travel to each competitor’s location and collect latitude/longitude points. Pull that data into MapBusinessOnline. Be sure to dress incognito and if questioned, speak with a heavy Romanian accent
With your competitor map published, you can share the map with your associates. Have your associates download the free Map App which now includes a Map Viewer App for non-subscribing Windows or Mac map viewers.
Our Traveling Nurses are Crisscrossing Paths During the Day
Sales territory assignments clarify account or client responsibility, reducing inadvertent crisscrossing of paths, and allowing for 25% more face-time per client.
Travel efficiency is a major problem for companies that service people in the home or require salespeople to travel from account to account. Travel costs and traveling clinician time drive expenses up. It’s important that nurses, salespeople, or service techs are not crossing and recrossing paths all the time. That sort of redundant travel expense can put a company out of business, fast.
Use MapBusinessOnline territory management tools to assign clear accountability for clients and account based on ZIP code or County territories. MapBusinessOnline territory management software addresses common challenges like overlapping territories, aggregated sales totals, travel metrics by territory, and demographic analysis by territory for workload balancing.
The tools come complete with editing capabilities for easy and fast territory adjustments to accommodate business changes. Access optimized routing for efficient sales planning. MapBusinessOnline is easily shared through a free downloadable Map Viewer App – one of several apps available through the Map App. Shared maps include the ability to route for Map Viewers.
I Need a Map Displaying all our Customers for a Strategic Planning Session
Probably the most common applications of business mapping are related to customer visualizations. Import your customer address list and view plotted points on the map with assigned symbology. Adjust symbols as required and consider color-coding symbols based on sales, client status, or some other value metric.
Importing an Excel spreadsheet of customer addresses requires no more computer experience than working with spreadsheet software or using and Internet web browser applications like Chrome or Firefox.
We’re Planning on Expanding. What Cities are our Best Options?
Market Analysis is a more advanced use of business mapping software. MapBusinessOnline Standard or Pro editions provide excellent map-based market analysis tools for defining current markets and extrapolating the success gained in a known market towards the best options for success in new areas.
The first thing I would do is create a territory around a current known business location. Add key demographic data categories to the territory analysis view that you know best defines your current sales success. These demographic categories could be population, income, ethnicity, or gender-based. You choose. Try different demographic subjects. Import many of them and then view the Data Window analysis in MapBusinessOnline, adjusting the view for different layers arranged from largest to smallest values. Some of these demographic options can be combined using MapBusinessOnline’s Calculated Data Columns. This will stimulate discussion of your market and help to define what makes your current business successful or not.
With all this information now at your disposal, add the City Limits layer to your map. Assign the winning demographic categories to your city limits layers view to find the optimum cities. Duplicate your home-based analysis over the target cities. Or, if you already have a list of possible cities, focus on that list and choose the top three.
I Need to Share Sales Results by Salesperson
Building on the territory mapping tools outlined above, MapBusinessOnline sales territory mapping provides a sharing platform within which a map creator can upload sales results by account and then aggregate results by territory for display. Map viewers have access to the Map App which includes the Map Viewer App.
By merging periodic sales reporting with sales territory maps, the entire sales team is informed about goals, progress towards goals, and has access to account information. The sales territory mapping platform of MapBusinessOnline offers a chance to focus a sales team on a shared view of the business, defining accountability, comparing results, and sharing success and failure experiences.
We Need to Select a Group of ZIP Codes and Export the List with Population Data
Selecting a group of ZIP codes is easy in MapBusinessOnline. It can be achieved in multiple ways:
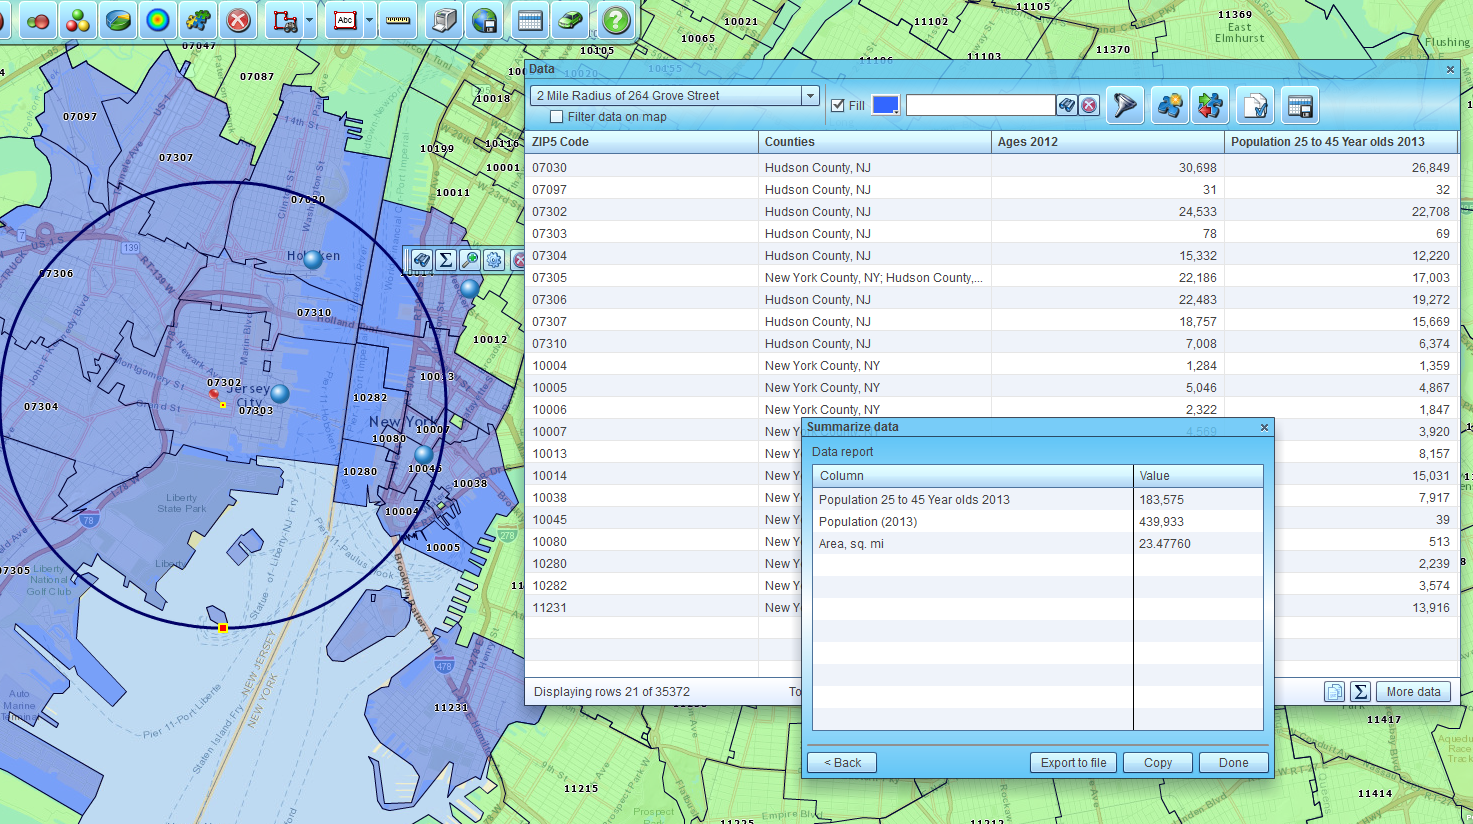
Create a radius map using the Search Tool – a Circle Button on the Master Toolbar. Grab that circle and drop a point on the map, set a radius, and Go! Choose the ZIP code layer to search and name that resultant marketing list
Input an Address into Address Bar (blank white space) in the upper left-hand corner of the application. Click the Binocular button to the right. Note the Map Point on the map, choose the Circle button in the mini toolbar presented
Import a list of ZIP codes and then Color Code the ZIP Codes based on your imported data
Import a list of ZIP codes as a territory import
There are many ways to group ZIP codes. Once you have them grouped, select the group and from the associated mini toolbar choose the Summary Button, better known as the Greek letter Sigma (a sideways M.) This lets you select any Demographic Data Category with population at the top of the list. Export the resultant data as required.
Summary Options
If you created a territory out of your ZIP code list, go to the detailed territory view and use the Choose Column button in the lower-left to launch a simple but powerful Database Management tool. Grab Demographic Data in the left-side dropdown and push that Data to the right to load up your territory analysis with population, income, ethnicity, or other demographic categories. Once again, export as necessary. Read more about Radius Maps for Population Data.
My In-laws are Coming to Visit – I Need a Quiet Places to Hide
Whenever my in-laws threaten to visit, I pull up a MapBusinessOnline map and change the base map layer to National Geographic. This layer outlines rural and urban park areas. These tend to be places where wild animals lurk. Mothers-in-law are generally frightened of wild animals and thus they avoid regional and national parks. These areas have quiet pine needle strewn walking paths, perfect for quiet reflection about why it was you got married in the first place.
Forested paths are often unmarked or unclearly marked. It’s easy for older folks to lose their way. There are often large roots across the walkways that are easy to trip on. These trails can be slippery when wet. It could be dangerous for in-laws to travel on these nature trails. So, be sure to warn them away.
Or maybe not.
My Boss Wants a Coverage Area Map Describing Our Two-State Service Area
Coverage maps are used to communicate the areas covered by a business service such as:
A sales organization
Traveling medical practices
Delivery services
Rental agencies
Mobile marriage counseling
In MapBusinessOnline, a coverage map could be established by ZIP code, county, state, or city limit. Coverage area maps tend to be ZIP code maps, but a state map is easily done. MapBusinessOnline offers a State Filter button in the Map and Data box. Simply select the Filter button on the Map and Data toolbar and choose the states you need. In that way, you’ve limited the scope of the coverage area map to your selected states and you could still overlay ZIP codes or other map layers by manipulating the transparency and boundary options for each layer in Map and Data.
Coverage maps can be shared through the new Viewer App for non-subscribers to view. The Viewer App is included for free with the Map App download.
How Can I set up a Variable, Shared Data Record in MapBusinessOnline?
This workflow is designed to allow an A or B input, adjustable by a set of map users. It would require a shared MapBusinessOnline Team Subscription. In this example, the map user client is a mobile healthcare organization. They want to confirm a visit has taken place by looking at a recent map view. See the video to visualize the workflow.
Create an Excel address spreadsheet of Clients/Patients.
Include a column for Visit Status. Prefill a Column of Status records as required. Have at least one record of each possible response in the column. In this example: Required or Visited.
Color code the Point Layer by the two record status options for the variable data column.
Make sure teams members are set up in a shared MapBusinessOnline subscription and with access to the shared map
Team members access the map after Visiting the client. They select the address record and in the Data Window view, edit the Properties and Data of the record to now read Visited as opposed to Required
The required Variable text is user-defined. Use Yes or No or some other convenient descriptor appropriate to your business operation.
Send us your cool applications of MapBusinessOnline.
Value-Added Resellers – Offer the tool to your customers as a reseller. Make money on training and consulting. Contact us with further interest in reselling MapBusinessOnline.
Win a $20 Gift Card! Refer a business associate to MapBusinessOnline or contact us with an interesting use case, in exchange for a $20 Amazon Gift Card!
Last week a ex MapPoint customer asked a question via chat: How can I arrange a label so that it doesn’t overlap other info on a ZIP code map?
While the options for controlling label placements in MapBusinessOnline are easy, the answer to the above question is more complicated than just ‘click here and select an option.’ There’s more a MapBusinessOnline user can do to optimize label placement.
Call Out Adjustments
MapBusinessOnline labels are associated with map layers, imported points, and territories. Imported points receive a Call Out label. These can be turned off selectively – one at a time – or they can be all turned off or all turned on.
To rearrange a Call Out orientation, simply click into the Call Out label and click the little Edit Gear in the right-hand corner of the label – between the Route Car icon and the Close option. Here you’ll find a clock face upon which you can select the call out position around the clock. You can also choose Compact Call Outs in the Map and Data imported data layer. In Map and Data hover over the layer, click the Edit Gear, choose the Label tab and then find the Compact Call Out option.
Map Layer label options include the ability to adjust the font size and to choose the Zoom Level at which most of the labels begin to appear. Select the layer in Map and Data as noted above, then under Label, scroll to the bottom of the panel, and under Auto Labels try a few different options for size and Zoom level.
The above instructions are two quick ways to optimize label placement. But, for a detailed business map, that you’ve invested your precious time into, you may want to consider a few more points of optimization.
Zoom Level
The map Zoom Level, controlled in the upper right-hand corner of the application, can always be adjusted. Zooming in on the map will reveal more detail, and ZIP code labels will become more numerous as the map displays larger ZIP code areas but a fewer ZIP codes overall.
This zooming-in process requires your review in terms of Map Clutter. Are your labels still effective at this Zoom level? Are there too many ZIP code labels displayed or is it just right?
As mentioned above, all labels have an adjustment that controls and defines the Zoom Level at which a set of labels appear. In Maps & Data choose the layer you want to edit, click the Edit Gear – Label – Auto Label. Here you can set County labels, ZIP code labels or other map layer labels to appear at specific zoom levels.
Remove Superfluous Labels
Consider adjusting County labels and State labels too. Do you even need a state layer label turned on? States are largely referential and perhaps just a light state boundary is all that is required.
In general, less is more on a business map. Chances are good, your executive team is filled with busy people who may require spoon-fed reporting and business map reviews. Don’t make them hunt and peck for information. Get your business map point across quickly and efficiently. Bad mapping probably won’t ruin your reputation around the office, but a solid business map, ripe with the right content, will be remembered.
Each map layer includes boundary and fill transparency controls. Accessed through Map and Data under the General Tab, these controls let you decide exactly how much color you want to display on the map and that fill layers opacity.
In general, I follow these “rules” for map layer adjustments.
State layers do not require a color fill or a label. A boundary is sufficient to define a state. If your map viewer doesn’t recognize a state boundary, send them back to elementary school. States are generally used for orientation only.
Counties are optional and usually only add value if the territories have some county-level basis. Still, on certain maps, like COVID-19 maps, counties may be the focus map layer.
ZIP codes are generally the key map layer and should be color-shaded to reflect your map’s core purpose. Always allow as much transparency as you can without losing meaningful definition.
You can always apply different background maps. Be sure to try background map options to determine which background adds the most visual value.
These rules are just guidelines. Play with the tools to get used to the options you can apply.
Think ‘Easy on the Eyes’
Assume that your map viewer just woke up with a vicious hangover and the first thing they’re going to do is look at your business map. Keep the colors subdued. Make borders obvious, but not too thick. Always support your business map’s intent when adjusting the look and feel of your map. Don’t make your map viewer have to think too much.
I like to use pastel shades and colors. I tend to avoid bright colors unless I am highlighting something to make it obvious and critical to the map viewer. If your map is a territory map, and you’d like to add some drive time polygons to support your analysis results, consider developing a second map that focuses on drive times. Do not try to solve all problems with one map. That’s a classic rookie map move.
Cloropleth Map
Business Maps Provide Situational Awareness
Remember, your business map serves many purposes. Business maps provide map visualizations of business realities or possible business futures. Business maps serve to communicate concepts present facts to a business audience.
Business maps should be a thorough analysis of business situations designed to make constituents aware of periodic results or strategic threats and opportunities. Business mapping services provide reporting to update business teams with tracked results or project statuses.
Labels and call outs are critical elements of any business map. Choose their placement wisely and help those labels to emphasize your map’s purpose.
Value-Added Resellers – Offer the tool to your customers as a reseller. Make money on training and consulting. Contact us with further interest in reselling MapBusinessOnline.
Win a $20 Gift Card! Refer a business associate to MapBusinessOnline or contact us with an interesting use case, in exchange for a $20 Amazon Gift Card!
2020, the year we all realized our lifestyles were precious and subject to forces outside of our control.
I suddenly realized it on a Friday evening in mid-March 2020, as my wife and I walked across a few streets in Portland, Maine on the way to our favorite Chinese restaurant, Empire. I pay close attention to the news, and I thought to myself, “This could be the last time Barb and I go out for dinner for a year or more.”
Although we have actually gone out to dinner since then, as restrictions in Maine were relaxed, dining out is no longer normal. All Maine restaurants must serve diners outside, with adjusted menus, and in many cases, plastic cups for beer. A plastic beer cup isn’t a disaster, but when you live in one of the craft brew capitals of the world, it kinda sucks.
Fortunately for us, the reported case and death rates for COVID-19 have been comparatively mild in Maine. Early intervention by the State and general compliance with the Governor’s latest rules on the part of Mainers, have kept casualty rates low. I know this is very tough for certain Maine businesses. After all, tourism is our largest industry.
Work at MapBusinessOnline has proceeded without restriction. Business has hung in there well, thanks to our loyal customer base and the fact that our business occurs almost exclusively online.
But it is interesting to watch our customers shift their use of business mapping software as a tool for pandemic mapping. What are the application challenges MapBusinessOnline customers are approaching with business mapping software during the greatest epidemic the world has experienced since 1917?
Equipment Tracking
As companies return to business as usual, or close to it, many businesses need to track down where all their equipment is located. Delivery services, rental agencies, and businesses supporting all kinds of field services were shut down on short notice. Many projects and service operations were simply dropped where they were. Equipment may have been left on job sites all over a particular area of interest.
Business maps can help gather a list of equipment last know locations. These lists can be geocoded or plotted on a map by address or latitude-longitude coordinate. Equipment location visualizations are nothing new to MapBusinessOnline.com. It just another business reality that can be managed using mapping software.
Job sites and equipment locations are often imported into MapBusinessOnline as latitude/longitude coordinates. MapBusinessOnline includes a background map option for “Satellite Imagery with Streets.” I like this view for job sites because it includes a view of building and building footprints. The imagery isn’t always ‘satellite’ imagery. It is usually fairly recent aerial imagery compiled by municipal or state government entities for planning purposes.
Equipment maps can be shared with non-subscribers. Try the new MapBusinessOnline Viewer app. Have your target constituent map viewers download the Map App (no charge.) You’ll find all the MapBusinessOnline Apps now listed in the Microsoft Start Menu as you scroll down to the ‘M’ section of the list.
To use the MapBusinessOnline Viewer all your map viewers need to do is take the link you send them via email and click the link. A web page will launch offering a choice to use the MapBusinessOnline Viewer or to install the Viewer if it is not yet installed. The MapBusinessOnline Viewer does not require Adobe Flash Player.
Read more about the MapBusinessOnline Viewer in this month’s MapBusinessOnline Newsletter. If you’d like to subscribe to the newsletter let us know via email or chat. We always interested in suggested features of an online mapping tool.
Tracking Sales Activity
Tracking and comparing month-by-month sales results from 2019 to 2020 is on a lot of peoples’ minds. Sales results are easy to track on a business map. A simple import of a list of transactions by address viewed against a business map provide insight. You can import these records by month or as a year-to-date compilation. All location-based transaction data can be aggregated by ZIP code, county, state, or territory.
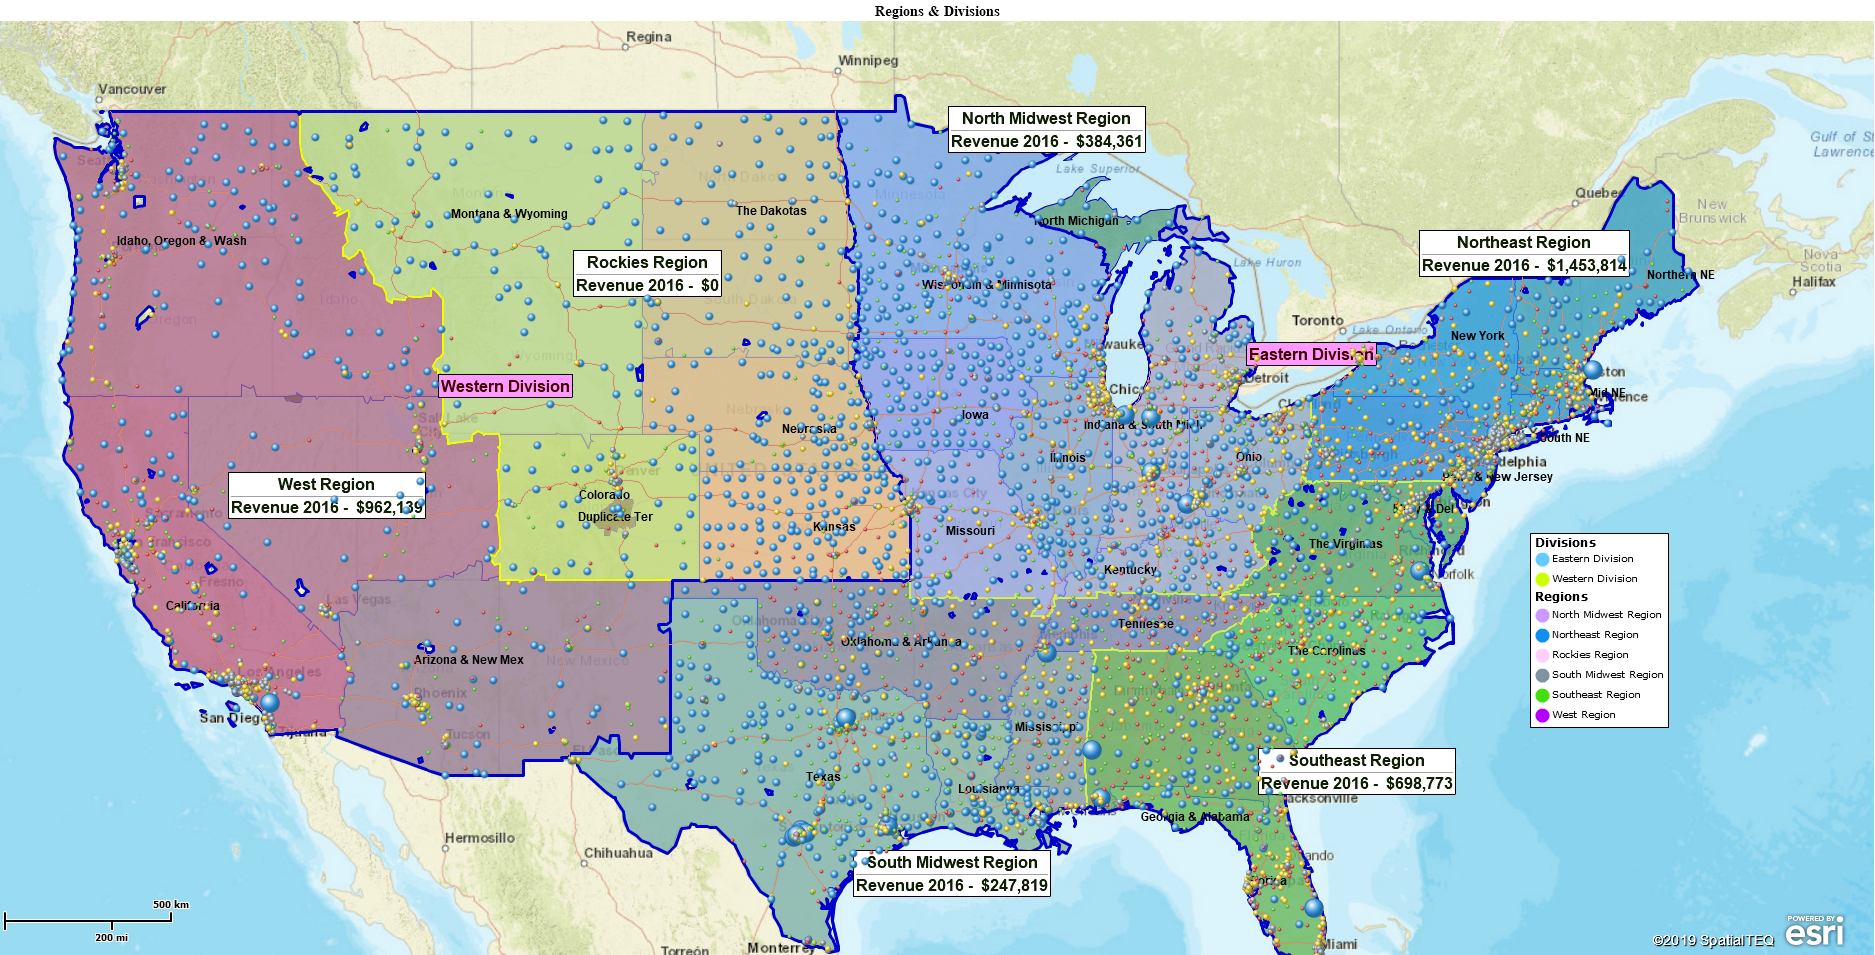
Such data aggregations mean that all the dots you see on the map representing company sales values will be summed by your choice of area. Most often our customers do this summation by sales territory. But the type of map layer focus depends on your business. A Retailer might prefer to see results by ZIP code groups or by City limit. While a manufacturing sales organization will be focused on nationwide sales results by region or division (available in MapBusinessOnline Pro).
COVID-19’s impact on sales results varies from business-to-business. Food services and airlines have been decimated. Internet Service Providers and cleaning services are booming. It’s more important than ever to have a complete grasp of accurate sales reporting.
Challenges like managing overlapping sales and or exposing gaps in sales coverages are well suited to business map visualizations. I will note that sometimes, new users expect to be able to replicate complex sales structures on a basic business map. A full GIS application may be better suited than a business map for visualizing three or more overlapping sales coverages or product lines. But I always recommend that map creators keep their sales territory maps as simple as possible.
Additionally, during a pandemic online shopping has become a primary way to shop for basic goods – even groceries. Online mapping and route planning software can help you track deliveries and monitor delivery times. Are your vendors or your own delivery services providing the best customer experience possible.
Creating a basic map to communicate sales results and account responsibilities will go far towards instituting organizational sales achievement. Maps with too many data layers, themes, and colors, difficult for the average salesperson to decipher, will be confusing and are likely to demotivate your team. Keep it simple. If necessary, build multiple maps to drive home more than one critical business idea.
Map Symbolizations
Symbolization is a pretty big word. But it covers an important concept. A dot or a triangle displayed against an accurate map of the USA can mean many things. In MapBusinessOnline, those symbols are available in the symbol library through the import and color-coding processes.
It’s possible to apply colored circles variable by value. For example, your colored circle can change from orange to red to reflect higher sales or more intense concentrations of COVID-19 cases. The circle can also vary in size, adding more visual cues for your map viewer.
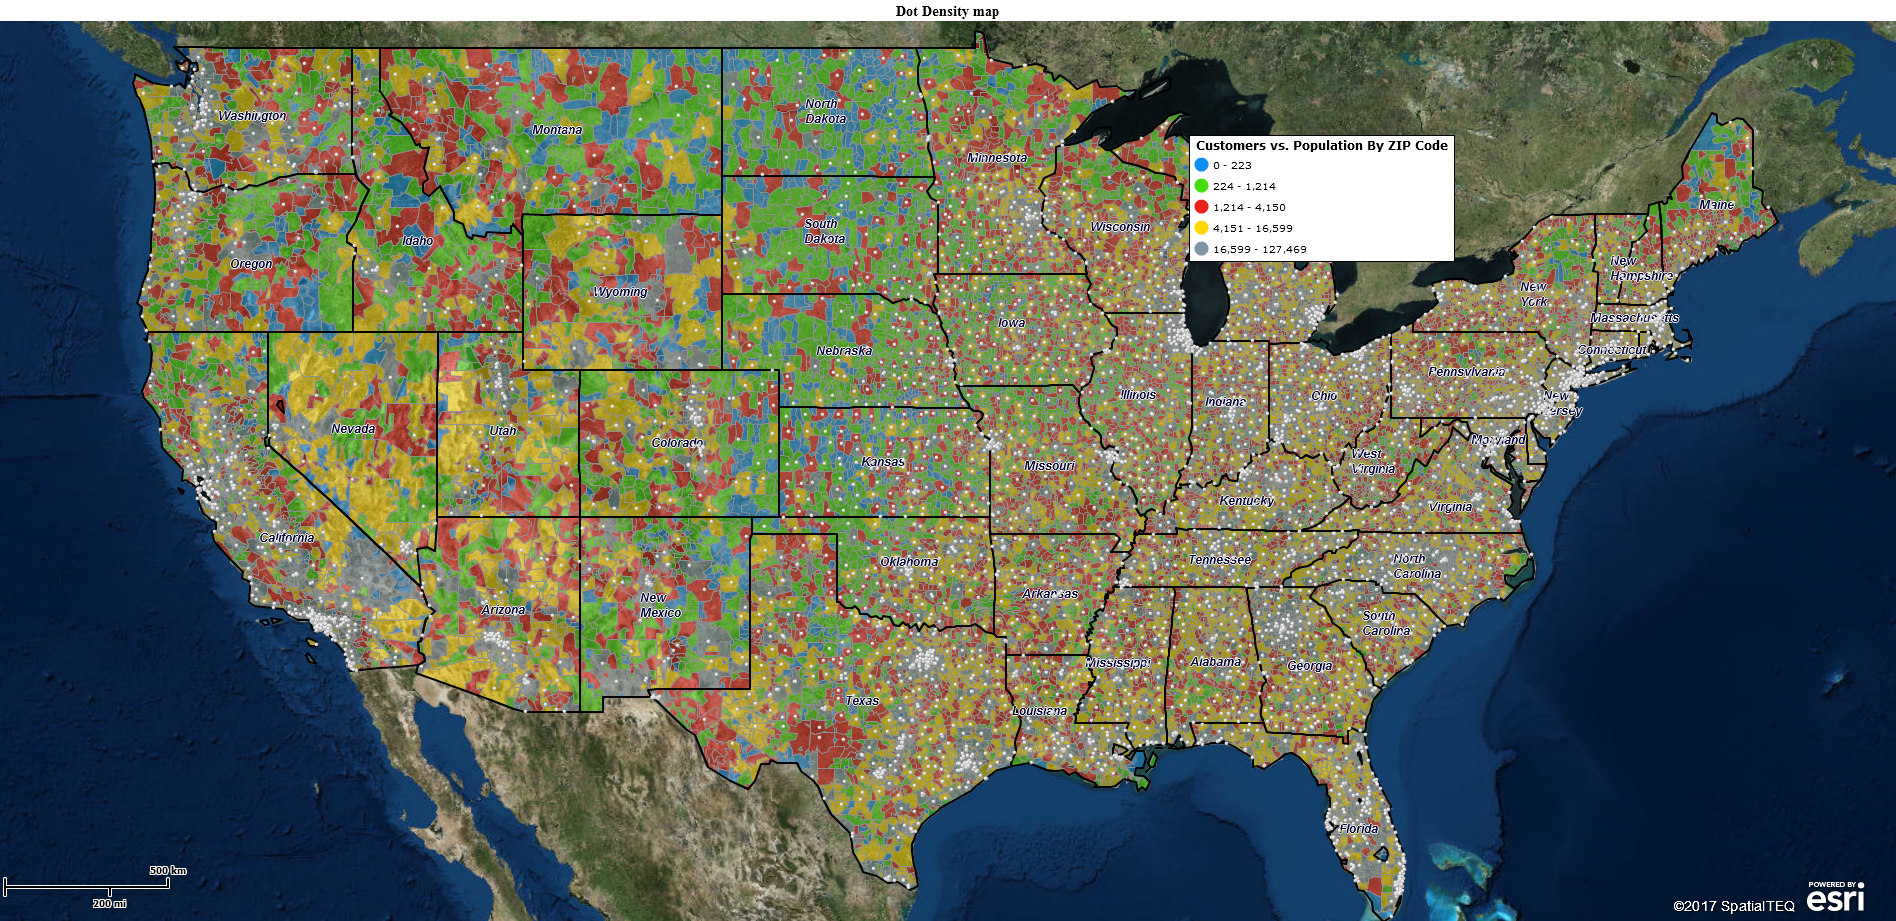
A Dot Density Map Visualization
The application even includes Chart and Graph Symbols which I use to show value variations over time – by city county, state, or ZIP.
Sometimes a basic dot density map works wonders for exposing patterns across wide areas. Importing large datasets, 5,000 or more records, and symbolizing the data with medium to small size dots can reveal concentrations of key criteria. Potential customers, epidemic outbreak locations, or just good old sales accounts can bunch up by city or business park leading to more effective contact or mitigation strategies.
I encourage experimentation with symbolization options in any business mapping tool. Mapping your business is personal. Based on your business’s sales pace, product price points, and industry type, certain symbols will optimize communication. Listen to your map viewing audience. Over time you’ll learn what works best.
Avoid loud colors and overbearing symbols.
Mapping COVID-19
We’ve been tracking the spread of COVID-19 deaths by state and county. I’ve tried to keep that focus consistent. I was very concerned about the Trump administration’s attempt last week to redirect hospital virus reporting away from the CDC. I am very much in favor of keeping data consistent and widely available.
Other organizations may require tracking of the virus by different factors. As long as the data provided has a location component – an address, lat/long, a ZIP code – it can be displayed on a map. MapBusinessOnline customers in the health care and health insurance industries have tracked the virus by hospitalizations, seeking to calculate risk as realistically as possible. COVID-19 risk factors impact hospital preparedness, PPE requirements, staff requirements, and insurance claim planning.
Coronavirus caseload statistics can swing rapidly over a ten-days. What a hospital system data analyst might hope is just a tick up, could turn into a full-fledged hot spot over a few days. A well-designed business map can depict those ups and downs visually, providing trends based on a period of days or weeks, valuable in triage planning sessions.
MapBusinessOnline can display the progress of the virus by jurisdiction and expose trends through color-coded or heat mapped ZIP code areas and counties.
So keep those cards and letters coming about how you use MapBusinessOnline during the Coronavirus Pandemic. Let’s make sure we document our pandemic experiences for our great-grandchildren, dealing with their pandemic a hundred years from now.
The Map App install is fast and easy. The Map App is a cloud-based service, once you’ve logged in you’ll have access to all of your previously saved maps and data. The Map App is a better user experience and provides access to more features than the Web App. The Flash-based Web App link will remain available until December 15, 2020.
The Map App includes the new Map Viewer app for free non-subscriber map sharing.
Value-Added Resellers – Offer the tool to your customers as a reseller. Make money on training and consulting. Contact us with further interest in reselling MapBusinessOnline.
Win a $20 Gift Card! Refer a business associate to MapBusinessOnline or contact us with an interesting use case, in exchange for a $20 Amazon Gift Card!
MapBusinessOnline Business Mapping Software is used to solve a myriad of challenges. Below are two specific problems that come up every once in a while.
ZIP Code-to-ZIP Code Driving Time and Distance Queries
Every so often a business contacts us with two lists of ZIP codes across which they would like to conduct driving time or driving distance queries from all ZIP codes in one list to all ZIP codes in the second list. So this is a complex twist on a ZIP code map.
We’ve always called this use of business mapping a ZIP-to-ZIP query.
Companies desire ZIP-to-ZIP queries to derive a sense of what transportation costs might be from one ZIP code to another ZIP code across their vehicle routing network. This information can be critical for a business to accurately project expenses, monitor staff time on the road, or to develop delivery and visitation pricing for clients.
I’ve seen ZIP-to-ZIP queries used in the real estate business, in healthcare, in retail, and food services. ZIP-code to ZIP-code driving distance and driving time queries are estimates because a specific address not applied to the query. The point-to-point analysis is made from the Centroid Point or weighted average center of each ZIP. So ZIP-to-ZIP estimates may be used to ball-park a service call or delivery stop’s route time.
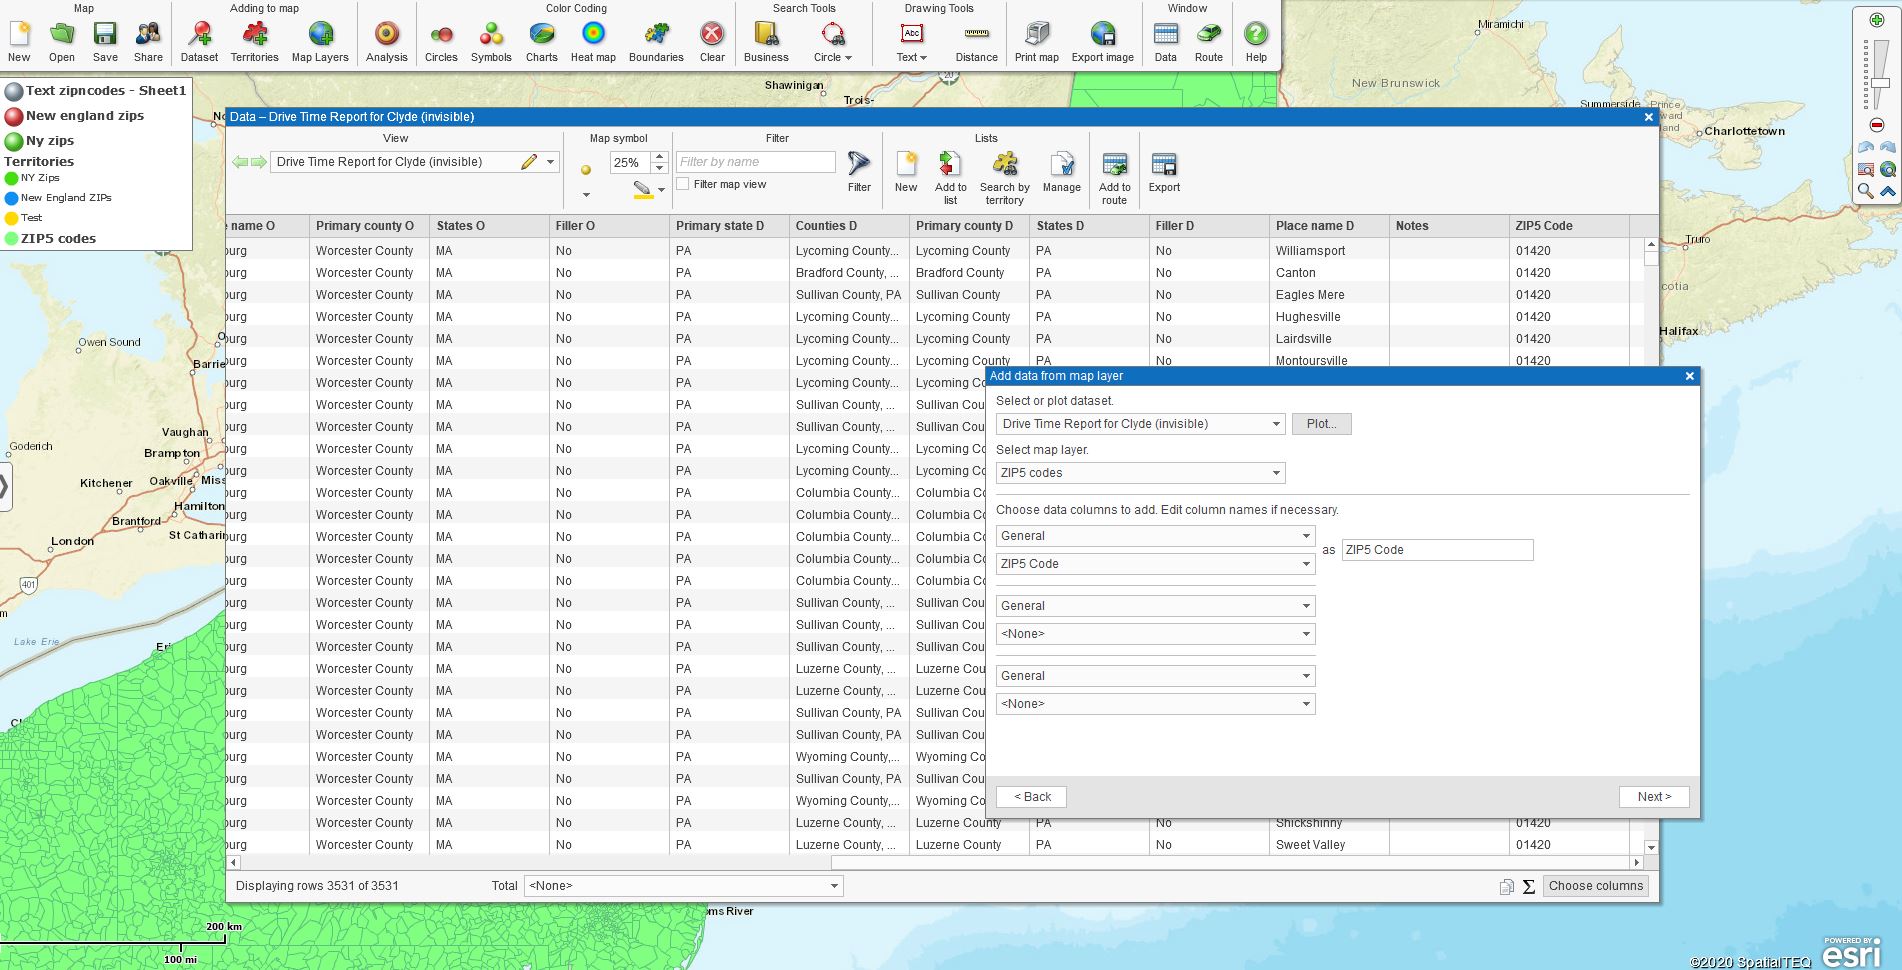
MapBusinessOnline Pro provides stock tools for this analysis in the Market Analysis button on the Master Toolbar. The Pro Market Analysis button provides the import process for placing both ZIP code datasets on the map and then continue with the analysis process.
Click the Market Analysis button. Scroll down to Market Analysis Batch Calculate Distance and Time Between Two Datasets, which is the Market Analysis option to apply. The results are generated as a spreadsheet in the Data Window. The Pro map user can apply the Add Columns tool button (formerly More Data) to edit the columns in your query result to simplify the exportable report to match your audience’s needs. E.I., don’t overwhelm the boss with data. She hates that.
One thing to remember about driving time and driving distance queries – they cost money. Each Pro subscription comes with route/driving time credits but for large driving queries credits will be consumed.
Step-by-Step Instructions for ZIP-to-ZIP
Import two separate ZIP code spreadsheets. These ZIP code lists can be imported, as usual, using the Plot Data button, or in the Market Analysis Batch Calculate Distance function itself. Either way, the resulting data import places two sets of points on the map. Each ZIP code from each dataset is represented on the map by a ZIP centroid point or central dot.
Still in Market Analysis Batch Calculate Distance and Time Between Two Datasets. Carefully select which dataset is the Origin dataset and which is the Destination dataset. Usually, a store location, factory, or warehouse is the Point of Origin. Give this careful consideration before you run your query. Remember, these queries cost money
In the ‘Measure‘ dropdown select the type of distance or time analysis you’d like to apply:
Straight line distance
Drive time
Straight and drive distance
Drive distance and time
All distances and time
If you want to get fancy you can set Time-of-day. This can come in handy when considering commuter traffic. MapBusinessOnline can apply traffic modifiers to the driving time and distance calculations based on time-of-day.
Select a word or phrase that will describe your ZIP-to-ZIP exportable result. For Example: ‘Bus Route Time Estimates’
Click Next, to generate the report. The results will be viewable and exportable from in the Data Window
While in the Data Window, map creators can click the Choose Columns (formerly More Data) in the lower right. This opens an easy-to-use data layer management tool, which I would suggest you use to fine-tune your data before export:
Move columns around for optimized viewing
Delete superfluous data columns
Export final results using the Export button on the far right of the Data Window toolbar
These multiple driving time and driving distance queries are not new to the world of mapping. What’s different about MapBusinessOnline Pro is that such analysis is available at an affordable price with results generated in a matter of minutes. Typically these sorts of GIS queries are expensive, require a level of expertise, and involve long wait times.
Setting Up a ZIP-to-ZIP Query
Enrich Your Imported Business Data
Another capability of MapBusinessOnline Pro is the ability to enrich data that you’ve imported into the application. An example was presented to me this week through a support Chat. A user wanted to import a list of addresses with no ZIP codes included, only addresses. Then he wanted to find the ZIP codes, add them to the data and export the list including ZIPs.
This is entirely doable in MapBusinessOnline Pro.
Scroll down to the Enrich Dataset button, the last option under Pro Market Analysis.
Import or Select your address data. In the dropdown select the Map Layer you’d like to explore for data – County, ZIP, State, etc.
Finally, choose whether you want to add Demographic or Geographic data to your dataset. In this case, it is geographic, because you want to add ZIP codes. Select ZIP codes. Click Next and then Done and the Data Window will display your enriched dataset. Export and take a bow.
The above two scenarios are just two examples describing how MapBusinessOnline Pro can provide unique and useful geographic solutions to business problems.
Value-Added Resellers – Offer the tool to your customers as a reseller. Make money on training and consulting. Contact us with further interest in reselling MapBusinessOnline.
Win a $20 Gift Card! Refer a business associate to MapBusinessOnline or contact us with an interesting use case, in exchange for a $20 Amazon Gift Card!
I live in Cornish, ME, adjacent to the largest area of undeveloped land in York County, Maine. Two 1,320-foot mountains sit side-by-side, about 1-1/2 miles behind my house. When we first moved to the area, you could easily access these beautiful mountains by hiking up along public dirt roads. But since that time, all of those roads have become no-trespassing areas. One access road is defended by a Second Amendment fanatic, making the forbidden passage somewhat hair-raising.
Still, those mountain summits beckon. They provide amazing views of the surrounding area with vistas of Southern Maine and the White Mountains of New Hampshire, including Mount Washington. Now that the kids are grown, and I have a little more weekend time and the need to exercise, I committed to discovering a new path to reach those mountains outback, one that didn’t require a bulletproof vest.
Decent maps were an essential part of achieving my goal. I consulted many maps, including:
MapBusinessOnline topographic, National Geographic, and satellite background maps
DeLorme’s Maine Atlas and Gazetteer paper map atlas
Last summer, I took a series of hikes from my house back into the woods, attempting to get around Clark Mountain to climb Hosac Mountain, the highest peak with a clear 360° view. To be clear, I could simply drive a few miles, park my car and walk into the Sawyer Mountain preserve, right up to Hosac Mountain. But I wanted to walk up to those mountain tops from my backdoor without assistance from a vehicle. You get it, right? No fossil fuel expended for my weekend excursions, litter picked up along the way, walking the whole distance commando, and other radical far-left rituals.
Just me, the woods, and ten thousand tics.
But last summer’s hikes didn’t reveal an efficient hike up the mountain. I had an efficient start but needed to get around Clark Mountain, through about a half mile of no-path woods, and blaze a trail to the Old Sawyer Mountain Road. That was the key.
Skirting Clark Mountain
Clark Mountain stands between my house and Hosac Mountain. Almost identical in height, Hosac is cleared on top, providing astounding views of Southern Maine and the White Mountains of New Hampshire. Clark Mountain has a few nice overlook spots, but it is quite wooded and gated off to prevent interloper access. Clark does block the view of Mount Washington from the top of Hosac, but with all the hills around my house, I see Mount Washington more than I see my wife.
The first-quarter mile hike, up the requisite rise in elevation to reach these hills, takes place on town roads, mainly Mountain Road in Cornish. This half-hour hike is a wonderful walk. I hike it often in the mornings before work. Although it’s only a quarter-mile hike up to a lookout, you get wonderful views of Mount Washington and Western Maine’s Pleasant Mountain.
An Overlook off of Mountain Road – A Quarter Mile Hike Above the House (in blue)
To hike the full Hosac Mountain loop from that short hike up Mountain Road, I follow an old hunting and RV trail that leaves the maintained road toward the southeast. Late last February, I followed this trail into the woods. The path leads directly to the base of Clark Mountain and follows the mountain base’s west side for about half a mile.
Taking this trail in February was unusual for a Maine winter. The snowpack was quickly disappearing due to an early spring thaw. In the mid-morning winter sun, the ground and snow remained frozen, so I could walk normally without a lot of mud and wetness in my boots. There were no signs of snowmobiles on the trail at that time.
As the trail moves south, the ascent is gradual until my cell phone altitude app tells me I am approaching 1100 feet, the highest point, before descending again and approaching Hosac, my goal. I saw no animals in the vicinity that day, but there were plenty of deer-sign and moose scat at one point.
I stumbled across the remains of a blue jay ripped to shreds by a wild cat or a coyote. The wind blew silently through the trees, and my neck got a chill as I stared at the bright blue feathers frozen into the top layer of snow. Reassuring myself that I was bigger than a bluejay, I bravely moved on.
Last summer, when I came this way, I stuck with the trail as my altitude declined on the far side of the mountain. But my dogged trust in my sense of direction led me into swampy areas. At the time, I moved to the north to avoid the muck and mire and only found more of the same. I got lost, I fell, and I got wet, and that was on a nice summer day. I eventually reached the Old Sawyer Mountain Road, long since discontinued. And from there, I did summit Hosac, but the entire hike was ugly and would not serve as an efficient and comfortable hike for an aging, whiney, baby boomer used to streaming murder mysteries while eating ice cream.
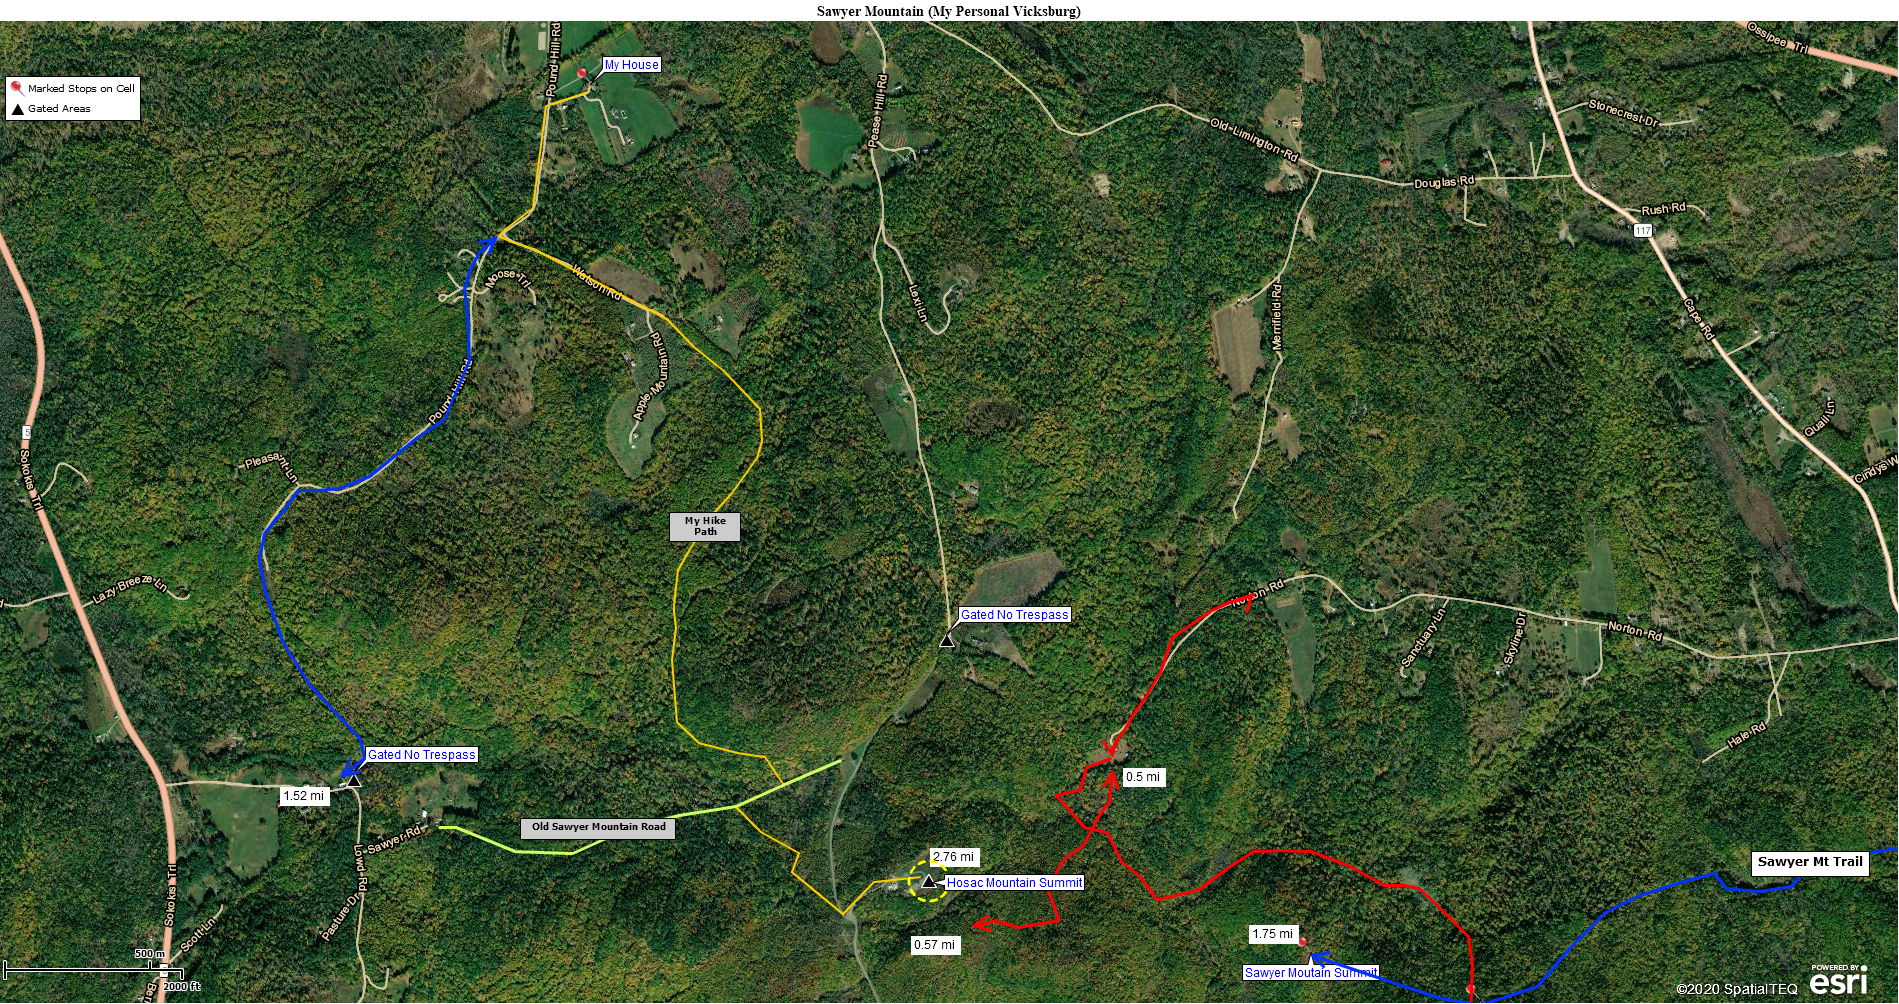
A MapBusinessOnline view of my backyard mountains
I want to be able to bring visiting friends up to these scenic vistas. I’m not going for Jeremiah Johnson in a blizzard, warmed in the cabin by the near-dead pioneer widow Baxter. No, I’m going more for a recently retired yuppie who takes a two-hour walk on a beautiful summer day and naps when he gets home. No cabin-bound, practically frozen widows involved.
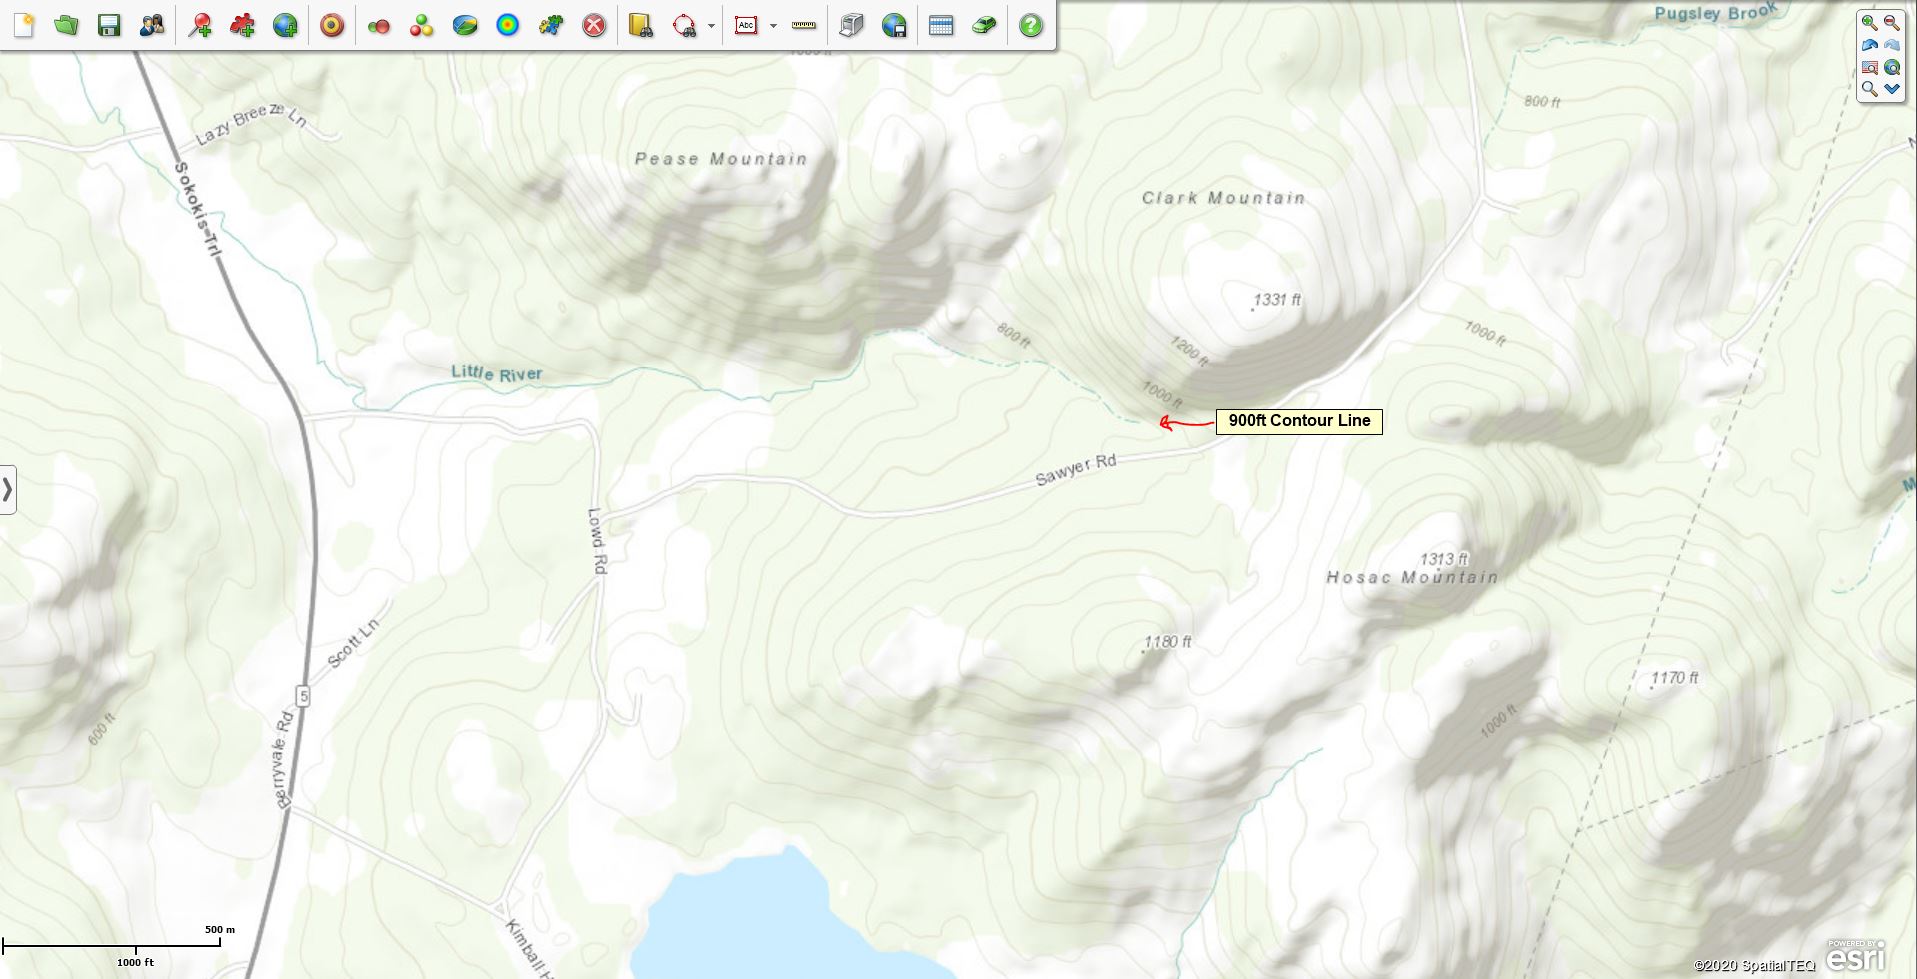
So, on my winter’s day hike, when I reached the end of the marked trail, this time, I turned to the east. I made this turn, based on a topographic trail map I found online in December, one of perhaps fifty maps I perused while researching this hike. You can also find Topographic Maps in MapBusinessOnline. This particular map indicated a 900-foot contour line at the base of Clark Mountain once I reached the southern side. It showed that the contour line follows the mountain base around to the east and then takes a hairpin turn back to the west, leaving the wet area below that 900-foot ridgeline in the crotch of that hairpin turn.
Contour lines are noted on classic topographic maps. Each line represents the contour of the landscape based on its elevation above sea-level.
900 Ft Contour Line on a MapBusinessOnline Topographic Map
I knew from looking at all the maps I consulted, that this contour line was my answer. When my position on the far side of the trail had declined to 900 feet on my cell phone altitude app, I moved east. By now, I could see and hear that the wetland I’d encountered last summer was fed by a rushing brook quite alive with snowmelt; on some of the old maps, that brook is called the Little River.
As I moved east, there was no longer a path. The terrain was steep, dropped precipitously, and was shaded by a thick stand of pines. The ground here is rocky and muddy with little vegetative cover. But with the help of a long thick maple walking stick, I could maintain my balance and avoid an embarrassing call to my wife begging for the rescue squad. I pushed on, gradually making my way down to the Little River.
I then followed the brook east and upstream for maybe a hundred and fifty yards. The stream was quite beautiful in the hazy morning sun. I carefully selected a crossing point where several boulders and a log seemed to guarantee that my boots would remain dry. These Little River stones lived up to their promise and helped me across the rushing stream, no worse for wear. I then spent an hour wandering around on the other side of the wetland, looking for the Old Sawyer Mountain Road by dead reckoning with no luck.
I got tired quickly, it being the first walk of the season and having not eaten before I left home (like an idiot.) I returned to the brook and picked up the map’s contour scheme again. In doing this, I found Old Sawyer Mountain Road within five minutes. #Maps are great.
Old Sawyer Mountain Road
Old Sawyer Mountain Road once provided passage for horses and carriages. Its use was stopped before 1930. But the road now serves as a wonderful walking trail deep in the Sawyer Mountain woods. Covered by tree canopy, the road is pretty much a straight-line turnpike from Clark Mountain in Cornish to Lowd Road, in Limerick. It’s about fifteen feet wide and bordered by stone walls on each side. There are old home foundations and cemeteries along the road. The obsolete road is now a mountain path, rutted and muddy in many areas, but in summer, it softens and offers a bed of dry leaves upon which to enjoy a shaded hike on a hot summer day if you can find the freaking thing.
As it turns out, the brook crosses Old Sawyer Mountain Road just a quarter-mile east of where I left the hunting trail and began my bushwhacking excursion. Huzzah!
My turn-by-turn directions would be these: Turn right off of Mountain Road, follow the Clark Mountain hunting trail south, then follow the Little River East until you reach Old Sawyer Mountain Road. Follow Sawyer Mountain Road east for about 20 yards and take a right onto a wide trail sloping up that leads to Hosac Mountain. That trail will T onto another trail. Bear right at the T to access the incredibly steep Hosac Peak access road. As you approach the mountain top from the woods, you’ll see the tall cell tower.
Hosac Panoramic View
Once a hiker reaches Hosac Mountain, there are frequently used trails in several directions that lead to Sawyer Mountain and the Francis Small Heritage Trust trail system. There are also roads leading to the towns of Limerick and Limington, Maine, from Hosac Mountain. A hiker could spend weeks walking the trails back there and see very few humans.
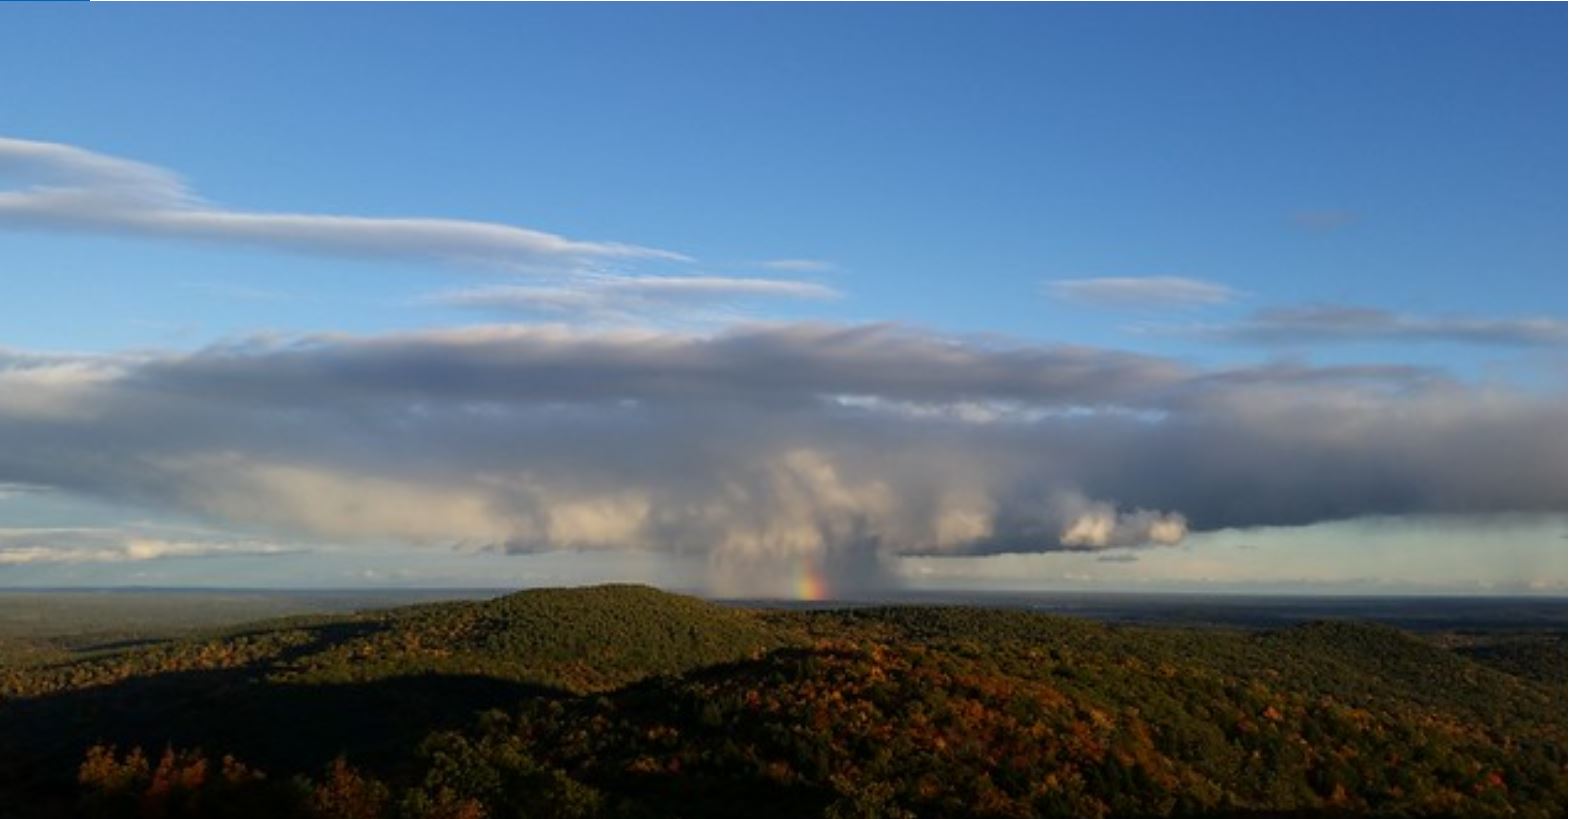
A rainbow viewed from the Hosac Summit
My goal had been achieved. The critical element of my success was studying the various maps of the area. The maps varied quite dramatically from each other. Specifically, the actual position of Old Sawyer Mountain Road varies from map to map. Many show the old road moving right over the top of Clark Mountain, an unrealistic placement based on the old road’s original purpose – basic horse-drawn transportation between remote homes on the heights and the town. It made much more sense for the road to circumnavigate the base of Clark Mountain, where maintenance and passage of horse-drawn carriages would be easier, especially during winter.
The map that most accurately depicted the obsolete road was the Town of Cornish tax map. But you just don’t think to review a tax map to find an accurate hiking path. Hikers should consider consulting tax maps for old trail verifications. Follow the money.
My point, overall here, in addition to hiking as a great pastime and source of good clean fun, is that digital maps, studied carefully, can provide navigation solutions to backwoods trail problems. No surprise, I guess. But these geographic sources are all online for free and can be a fun and productive way to pretend you’re Davy Crockett or a near-dead widow in the wilderness, without becoming one.
Just be sure to bring your cell phone, some water, and eat first.
Value-Added Resellers – Offer the tool to your customers as a reseller. Make money on training and consulting. Contact us with further interest in reselling MapBusinessOnline.
Sales Territory Management is a primary reason why customers select MapBusinessOnline over competing business mapping software products. I could just say we’re better, we’re easier, and we’re more affordable, but then I wouldn’t have much of a blog post. I’m supposed to shoot for 750 words.
Businesses require sales territory mapping software for a variety of reasons.
Franchise businesses want the ability to sell and manage their ZIP code territories
Pharmaceutical companies must monitor the sales of traveling sales reps across complex and ever-changing territories
Retail stores set up territories by store locations to track foot traffic, measure marketing campaigns, and to build demographic ZIP code profiles
Manufacturing sales organizations track direct sales teams and manufacturing rep companies across nationwide regions and divisions
Distributors and wholesalers create territories by state, metro area, and product line, using territory sales records to rebalance inventories
Healthcare businesses use territories to plan the cross-state expansion of hospital systems or to track field clinicians across a home care system
Insurance companies apply territory analysis to field claims management, expose coverage gaps, and to support classic sales departments in monitoring and sharing sales results
There are at least five major reasons why MapBusinessOnline is the sales territory mapping program of choice for business mapping customers all over the USA and Canada.
Ease of Data Import
Sales territory managers spend a great deal of time and effort preparing for and creating sales territories. Generally, data preparation for a complete sales territory mapping scheme will include a spreadsheet of ZIP codes or County based territories as well as an address spreadsheet of accounts and prospective accounts. MapBusinessOnline streamlines the location data import process providing easy and fast map visualizations of both customer visualizations and sales territory creation.
MapBusinessOnline sales territory management offers a multistep import process that is intuitive and includes instructional wizards that describe the process in easy steps, for people who prefer that. Video tutorials and help docs provide quick and easy guides for the creation of your first territories, after which additional territories are a snap. Chat and email support will get you past any roadblocks, like Point vs. Boundary ZIP codes (yes – that’s a thing.)
Competitor software offerings tend to be more complicated. GIS competitors, like Maptitude, require a Rocket Science degree and a subscription to MIT Calculus magazine to create a basic map.
Complex Territory Hierarchies
Ease of Territory Editing
Once those territories are created, they must be managed. Unfortunately, my friend, nothing stays the same in life. MapBusinessOnline enables mouse click territory selection leading to a menu of editing options including operations like:
Add to
Remove from
Remove from all Except
Update
Intersecting
Create New
Holding down the shift key during the map layer selection process enables multiple map object (ZIP code) selection. These easy-to-learn tools will make you the expert at creating and managing territories for your sales team in no time.
Updates and changes to territory maps are critical to your sales process. Many businesses optimize their territories based on a variety of metrics which could include: the number of accounts, travel requirements, legacy accounts, product spread, or other industry-specific measures. Choose a sales territory mapping software that makes the change management portion of your job easy, fast, and fun.
MapBusinessOnline is More Affordable
While MapBusinessOnline is priced below our competition, it is important to also compare the features and allowances, when determining which business mapping software is the best solution for your business.
MapBusinessOnline offers generous location data import allowances. Pay attention to the amount of data our competitors allow. They tend to be stingy
MapShare free viewer sessions are extremely affordable – in fact, shared map sessions are free up to 1200 sessions a year. Every subscription includes the ability to share interactive web maps for free
Business listings are available for you to search, map, and to export at $0.15 per listing
Extra routing credits for vehicle routing or drive time calculations are also available for a small fee, should you run out of your subscription’s generous allowance
There are still Microsoft MapPoint replacement seekers landing on MapBusinessOnline.com every day. They come seeking an online mapping solution that can replace MapPoint and provide a similar user interface. We’ve converted thousands of such MapPoint refugees over the past five years.
MapBusinessOnline’s look, feel, and user interface comes very close to MapPoint. Your most dedicated MapPoint users will feel relieved after they make the switch and start accessing up-to-date ZIP codes and Demographic Data. Don’t waste any more of your associate’s valuable time working with obsolete maps and demographic data. Get access to state-of-the-art mapping features.
Territory Map Layer Flexibility
For some companies, sales territories are simply groupings of ZIP codes in organized sections surrounding the home location of salespeople or within a specified radius of an office or a warehouse. Other businesses require more complex sales territories.
Complex sales territories often exist for good reasons. More advanced businesses can turn to MapBusinessOnline for flexible territory development that offers multiple sales territory options:
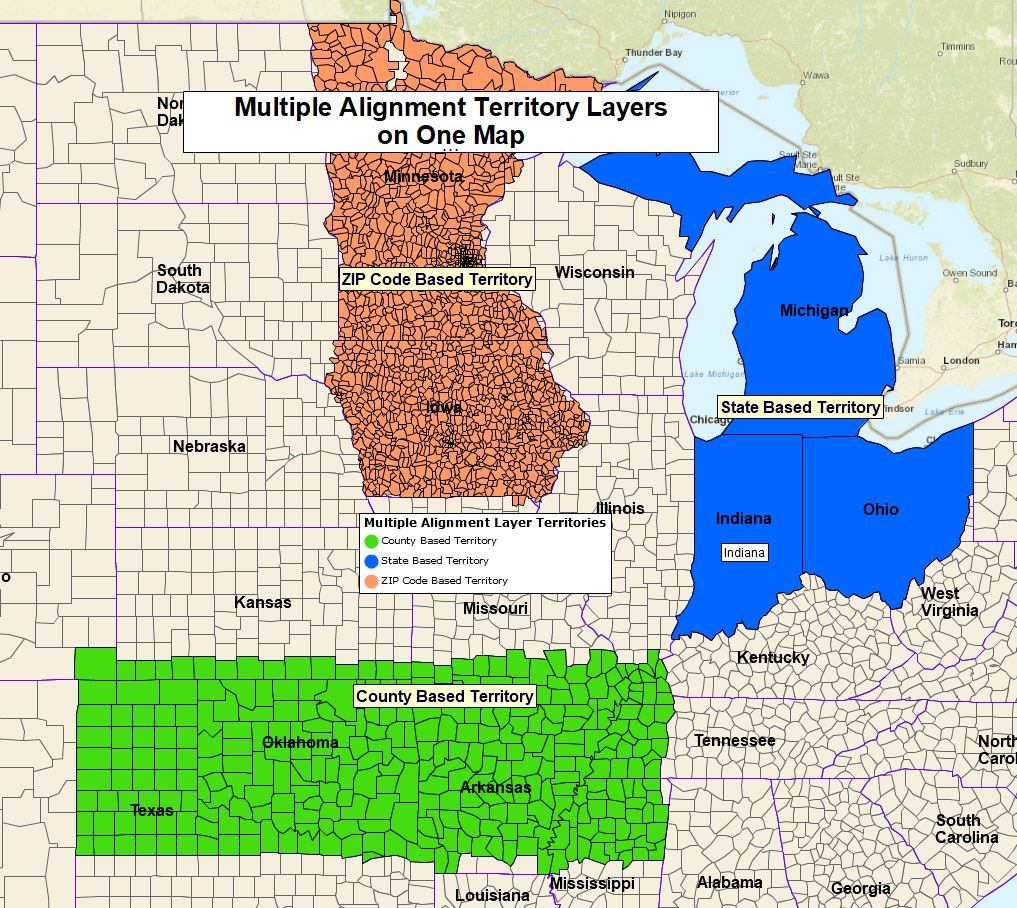
Create multiple sets of territories on several map layer geographies – ZIP code and county for instance – all on one map
Identify areas of overlapping sales territories. Show ZIP codes belonging to more than one sales territory in bright red or black – you choose the color
Leave some states or counties whole and split other states and counties up into smaller segments
MapBusinessOnline Standard and Pro offer advanced territory management tools that will support your organization’s sales force as they set-up sales territories and maintain them moving forward.
Unparalleled Technical Support
For more than 95% of our customer base, we never receive help requests, which speaks to the ease-of-use of MapBusinessOnline. But the other 5 percent, who may require some assistance we offer multiple ways to access technical support:
Chat with a technical sales rep during business hours. Ask us anything. We’ll get you on track in short order
Email for technical support or request a web-share demonstration of the product
Call the technical support 800 number
Read our blog which contains hundreds of user scenarios and how-to documents on popular features and applications
The more visual folks may want to peruse our YouTube video library filled with video demonstrations of common practices
Lastly, read what our customers have to say about MapBusinessOnline on one of our review sites.
I could ramble on about why MapBusinessOnline.com is the preferred mapping solution for the Universe at large, but I’ve got to get this blog posted. Suffice it to say, MapBusinessOnline’s features are designed for business people just like you, who just need to create a map as part of their business process or business analysis.
Value-Added Resellers – Offer the tool to your customers as a reseller. Make money on training and consulting. Contact us with further interest in reselling MapBusinessOnline.
Up here in New England, it’s getting hot outside. What better time than during a heatwave to discuss heat mapping? After all, heat maps are excellent.
Heat maps describe business or human activity by color-shading data values over specific locations or areas. A business map depicts the concentration of sales transactions by address or just like the intensity of thunderstorm activity across a weather map.
MapBusinessOnline includes a heat map button on the Master Toolbar. This button creates color-intensified areas across a set of location data points based on the numeric values assigned to those points on the map. Heat maps are great for showing sales intensity by account or by salesperson—a great addition to a sales territory map or sales planning map.
The MapBusinessOnline Heat Map function does not display the intensity of data by ZIP code. Use the Color Coding toolbar section Boundary button to accomplish heat mapping intensity by ZIP code.
There are two different types of heat maps:
Heat maps that reflect data intensity by location points – like the heat map button in MapBusinessOnline, and
Heat maps that reflect data intensity by areas such as ZIP codes or Counties
Your boss or associate may expect their requested heat map to show point-based or ZIP code-based heat mapping. Please make sure you are clear on their requirement.
ZIP Code Heat Maps
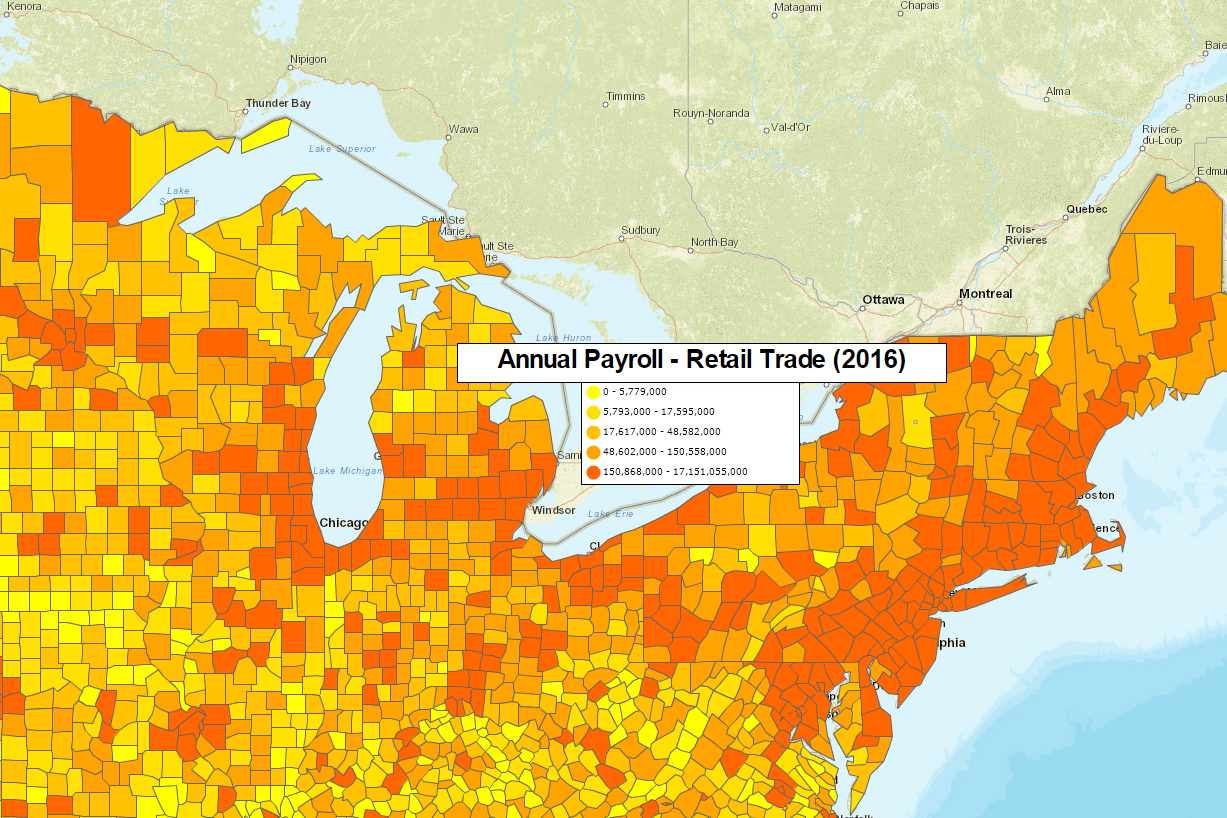
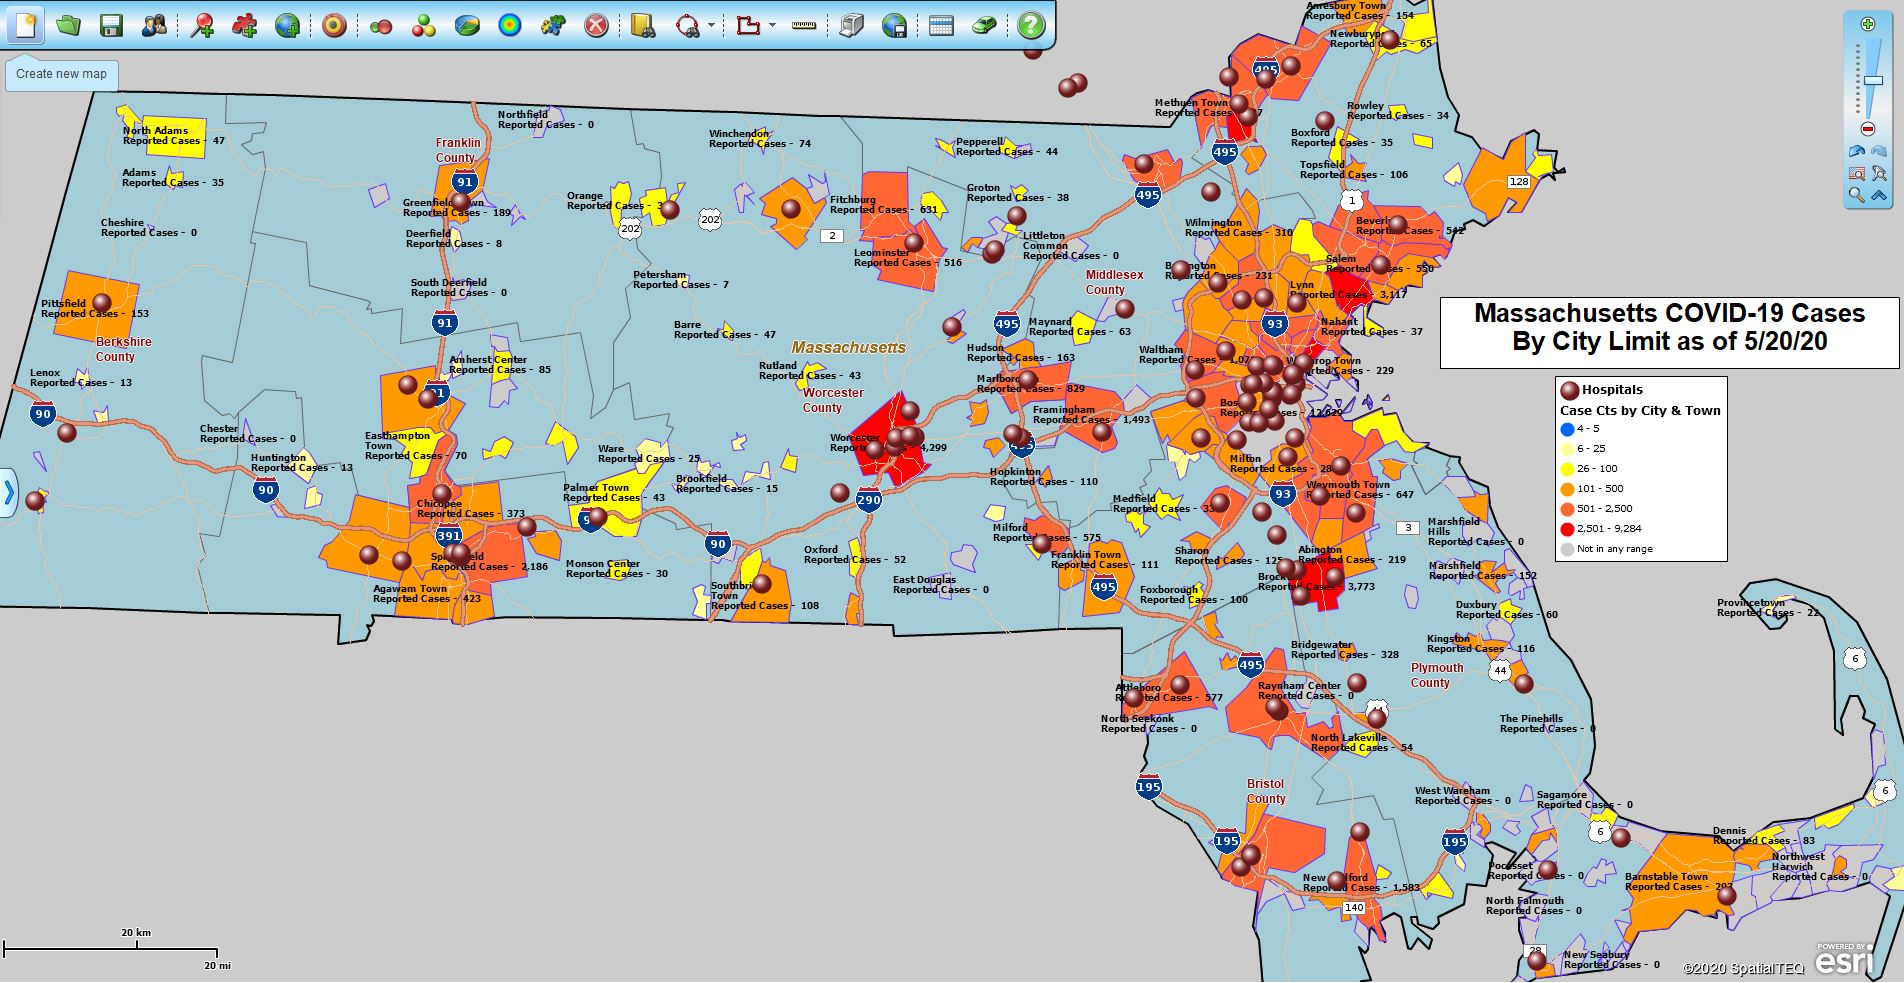
A ZIP code heat map links a set of location data points to a group of ZIP codes. The ZIP codes would then be color-coded based on the numeric value of the data the map creator is required to highlight. The map below reflects imported location data showing COVID-19 cases by ZIP code, which corresponds closely to cities and towns in Massachusetts. I color-coded the ZIP codes based on the COVID-19 case numeric data column in the case displayed.
COVID-19 Heat Map by ZIP Code
In general, the term heat map is used because maps that display data intensity tend to use colors toward the red or hotter side of the color spectrum. These maps use redder colors to reflect more intensive concentrations of the imported numeric data.
A heat map is generally created for towns, counties, states, or Census tracts. ZIP 5 codes are a popular area unit of measure for heat mapping because they are relatively small and relatively familiar to all US citizens. ZIP codes can be color-shaded to reflect local or national data values. MapBusinessOnline also includes ZIP 3 codes, Metropolitan Statistical Areas, and even Congressional Districts, which could all be heat mapped. How cool is that?
ZIP 5 Heat Mapping in MapBusinessOnline
I know; stop yapping and tell me how to do it, you’re thinking.
Import the location data you’d like to turn into a Heat Map. A ZIP code map will reflect heat map intensity for address-based imported data points.
The imported data should include location columns like these:
Click the Color Coding Boundaries button on the Master Toolbar – 3 Puzzle Piece Icon.
Select the map layer you want to Heat Map – in this case, ZIP codes
Select your target imported dataset
Select your numeric value column
Within the Color Code Map dialogue, move down to select a range ( 2 to 100) and color scheme.
In general, keep the range at 2 to 5 ranges. Fewer ranges maintain a less chaotic map. Too many color options make the map difficult for the user to understand. At some point, with too many range levels, your heat map becomes a hot mess.
Apply colors in a gradation scheme – cold to hot, low to high
Some preselected graduated color schemes are at the bottom of the Range/Color tools. These make color arrangements that are easy to read and easy to apply
Click done
Review the map and your ZIP code color scheme. Make sure your map intent is displayed. It’s easy to rerun the Color-Code Map process and make adjustments.
That’s how the ZIP code heat map is done in MapBusinessOnline. Compare it to our traditional heat mapping approach outlined below, which you might like better.
Click the Heat Map button just to the left of the Color-Code Map button
Select your target imported data layer. Click next.
Choose a color scheme and a heat radius that controls the intensity
Select which column in your data contains the numeric data to be heat mapped
Finally, choose Preview or Done.
Once the heat map is complete, it is wicked easy to go back to the beginning and readjust the settings or try a few tweaks. Click done and see how it looks.
After installing the Map App, the MapBusinessOnline launch button will be in the Windows Start Menu or Mac Application folder. Find the MapBusinessOnline folder in the Start Menu scrollbar. Click the folder’s dropdown arrow and choose the MapBusinessOnline option.
The Map App includes the Map Viewer app for free non-subscriber map sharing.
Please read customer reviews or review us at Capterra or g2crowd.
Sometimes we get simple MapBusinessOnline questions on Chat that deserve quick answers, and perhaps some longer-term users may wonder about these same basic processes too. So, here’s a list of simple MapBusinessOnline processes you might wonder about. After all, we are an easy mapping software.
I’m New, How Do I Access the Mapping Tool?
A valid question. Currently, there are two ways to access MapBusinessOnline online mapping software.
Download the Map App for Mac or PC. We recommend that you access your business maps this way. It avoids the need for Adobe Flash Player. In general, IT departments prefer downloaded Apps to Adobe Flash Player. The Download is Here.
Access the Web Map. On MapBusinessOnline.com, scroll down to the bottom margin and click the Web Map link highlighted in blue. This will open up the web browser-based mapping tool. These web maps are rendered through the Adobe Flash Player platform. Adobe is scheduled for termination on December 31, 2020. Please consider using the Map App as mentioned above. An alternative web browser-based map rendering tool is under construction.
How Do I Delete A Map?
On the Master Toolbar, to the far left, click the Map Library Folder, or the Open Mapand Manage Saved Map button. The dialogue reveals the My Maps panel. Hover your mouse cursor over the map titles listed and you will notice a Red Button with a White X appears on the right side of any map file. That’s the Delete Map button. Find the map you wish to delete and then get that red button to show up again and click it. “Bada bing, Buda bang, ” your map is history.
Make double sure you want to delete that particular map. And make triple sure that that specific map is the map you want to delete. I can’t tell you how many times a user deletes the wrong map. Retrieving a deleted map is time-consuming and will cost you at least $300.00. Be sure.
I Lost the Map I Was Working On
Two important concepts to understand here. First, to really save a map you must click the Save button on the master toolbar – three buttons in from the left. That puts the map in the Map Library Folder, or the Open Map and Manage Saved Map button, as mentioned above.
Second, MapBusinessOnline.com is a web app. So, if you are working in a browser-based version – Chrome, Edge, Firefox, Opera, or Safari – the web-browser will cache or preserve a view of the last thing you were doing in MapBusinessOnline. It does this with all the web applications you use.
People often get lulled into the belief that their map has been saved. It hasn’t. You have to click that save button to save your map. Where this can be tricky is when a map user, changes their web-browser for whatever reason. If you’ve been using Chrome for a month, you come into work, you open Chrome and your map is there. You do your work. But if you change web browsers and use Firefox one day, instead of Chrome you will open MapBusinessOnline and the map will not be there, because it’s not cached by the browser. Hopefully, you saved the map and it is snuggled safely in your Map File Folder library.
If not, call us in a panic. We may be able to restore your map files, but it will cost you – as mentioned above $300.00 to cover human and machine time.
I Got A New Computer – How do I Get My MapBusinessOnline?
Just go to Www.MapBusinessOnline.com, download the Map App, or access the Web Map as described above. All you’ll need is your login email and password. There is always a password management process available at login.
Microsoft Internet Explorer Browsers Can Get Squirrelly
Microsoft has canceled some support for Internet Explorer 10. IE 11 may still be supported for some businesses using advanced Windows Apps. If your company is still using Internet Explorer as a Web Browser and you encounter issues using MapBusinessOnline the cause may be the ActiveX filtering setting in IE. Please try clicking on the settings gear icon in the top right corner of the IE window. Next, go to Safety and uncheck ActiveX filtering if it is checked on.
Occasionally, the installation of the Map App can get corrupted. Evidence of an issue with the installation could include:
Not finding a launch icon
The application won’t boot up from the App
The best answer, if you have trouble updating the App on a Windows machine, is to go to the Start menu and launch the App from there. That will generate an automatic update to the Map App.
Otherwise, an uninstall and reinstall might be required. In a Windows machine, in the Start Menu Search Bar find MapBusinessOnline. Right-click on the App in the Start List. Choose Uninstall. When that operation is complete, download the App once again and let it install.
On a MAC there should be a MapBusinessOnline Map App Icon on the Desktop. Launch the App from this Icon. If you can’t find an Icon, look in the Applications Folder.
For further assistance please Chat or Email us for support.
Zoom Tools
Sometimes new users need assistance with the map navigation tools. Here’s a quick primer:
Double click on the map and you’ll zoom in. Be aware that if a map layer like ZIP codes is turned on your mouse click may select a ZIP code, instead of Zooming in. In this case, uncheck the ZIP code layer.
In the upper right, you will find the Zoom Tools.
Use the Scroll Bar to Zoom in and out or click the Plus/Minus buttons
Click the Magnifying Glass icon on the bottom and then drag a Zoom box on the map. This is my preferred way to Zoom in on the map. Once the zoom operation is done, uncheck the tool
Note the forward and back buttons to repeat or undo a fancy move you just made on the map
Click the American Flag to Zoom to a Continental USA view
Click the World icon to Zoom out to a worldwide view
Minimize the Zoom tool control panel the by clicking bottom right blue up arrow
Text Tools in MapBusinessOnline
Address Bar
Also a navigation aid, the Address Bar is the blank white space located in the upper left-hand corner of the application, just above the six left-most buttons on the Master Toolbar. Here you can type in an address, a ZIP code, or a Lat/Lon address to Zoom to a place on the map. This comes in handy.
Address formatting must include commas: 19 Norwood Avenue, Rockport, Ma
Lat/Lon formatting is important too: 32.53026, -86.458
Saving a Map Image with Data or Dialogues Open
Sometimes it is effective to save a map image showing the Data Window or part of a Map Dialogue operation open. The Save Image File button on the Master Toolbar will save an image of the Map only.
I often use the Microsoft Snipping Tool to capture images for maps with full views including exactly the features I want to ad – like the Data Window. To do this well and keep your map focused, you should close all Toolbar areas, focusing the map viewer on the map itself. Toolbars would include the Master Toolbar, Zoom Scroll Bar,
Close Map & Data by clicking the X in the upper right
Close the Master Toolbar by clicking the Tiny up arrow located just to he left of the Address bar
Minimize the Navigation Zoom Tool by clicking the Up Arrow in the lower right on the panel
In general, I would hope that this blog serves as a great help tool for all users. Use the blog search tool in the upper right. Search on words like: Import, Radius, Route, Territories, and Laxative. Ok, not Laxative. I’m just testing to see if you’re still reading…
Here are some additional Blogs designed to support new users to MapBusinessOnline:
The Map App install is fast and easy. The Map App is a cloud-based service, once you’ve logged in you’ll have access to all of your previously saved maps and data. The Map App is a better user experience and provides access to more features than the Web App. The Flash-based Web App link will remain available until December 15, 2020.
The Map App includes the new Map Viewer app for free non-subscriber map sharing.
Value-Added Resellers – Offer the tool to your customers as a reseller. Make money on training and consulting. Contact us with further interest in reselling MapBusinessOnline.
What defines America? I think this is a question many of us have been asking ourselves over the last ten days. Who are the folks that make up our nation? It’s a wide range of groups. On a very basic level, a business map, with Census published demographic data can roughly describe the major segments of American society.
Demographic data for the USA is largely defined by the ten-year Census data collection. This once a decade process is happening now across the nation, as I write this blog. That decennial census will be updated and re-estimated every year until 2030 to keep up with increases or declines in populations by area around the nation.
MapBusinessOnline provides access to that Census Bureau demographic data layers and provides a set of tools for you to review that data from a variety of perspectives. When carefully crafted a demographic map can be relevant to political, social, or business conversations or analysis. But one must present your political map in as unbiased a way as possible or your map will lose credibility.
Demographic Data in Political Maps
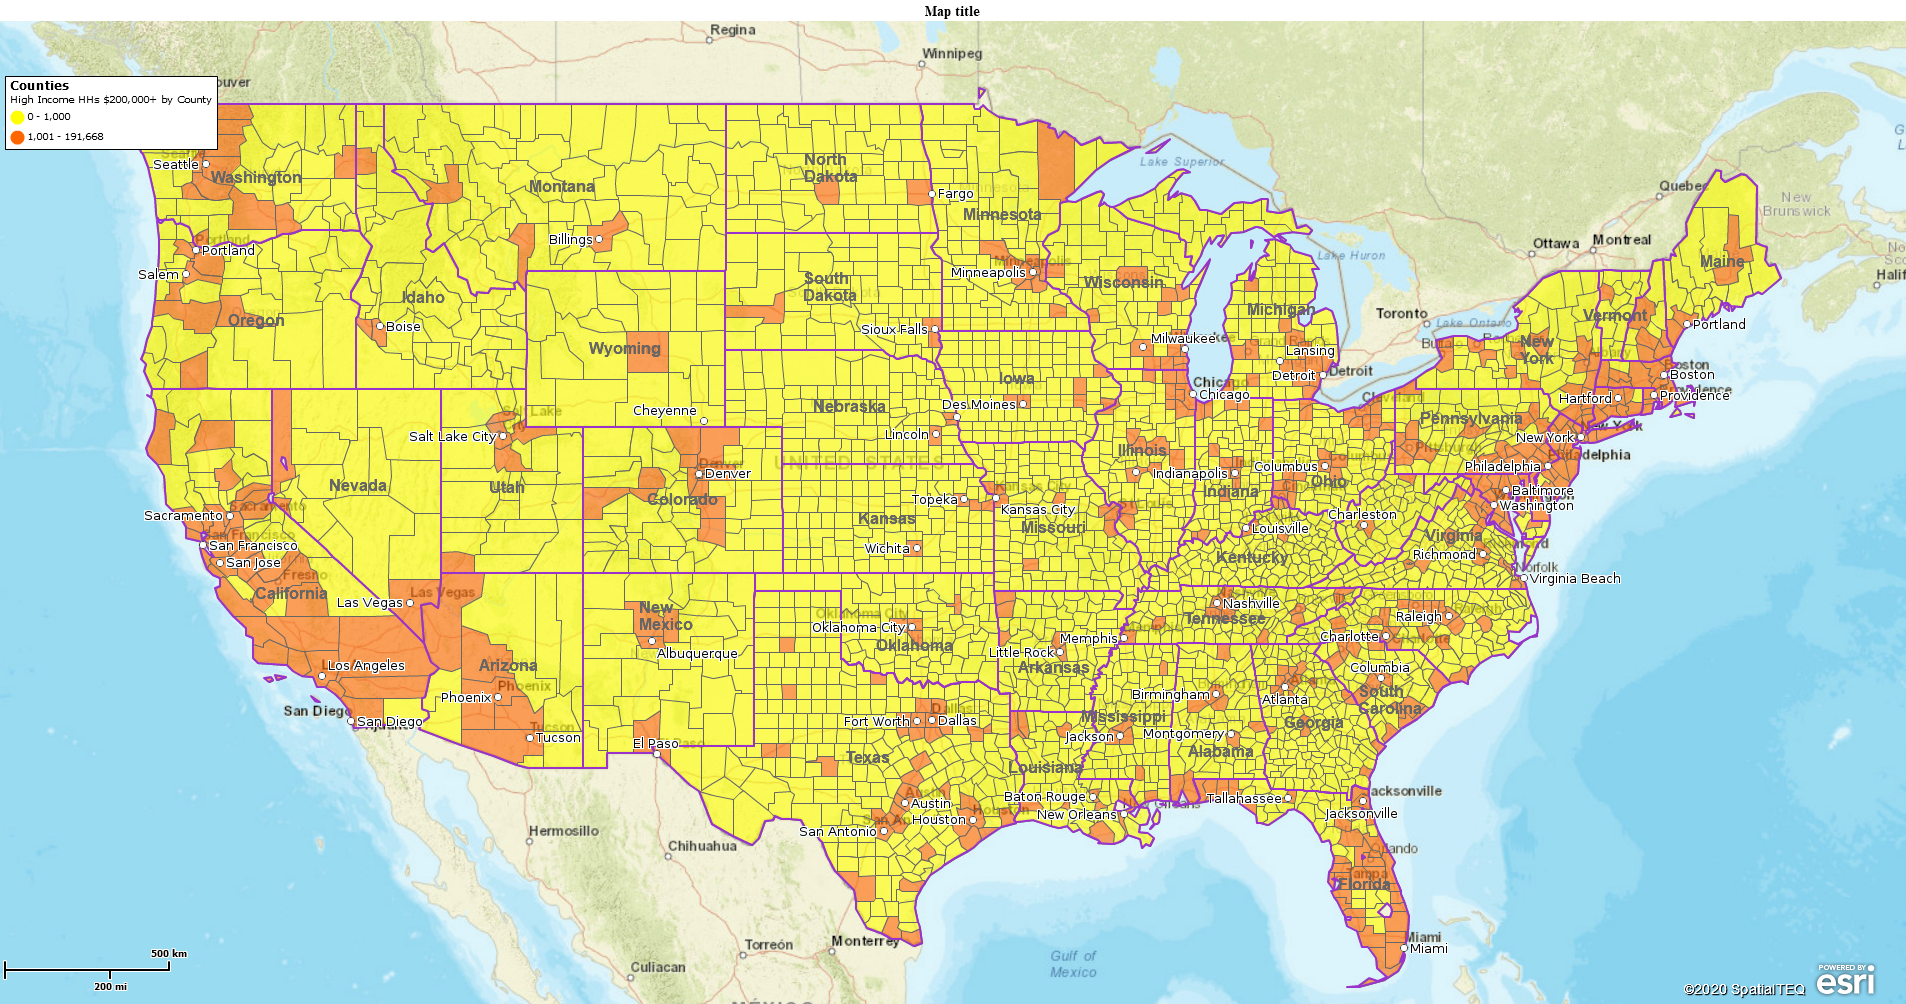
USA High Income Households by County
My first map, above, shows where the highest-income households are located. I selected the Demographics Layer for Households with incomes of more than $200,000 per household per year. Using the Color Code Map Button, I color shaded the county layer to show counties with 0-1,000 high-income households, and the counties where at least 1,001 or more of those high-income household earners reside.
One could argue there are better ways to segment the household allocations in this map view. MapBusinessOnline lets you control those allocations or ranges. You could add a few more ranges or segment the household quantities at different range points. My only recommendation is to keep it simple and be able to explain why you chose the ranges displayed on your map. MapBusinessOnline does offer a range suggestion which is an algorithmic application that weights the range scheme. I usually prefer a simple numeric range – 100, 250, 500, 1000. That sort of thing.
Please note, on this map, I turned on the State Layer for reference, changed the border to a thin purple color for easy-on-the-eyes definition, and I added a City point layer, also for reference. Keep that demographic or political map simple to view. Use colors that are pleasant to look at. Don’t complicate a map that’s bound to generate questions based on the subject matter.
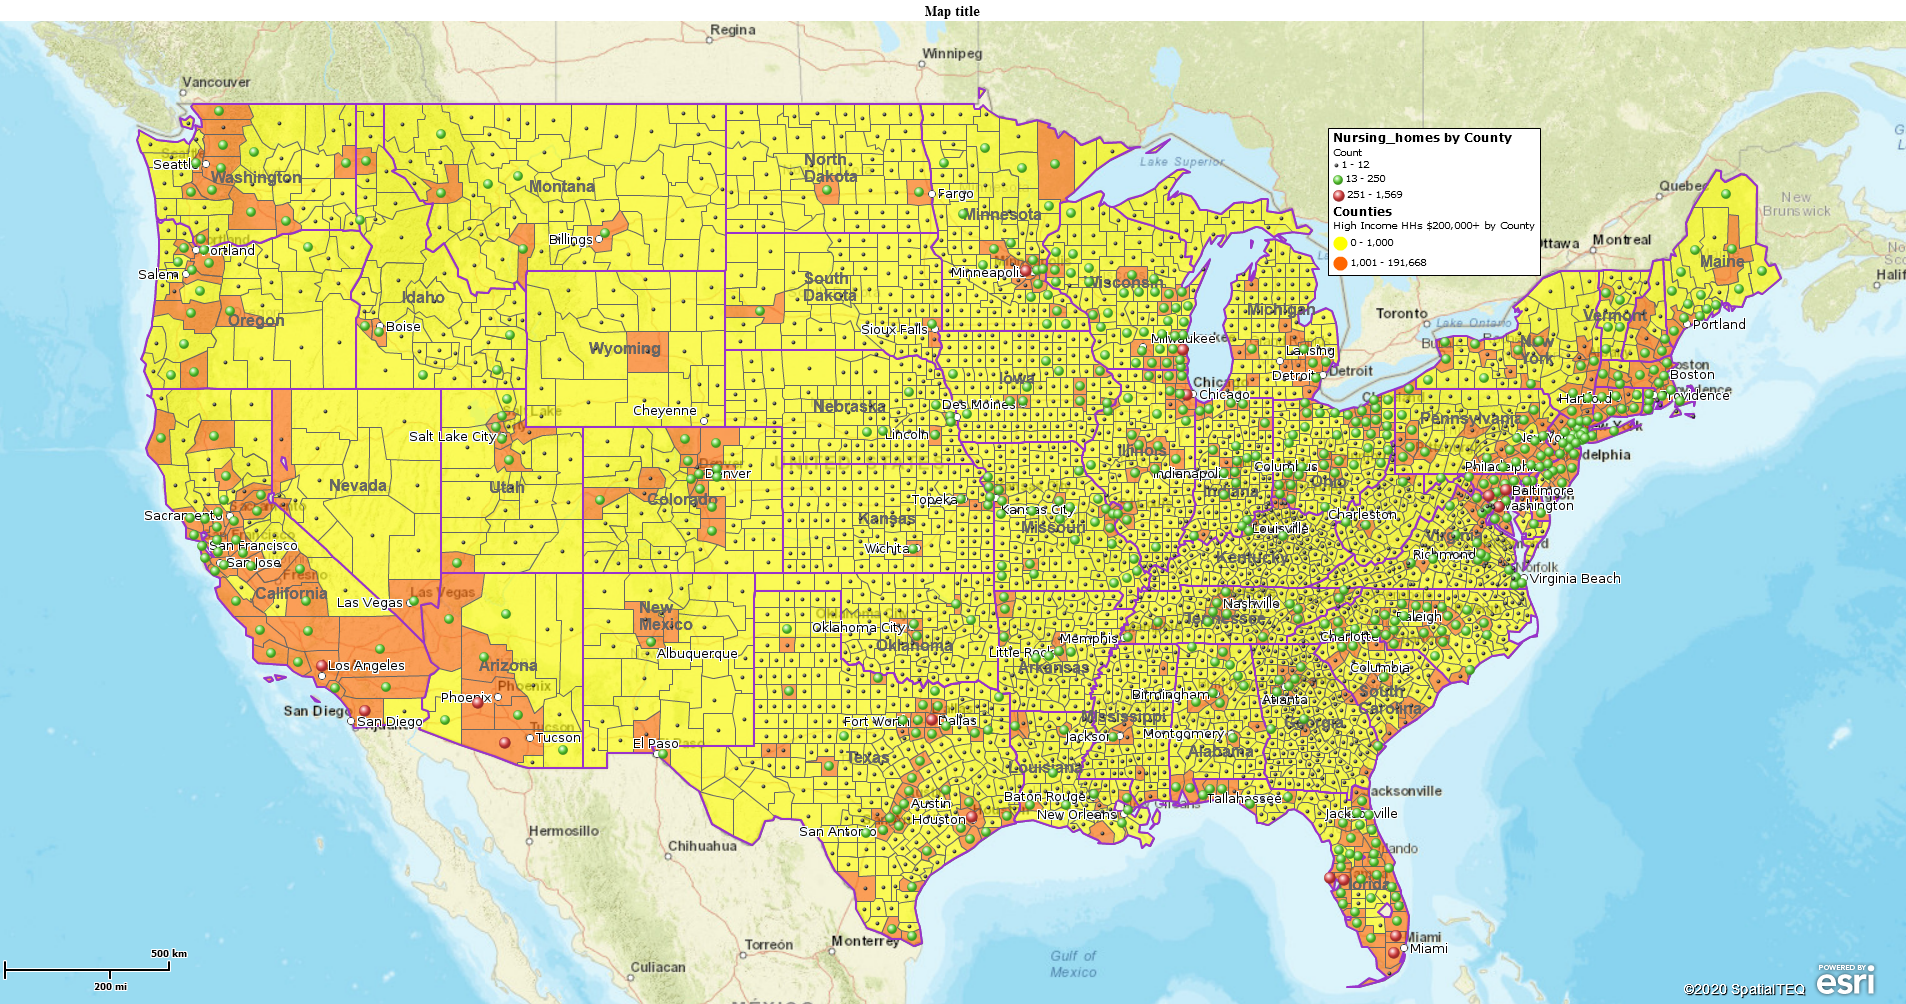
High Income Earners with Nursing Homes
I’ve added one more layer to this map – a point layer of nursing homes. I color-coded the point layer by county and set up a range to focus on where most of the nursing homes are located. No need for comment. Adding a relevant data layer changes the meaning of the map. The Pandemic, in my humble opinion, has shifted how we view the placement of our elderly in nursing homes. It’s relevant to almost any political map right now.
It’s difficult to say how the various divided political factions might view the above map. A Black Lives Matter group might refer to it as the White Privilege map. While Mitch McConnell might refer to it as his Most Lucrative Political Donor map. It certainly would appear, based on national news, that the political and financial implications of this map show a minority of households controlling a majority of wealth. This is a demographic fact based on location-based demographic data, not on opinion. The map simply answers the question, where does most of the money live?
Further, the map displays how, while our political and economic realities may divide us, we all live in the same general regions. Most of the recent protest cities are the very same cities where the wealthiest American households reside. At least, location-wise, we truly are all in this together.
Apply Calculated Data Columns
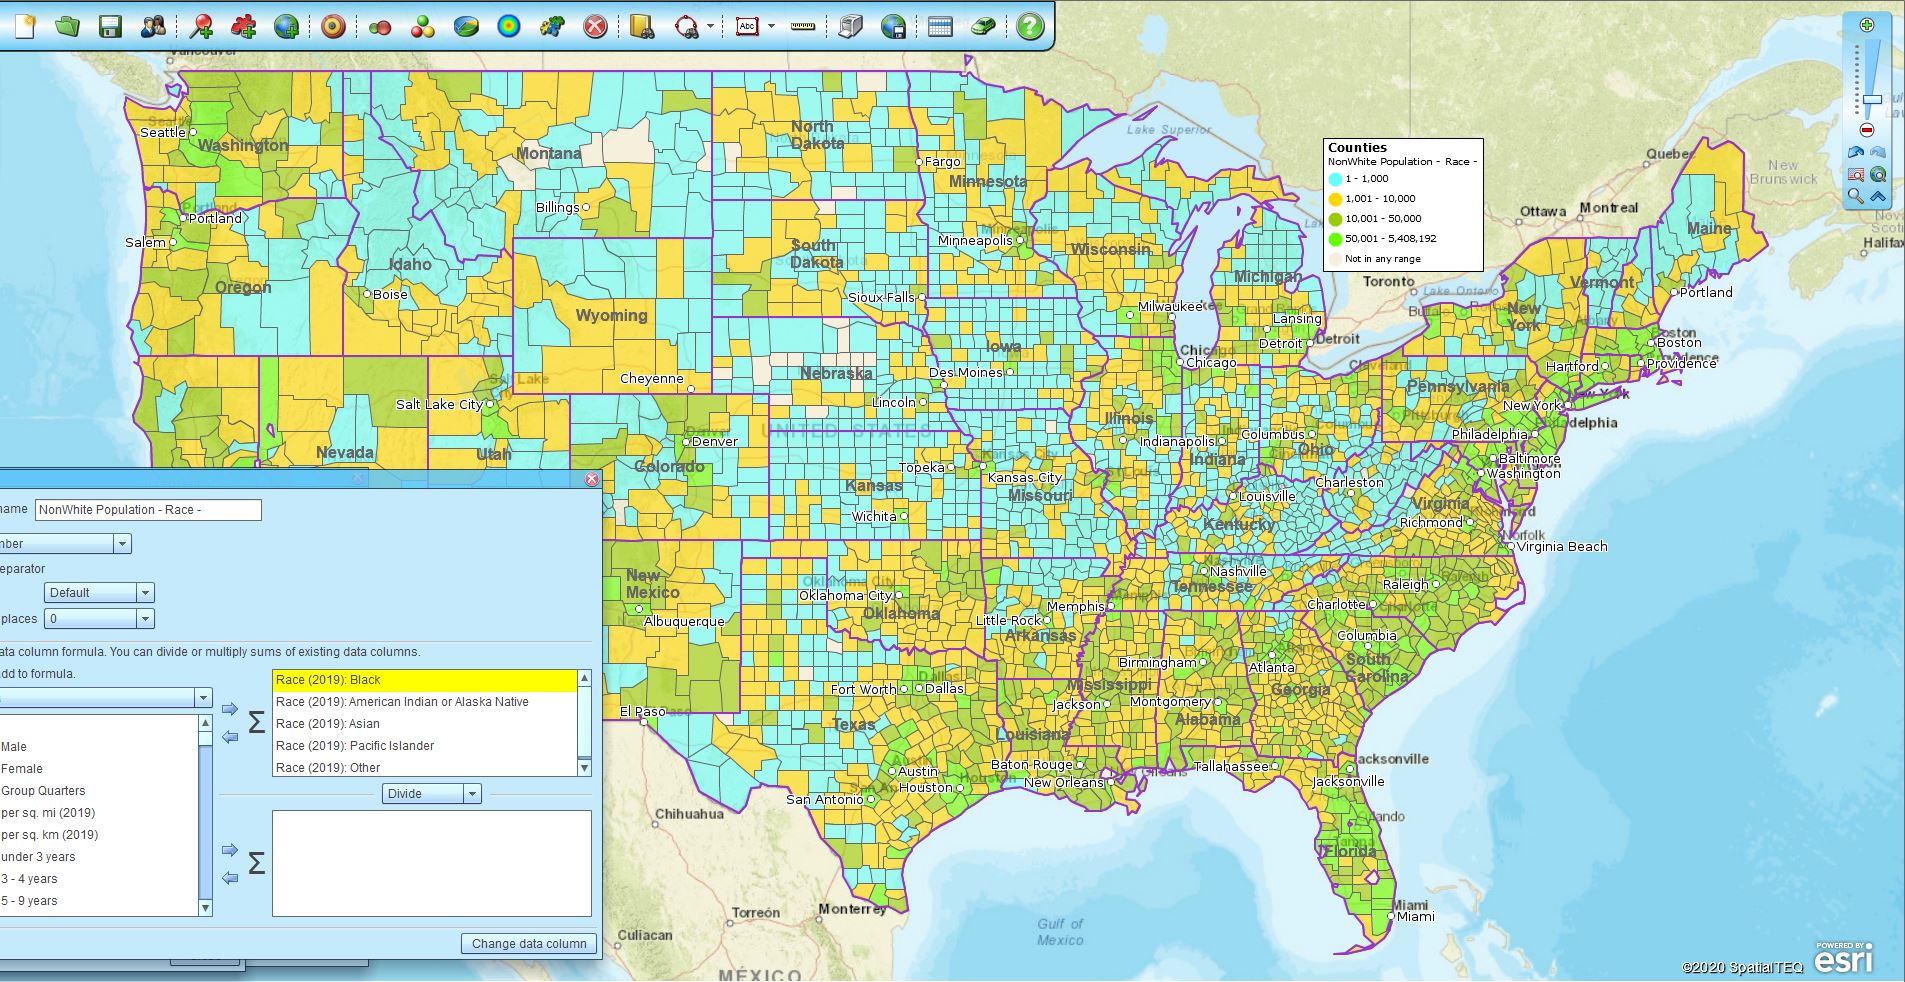
Another way to use MapBusinessOnline is to combine or sum demographic data layers using the Calculate Data Columns functionality. MapBusinessOnline Calculated Data Columns easily combine demographic data layers into new and relevant map views. Read about how to use Calculated Data Columns.
Non-white Populations
This racial demographic map uses Calculated Data Columns to total up all the non-white race layers into one NonWhite layer. I left the Calculated Data Column dialogue open to show where the numbers are derived from. If we zoom-in to a county view we can describe the break down in population between whites and other segments. Now we must understand a little bit more about how the Census Bureau breaks down their categories:
"The race and Hispanic origin categories used by the Census Bureau are mandatedby Office of Management and Budget Directive No. 15, which requires allfederal record-keeping and data presentation to use four race categories(White, Black, American Indian and Alaska Native, Asian and Pacific Islander)and two ethnicity categories (Hispanic, non-Hispanic). These classificationsare not intended to be scientific in nature, but are designed to promoteconsistency in federal record-keeping and data presentation."
It is important to recognize that the Census classification system treats race and ethnicity as separate and independent categories. This means that within the federal system everyone is classified as both a member of one of the four-race groups and also as either Hispanic or non-Hispanic.”
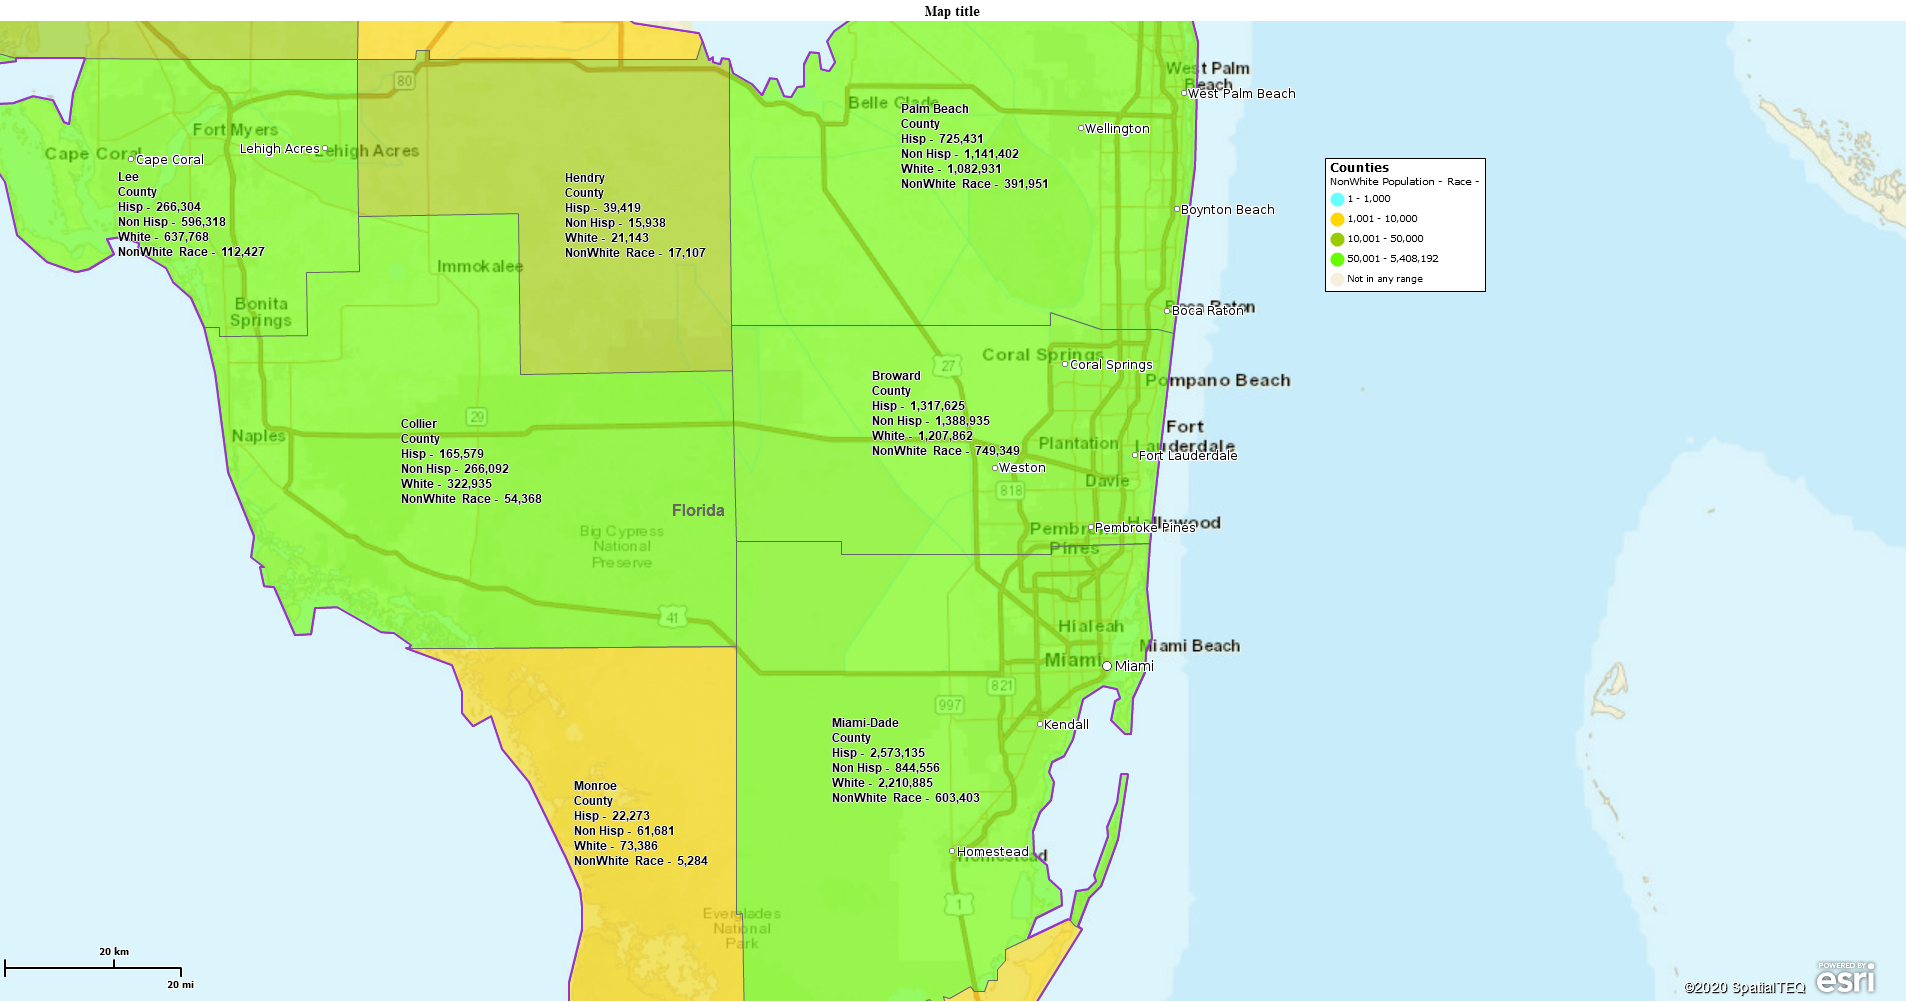
Using a combination of Calculated layers and as published Census layers, I have tried to show a comparison of the White population to Hispanic and NonWhite populations. If you were trying to show voter-power of any segment, it would be a difficult case to make with these totals. There’s a fair amount of overlap, in my view. But one could make the point that the white majority is under pressure. Especially if you zoom the map into everyone’s favorite electoral impact counties: Broward, Miami, and Dade counties on Florida.
Exploring Ethnic Majorities & Minorities
Here you can see that no matter how you slice it, white America is becoming a minority. And it explains some of the political maneuverings from both political parties for Florida. A divisive issue like gun control inserted into an election between a white and a minority candidate can peel off voters from one side to the other.
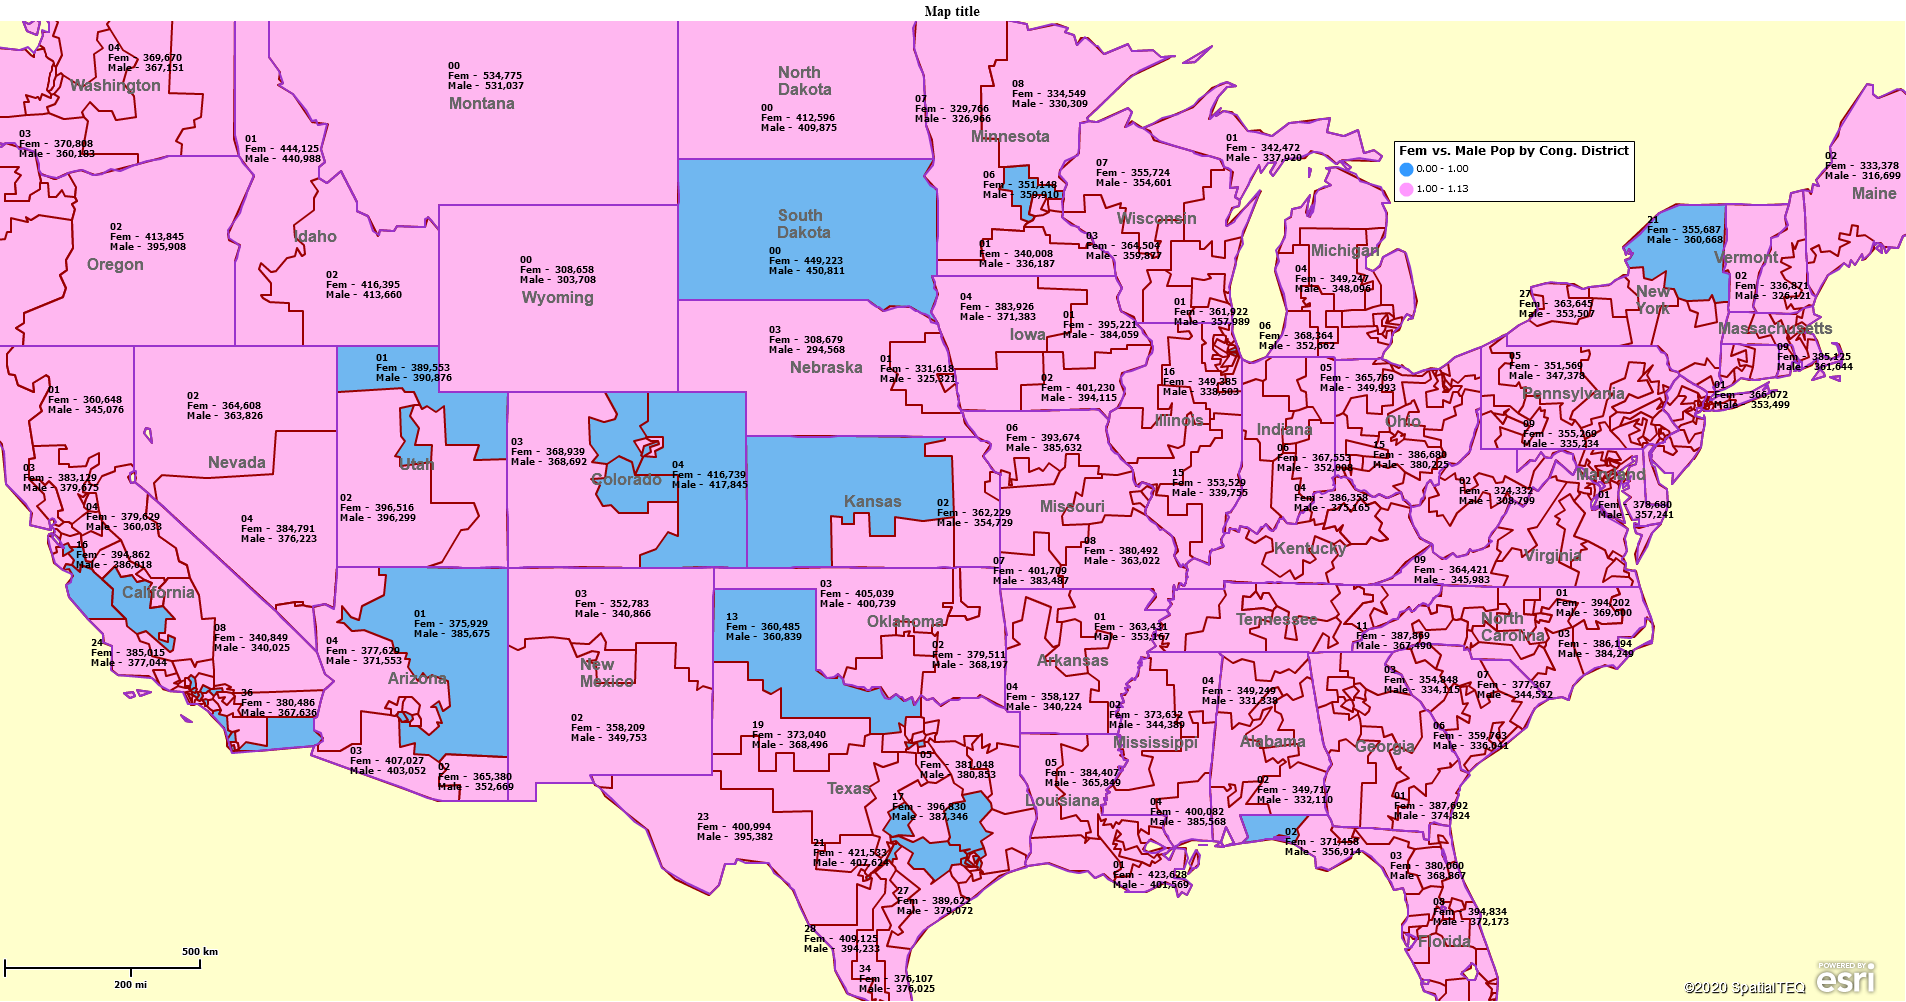
Finally, I’ll leave you with one more political map that may be of interest to Presidential Election Campaigns for the year 2020. I used Calculated Data Columns to run a formula:
Female to Male Ratio by Congressional District
Female Population/Male Population.
While Census population data does not reflect party affiliation or voter registration the map is telling. I used that ratio result to color code Congressional Districts, a map layer in MapBusinessOnline, pink for majority female and blue for majority male. One might think catering to the female vote would be wise for a political candidate in these pink districts.
I showed this map to my wife. After expressing her opinion, she drove me to the emergency room. I’m fine.
When building a political map, especially within a polarized political climate, make sure you understand your data and build your map carefully.
Value-Added Resellers – Offer the tool to your customers as a reseller. Make money on training and consulting. Contact us with further interest in reselling MapBusinessOnline.