Accessing Map-based Business Intelligence

Map-based business intelligence is information a business manager might derive from a business map. One might also describe this information as location-intelligence. Digital maps have been applied to business operations since Geographic Information Systems came of age in the 1960s and ’70s.  Today, digital maps are both easily accessible and affordable through cloud-based mapping software.

At first, the focus was primarily on government maps, but very quickly map-based business intelligence was picked up by the insurance industry, oil & gas companies, mining companies, and other land-based industries. All these industries are heavily tied to places on the Earth.

Early location-based digital maps were simple address-records or latitude/longitude points draped over an accurate map. During the 1970s and ’80s, USA address databases became more available and were utilized to add an address layer on top of a basic digital map of cities, states, counties and ZIP codes.

Later still, and coming along with the advent of the Internet, digitized vehicle routing became possible. MapQuest and other services started popping up online for both consumers and businesses to use to route from point A to point B and more. Google Maps were applied to basic business mapping needs.

With all those web-based services overlaid on a web map, business mapping tools were able to leverage software advances towards the aggregation, display, and analysis of location data. Lots and lots of location data; because there are just lots and lots of data layers out there.

Thank about it, business maps have access to so many data layers:

  • On top of every location on Earth is an overlaid the road network – major and minor roads
  • On top of that layer is an address layer – a constantly changing layer connected to where every homeowner and renter lives
  • Add to that layer Census demographic information for all nations, describing people, ages, incomes, expenditures, employment data, and more
  • Additional layers include property layers, oil & gas exploration finds, land-use/land-cover, flood maps, bird migration patterns, even a map layer describing wifi access points

Compiling all this data into a valuable and eminently usable business application was quite daunting at first but has become rather commonplace with the advent of cloud-based services across the Internet. Today business mapping software companies proliferate, and the question is, which mapping application best matches specific industry requirements.

Additionally, there are other types of, less land-based, business applications that are significantly enhanced through the use of map-based business intelligence. Examples include Customer Relationship Management tools (CRMs), medical systems software, enterprise resource planning, and the list goes on. La-di da-di da. (Lame-o Sonny and Cher reference.)

What are Examples of Map-based Business Intelligence?

State-of-the-art, location-based business intelligence includes a variety of data categories all intended to expand the business user’s understanding of the world surrounding their business operations.  To improve situational awareness (to apply a little geo-business speak.)  Situational awareness could take into account:

  • Demographic trends and categories across ZIP code and county areas for market analysis
  • Prospective customer databases for sales and marketing campaigns
  • Medical businesses in proximity to HMO’s or insurance pools
  • All automotive car models and parts requirements by area, and for any model year
  • Gun owner registrations by address with mental health status and criminal records
  • Utility networks covering electrical, fiber optic, gas lines, and other power-related networks
  • Aerial imagery collections and street view databases
  • Registry of motor vehicle data
  • Business listings for all business across all industries across the United States

A business map user can leverage most data, as long as it includes a location component – someway to connect a data record with a place on the Earth. ZIP codes are a common reference point, but addresses are better – more accurate. Still, it depends on the data. IRS records are likely associated with an address, USDA aerial imagery with counties or states.

The careful combination of location-based data layers, business data, against an accurate base map is the recipe for map-based business intelligence.

So be on the look-out for relevant location data in your industry. Ask for it. Use it. Turn business data into compelling map visualizations. And share them.  Because data and map-based business intelligence are for sharing.

What Skills are Needed for Map-based Business Intelligence?

Business mapping software requires very basic computer skills. A user planning on generating map-based market analysis should be able to manipulate a web browser, import and Excel spreadsheet, and be comfortable with common online software processes like editing words, deleting objects, and searching for information online.

Map Business Online Pro provides an advanced set of map-based market analysis tools that will help you and your business access the power of location and drive time analysis.

Are you using the Map Business Online Desktop App for MAC or PC? It’s hipper than Instagram and it comes with your subscription. Impeach Adobe Flash Player!

Value-Added Resellers – Offer the tool to your customers as a reseller. Make money on training and consulting. Contact us with further interest in reselling Map Business Online.

Win a $20 Gift Card! Refer a business associate to Map Business Online in exchange for a $20 Amazon Gift Card!

America’s best geo mapping software.

Posted in Business Mapping Software blog post, Sales and marketing | Tagged , , | Leave a comment

How Do I Create and Optimize a Business Map Visualization?

We often describe the most popular use of MapBusinessOnline as a Map Visualization. People might wonder, “What is a map visualization?” What do we mean by business map visualizations and how does one decide what settings to apply for the best visualization possible?

A map visualization will incorporate your business data, imported as an address-based or latitude/longitude coordinate spreadsheet, and display that data against a map background of the USA or Canada (or some other area of the world) in a manner that highlights your critical business issue(s). Keeping in mind that critical business issues change from week-to-week.  Some business map users will even create maps with deceptive data visualizations. Not here though – we’re very ‘White Hat.”

Read More About Map Visualizations

Import Your Address-Based Data

Every business has address data. Usually, it’s a list of customers but it could be competitors, vendors, hospitals, insurance providers, churches, or even zoos. It’s your data, not ours. You decide what is important.

This location-based data may include sales values, staffed beds, retail sales, risk assessments – whatever. All that extra data comes along for the ride, but it will be critical to your map visualization in the long run.

Use the Plot Data button four buttons in from the left on the Master Toolbar to import your business data, typically you will be plotting an Excel spreadsheet. MapBusinessOnline plots points on the map at your data’s physical location and  against a USA based street map. Already you have a map visualization, albeit a simple on. (And I get ten extra points for using the word – albeit.)

Basic Map Elements

In MapBusinessOnline there are several key map elements available to create a more compelling map visualization. Later, you can get into more advanced tools, many of which I’ve written about on this blog. The key elements are:

  • Appling symbols to your data
  • Color-coding symbols based on a column of your data
  • Choosing the appropriate map background
  • Color-shading the map layers (ZIP code, County, State, etc.) based on your data
  • Adjusting the data and map layer labels to suit your map look and feel
  • Adding a map title, map legend, or text boxes

While adjusting these tools, always keep in mind the purpose of your map visualization and the map audience that visualization will play to. Keep the map simple, meaning – avoid complexity. Complexity distracts from your map’s purpose. I suppose you could even use your data to create a deceptive map visualization.  But let’s leave that to the politicians.

Map Symbols

As mentioned above, your business data as imported automatically gets assigned symbols. You can choose to adjust the symbols applied from the library of symbols or change the color and size of the symbols. The application will offer a dialogue regarding immediate adjustment, or in Map and Data, hover over the imported later, click the Edit Gear and get to work. You’ll also find symbol selection options in the Data Window. Read more about Map and Data.

These same controls will assist you in symbol adjustments for color and size. It’s a lot of fun to design your map look and feel this way. But please make your selections based on a professional look and feel. Avoid large symbols with bright colors. You’re building a business map, not a circus advertisement. Read more about color-coding points here.

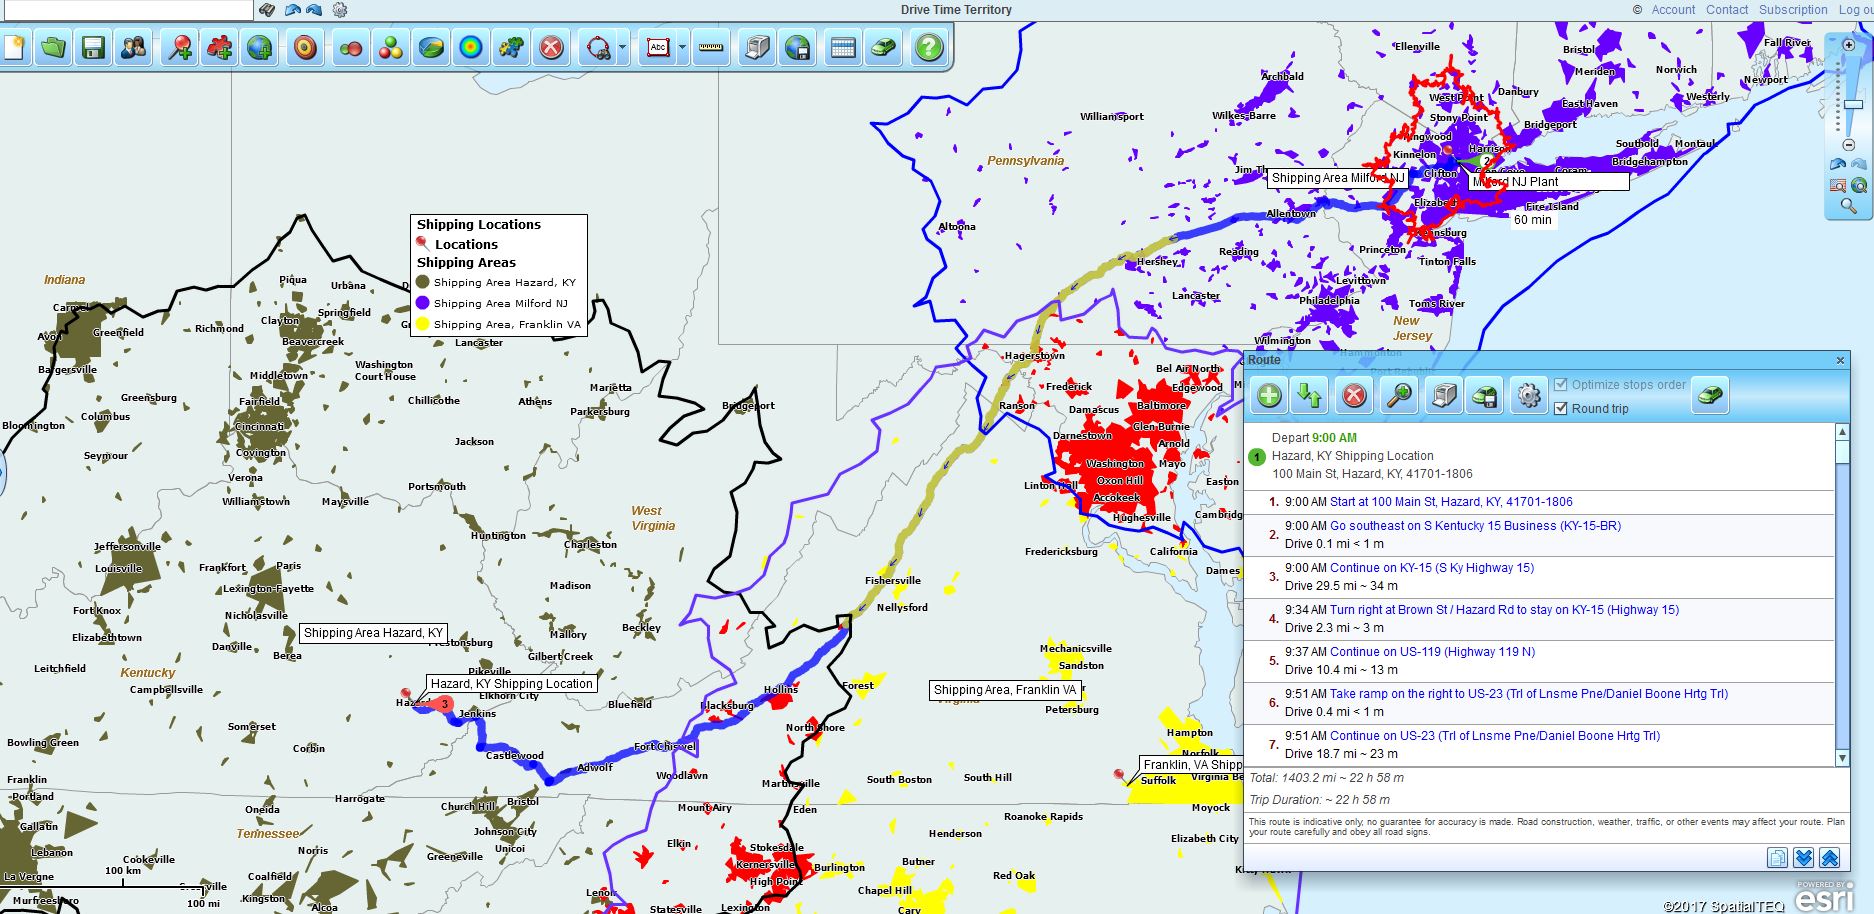
Using Drive Time Visualizations to Analyze Shipping

Map Layers

MapBusinessOnline includes a variety of map layers for you to apply to your business map. ZIP codes, counties, states, Census tracts, and more are there to add the appropriate level of administrative reference to your map. Think about your business and choose a map layer or two based on the business application reference requirement. ZIP codes are great for sales maps, counties might make more sense for health care coverage areas. Consider the areas your people generally talk about and then choose a map layer.

The state layer is a nice reference layer to include. It helps the map viewer know where they are on the map. Darken map layer boundaries, lighten up and make transparent map layer fills. Use Map and Data to make these adjustments.

While you’re in map layers is a great time to adjust map layer labels to include aggregates subtotaled sales or other numeric data by ZIP code or county. You’ve got five flexible fields to append data to, just pulling it from your columns or demographic data included in Map Business Online. Read more about labels.

Also regarding map layers, you may find it helpful to color the ZIP code or county layers by a column of your data or by a demographic category. Click the Boundary Button on the Master Toolbar and the dialogue pages with walk you through how to color-code a map. Ask yourself, will color-coding ZIP codes add value to my map purpose? If you think it will, then, by all means, color-code the layer. Read more about color-coding map layers here.

Background Maps

By now your map visualization is starting to look fantastic. But it might help to try a few of the various map background options. The map backgrounds are easy to access and apply. Simply go to Map and Data and scroll down to the lowest option. Try the various layers. Streets may be the best option but sometimes Satellite options and National Geographic data are nice too.

Also, keep in mind not having a background layer is also an option. Further, a demographic color shading applied to the ZIP or County layer might be the best map background for your map purpose. Thank it over. Ask a friend. Run it by the President on Twitter. (Well, maybe not that last one.)

Business Listings

Don’t forget, MapBusinessOnline also provides access to Business Listings. Access business listings from the Master Toolbar or from a Polygon or Circle map object. Look for the Yellow Pages book icon.

Business Listings Button

Business Listings are sourced from a major USA business list provider. They do cost an additional fee, but you can try the system with free credits that come with your subscription. You can also look up listings in different ways, including:

  • Industry Type (NAICS or SIC codes)
  • Business Name
  • Related phrases

Downloaded business listings behave just like any other imported dataset. You can color-code, query, and export the business listings.

Common Related Questions

  • What is a map visualization? – We’ve addressed this in the first section. But to take the question a step further, maps are a scaled-down representation of physical reality. Digital maps, like MapBusinessOnline or Google Maps, provide an accurate model of the Earth over which a business user can drape their business data. That business data, draped over a map view, constitutes a map visualization. Map visualization could be based on routing, simple data imports, or full-fledged sales territory maps.
  • How do I plot data on a map from an Excel spreadsheet? Plotting data from Excel is a common user process for MapBusinessOnline customers. Make sure your spreadsheet has headers on the columns. Arrange your location-based data components into separate columns. Below is an example. Read more details here.
Name Address City State ZIP Code Industry Customer Type
Tool Co. 100 Granite Rd. Rockport ME 01966 Steel Mfg

All the above Map Business Online tools and more can help you develop a map-based visualization of your business or your business situation. Maps connect business trends and patterns to a place on the Earth, which can, in turn, lead to more effective ways of conducting your business. In short, map visualizations lead to a more successful business. Without an albeit.

_______________________________________________

MapBusinessOnline access has officially transitioned from Web Browser (Adobe Flash Player) access to the Map App download access.

  • Please download the Map App from the website – https://www.mapbusinessonline.com/App-Download.aspx.
  • After installing the Map App, the MapBusinessOnline launch button will be in the Windows’ Start Menu or Mac Application folder. Find the MapBusinessOnline folder in the Start Menu scrollbar. Click the folder’s dropdown arrow and choose the MapBusinessOnline option. You can drag the icon to the taskbar for a quick launch button.
  • All saved maps will be available through your Map Library Folder, the second button in from the left on the Master Toolbar. (Green File Folder icon.)

Map App access to MapBusinessOnline.com provides enhanced features and a better user experience.

The Map App includes the new Map Viewer app for free non-subscriber map sharing.

Value-Added Resellers – Offer the tool to your customers as a reseller. Make money on training and consulting. Contact us with further interest in reselling MapBusinessOnline.

Find out why over 25,000 business users log into www.MapBusinessOnline.com for their business mapping software and advanced sales territory mapping solution. The best replacement for Microsoft MapPoint happens to be the most affordable.

Please read customer reviews or review us at Capterra, or g2crowd

Contact: Geoffrey Ives geoffives@spatialteq.com or Jason Henderson jhenderson@spatialteq.com

Posted in Business Mapping Software blog post, How to instruction | Tagged , , , | Leave a comment

The Map Business Online Year In Review

As 2019 draws to a close and the Holiday season once more drains my checking account, clutters my living space, and tests my gift wrapping abilities, it’s time to reflect on the changes and improvements in Map Business Online over the past few years.

Map Business Online was one of the first cloud services dedicated to Business Mapping. Launched in 2010, the tool focused on matching and bettering Microsoft MapPoint, the dominant business mapping software at the time.

By 2019, MapPoint is a thing of the past, but many ex-MapPoint users have yet to replace the tool. Map Business Online continues to grow and proliferate, adding features and improving processes with every version release and data update.

A Variety of Industry Uses

Our customer base continues to expand.  We’ve on-boarded a host of insurance, franchise, retail, healthcare, and services business in 2019. Our list of manufacturing companies using Map Business Online for territory management continues to grow. We’re also excited to see our major use case examples add market analysis to map visualization, territory alignment, and sales planning, as major applications for our cloud-based mapping service.

Recent Feature Expansion 

Some of the more innovative features and services added to our professional mapping software over the last 18 months include:

  • Advanced sales territory mapping tools. Sales territory mapping is how your business can conceptualize your business processes, clarify accountability, and organize planning efforts. Map Business Online territory management addresses sales overlap; the aggregation of sales dollars by territory and account; and provides comprehensive analysis views for demographic and internal data analysis
  • The ability to quickly, and affordably import up to 250,000 records per map. This capability, available in Map Business Online Pro, expands the total map and subscription import allowance by 250%. Standard subscriptions allow up to 100,000 records to be plotted. This is for companies with a large customer base or some significant analysis to generate
  • Expanded drive time analysis capabilities (Map Business Online Pro). By providing the ability to conduct spatial queries across multiple locations points by driving time and distance. Map Business Online Pro opens a whole new chapter in Market Analysis
  • Business Listings were added to Map Business Online in 2019. Sure, it’s a paid service, but when you need all the competitive businesses in an area, visible on a map, right now, it comes in very handy
  • We developed a downloadable Map App to avoid all those Adobe Flash Player issues as Adobe obsoletes it’s once ubiquitous Internet application platform. I use this all the time now
  • Demographic data has been included in Map Business Online since 2014. This year saw our library of demographic data options grow more than ever. We’re working on tools to make it easier to search and apply that ever-expanding library
  • Optimized vehicle routing capabilities that can convert imported location data into 150 stop, efficient routes for delivery or field staff management. Share route files in a variety of formats. Save and share map projects for constituent visualizations and independent route generation. Routing now supports time windows
  • Map Business Online Team subscriptions leverage your best minds towards collaborative map-based solutions to complex problems. Collaborative map editing tools enable two or more users to share maps for co-editing purposes
  • Thousands of MapPoint users have replaced the old business mapping standard with Map Business Online. Map Business Online does more than just replace MapPoint, it expands on MapPoint. We’ve got an MPT conversion tool and a set of APIs. But most ex-MapPointers just want map visualizations, ZIP code maps, territory maps, or routing tools. Stop sitting around moping about obsolete ZIP codes and bad street addresses
  • Regular updates to software and data occur monthly, behind the scenes – usually when users are sleeping or inebriated (;-)). Updates might install new software features, update ZIP codes, or map data. Cloud services are cool that way
  • Niche features have been added to both Standard and Pro subscriptions:
    • Radius Search option to search for up to 100 of the nearest straight-line records (Std & Pro)
    • Invert/Compliment – Search inside and outside of a radius or polygon (Std & Pro)
    • Enhanced symbology selections tools for color-coding points (Std & Pro)
    • Copy and paste options for Data Window rows (Std & Pro)
    • Summarize demographic data selection in map objects and the data window (Std & Pro)
    • Filler ZIP Codes that eliminate national park holes in territories shading (Std & Pro)
    • Ability to rename import layer files and territory layers (Std and Pro)
    • Customize dataset options to add columns or change column formats (Std & Pro)
    • Create multiple territories from one drive time query (Pro only)
    • Create Concentric circle maps with demographic data pulls (Pro only)
    • Support for territory Regions and Divisions (Pro only)

I’m sure I’ve missed a bunch of niche features that many of you use and enjoy. And I certainly haven’t listed all the standard features in both products here – there’s just too many. But what I can say is, you can look forward to further advancement in 2020 and beyond.

My Personal Favorite Use of Map Business Online in 2019

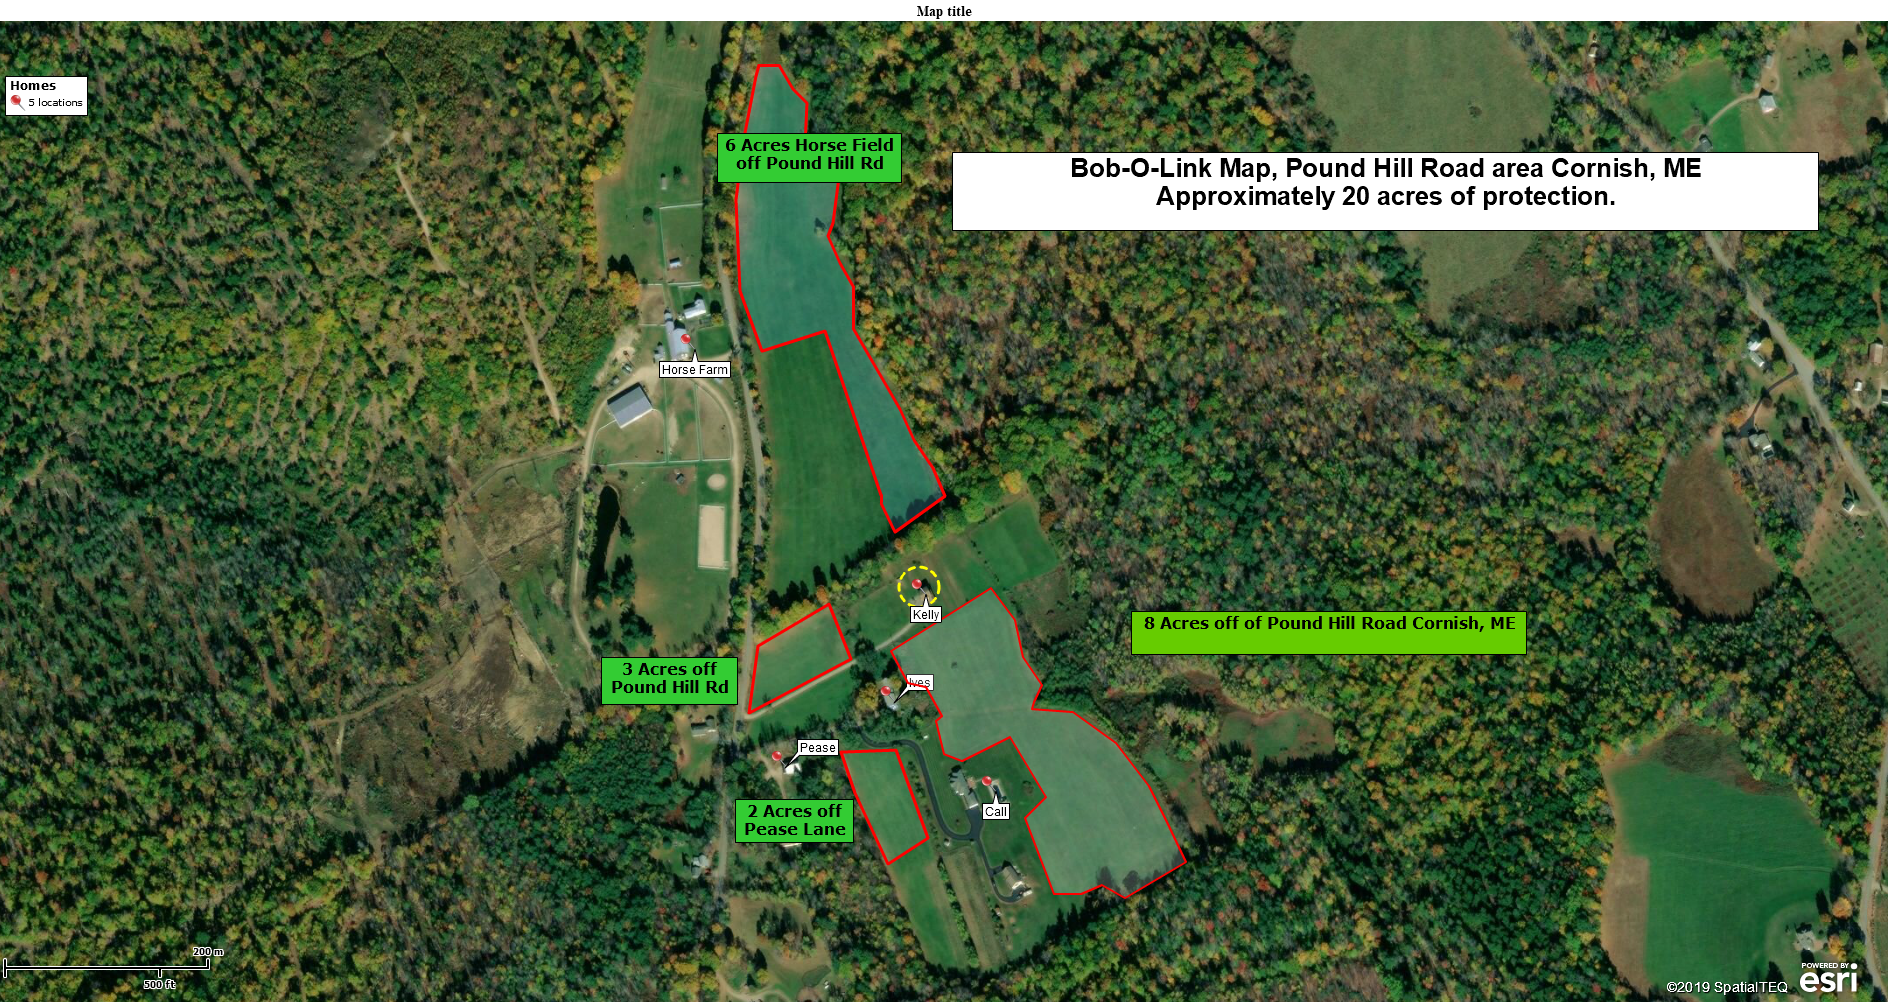
Bob-O-Link Nesting Areas Around Our House in Maine

Our best feature by far is all our Map Business Online customers.  We greatly appreciate the fact that you chose Map Business Online to be your business mapping tool.

Have a wonderful holiday season.

Are you using the Map Business Online Desktop App for MAC or PC? It’s hipper than Instagram and it comes with your subscription. Do away with Adobe Flash Player!

Value-Added Resellers – Offer the tool to your customers as a reseller. Make money on training and consulting. Contact us with further interest in reselling Map Business Online.

Win a $20 Gift Card! Refer a business associate to Map Business Online in exchange for a $20 Amazon Gift Card!

America’s best geo mapping software.


Posted in Business Mapping Software blog post, Sales and marketing | Tagged , , , | Leave a comment

How Do I Generate Demographic Data for Concentric Circle Maps?

This week I discovered the below outlined, interesting Map Business Online Pro Market Analysis solution for creating concentric circles with demographic data.

Businesses sometimes need to describe business processes using concentric circle maps. Concentric circles are circles with varying radii generated from one central location point. Each concentric circle represents an area on the map; in this analysis, that area has a corresponding selection of demographic data.

Business mapping users create concentric circle maps for multiple applications:

  • Concentric circles are often used to represent delivery areas. The circle or radius search areas are often derived from driving times and distances from a central location and are organized into rings. Some concentric circles maps define the costs/prices to ship from an origin point to destination points within each ringed area.
  • Demographic data associated with concentric circles can describe the potential market that exists in each band. Often those market circles are determined by driving times and driving distances.
  • Concentric circles could be used to demographically define sections of urban areas or cities based on their distance from a city centroid point.
  • Concentric circle maps can also be helpful as visual bands that define distance ranges from a central point. A map viewer may be able to quickly estimate distances when looking at concentric circle maps based on standard spaces between bands.

Create Concentric Circles with Multiple Categories of Demographic Data

Only Map Business Online Pro can quickly achieve this slightly complex map operation through the Market Analysis option, Summarize Demographics. 

Problem: A business needs to display four or five concentric circles around a central point on a map and assign each ring area three (possibly more) demographic data category totals.

Solution: Using Map Business Online Pro, Create and import a spreadsheet. Assign the Demographic Categories. Generate the circles.

  1. Using Excel or standard spreadsheet software, set up an address spreadsheet with these columns.

Address | City | State | ZIP Code | Radius | Demographic Category

  1. For however many concentric layers you require, create a spreadsheet with the identical address for each center point, varying only the radii required for each concentric ring. List as many addresses as you require circles.
Address
City
State
ZIP Code
Radius
100 School St
Boston
MA
02134
5
100 School St
Boston
MA
02134
10
100 School St
Boston
MA
02134
25


  1. Usually, you would import your spreadsheet using the Plot Data button. But for this exercise, go to Market Analysis and select the Summarize Demographics option at the bottom of the options listed.
    1. Use the Plot Data function at the top of the dialogue. Plot your Data.
    2. With your data plotted, go back to the dialogue and put your choices in the functions listed:
      1. Choose the three demographic categories you require
      2. At Radius selection, Choose the Radius in the Data Column option
      3. Select Draw a Circle and choose a color and thickness
      4. Click Next and Done.
  1. The Data Window will now pop up and display the datasheet view of the centric circles with demographic data information applied. Export as always using the far-right button on the Data Window toolbar.

Some of you might be thinking, too bad it only adds three categories. For you, we have a special treat. Please return to the Market Analysis function Summarize Data, choose three more categories and rerun it. Viola! Now you have six demographic categories associated with your concentric circle map!

Map Business Online Market Analysis is available in both Map Business Online Standard and Map Business Online Pro. The Pro features include driving time and distance analysis across multiple center points. But keep in mind, Standard subscriptions have access to Market Analysis tools for only straight-line distance analysis.

_______________________________________________

Discover why over 25,000 business users log into www.MapBusinessOnline.com for their business mapping software and advanced sales territory mapping solution. The best replacement for Microsoft MapPoint happens to be the most affordable.

To access MapBusinessOnline, please register and download the Map App from the website – https://www.mapbusinessonline.com/App-Download.aspx.

After installing the Map App, the MapBusinessOnline launch button will be in the Windows Start Menu or Mac Application folder. Find the MapBusinessOnline folder in the Start Menu scrollbar. Click the folder’s dropdown arrow and choose the MapBusinessOnline option.

The Map App includes the Map Viewer app for free non-subscriber map sharing.

Please read customer reviews or review us at Capterra or g2crowd.

Contact: Geoffrey Ives at geoffives@spatialteq.com or Jason Henderson at jhenderson@spatialteq.com.

Posted in Business Mapping Software blog post, How to instruction, Sales and marketing | Tagged , , , | Leave a comment

The Power of Market Analysis in Map Business Online Pro

One possible market analysis scenario, requiring both Map Business Online Pro and Business Listings, is a retail manager planning for a new set of convenience stores along the I-95 corridor in Eastern Virginia. Such analysis using Map Business Online would tap into Business Listings search as well as the drive-time-based Market Analysis tools now available in Map Business Online Pro.

Let’s begin with no Background Map selected in Map Business Online. Instead, we’ll use a Census Tract background colored purple to highlight store locations. By selecting the highway layer from the Add Map Layers button your map will reflect the major highways, important to this analysis view.  Read more about Background Map options.

A user could turn highway layers off and display the Imagery Background layer which may display aspects of your proposed new convenience store locations that could be hidden by the roads layer. Check the highway layer on and off and Zoom way in to verify your proposed site locations. Are there buildings, exits, or mountains nearby? But for the final map view, a color shaded map layer background may be more effective.

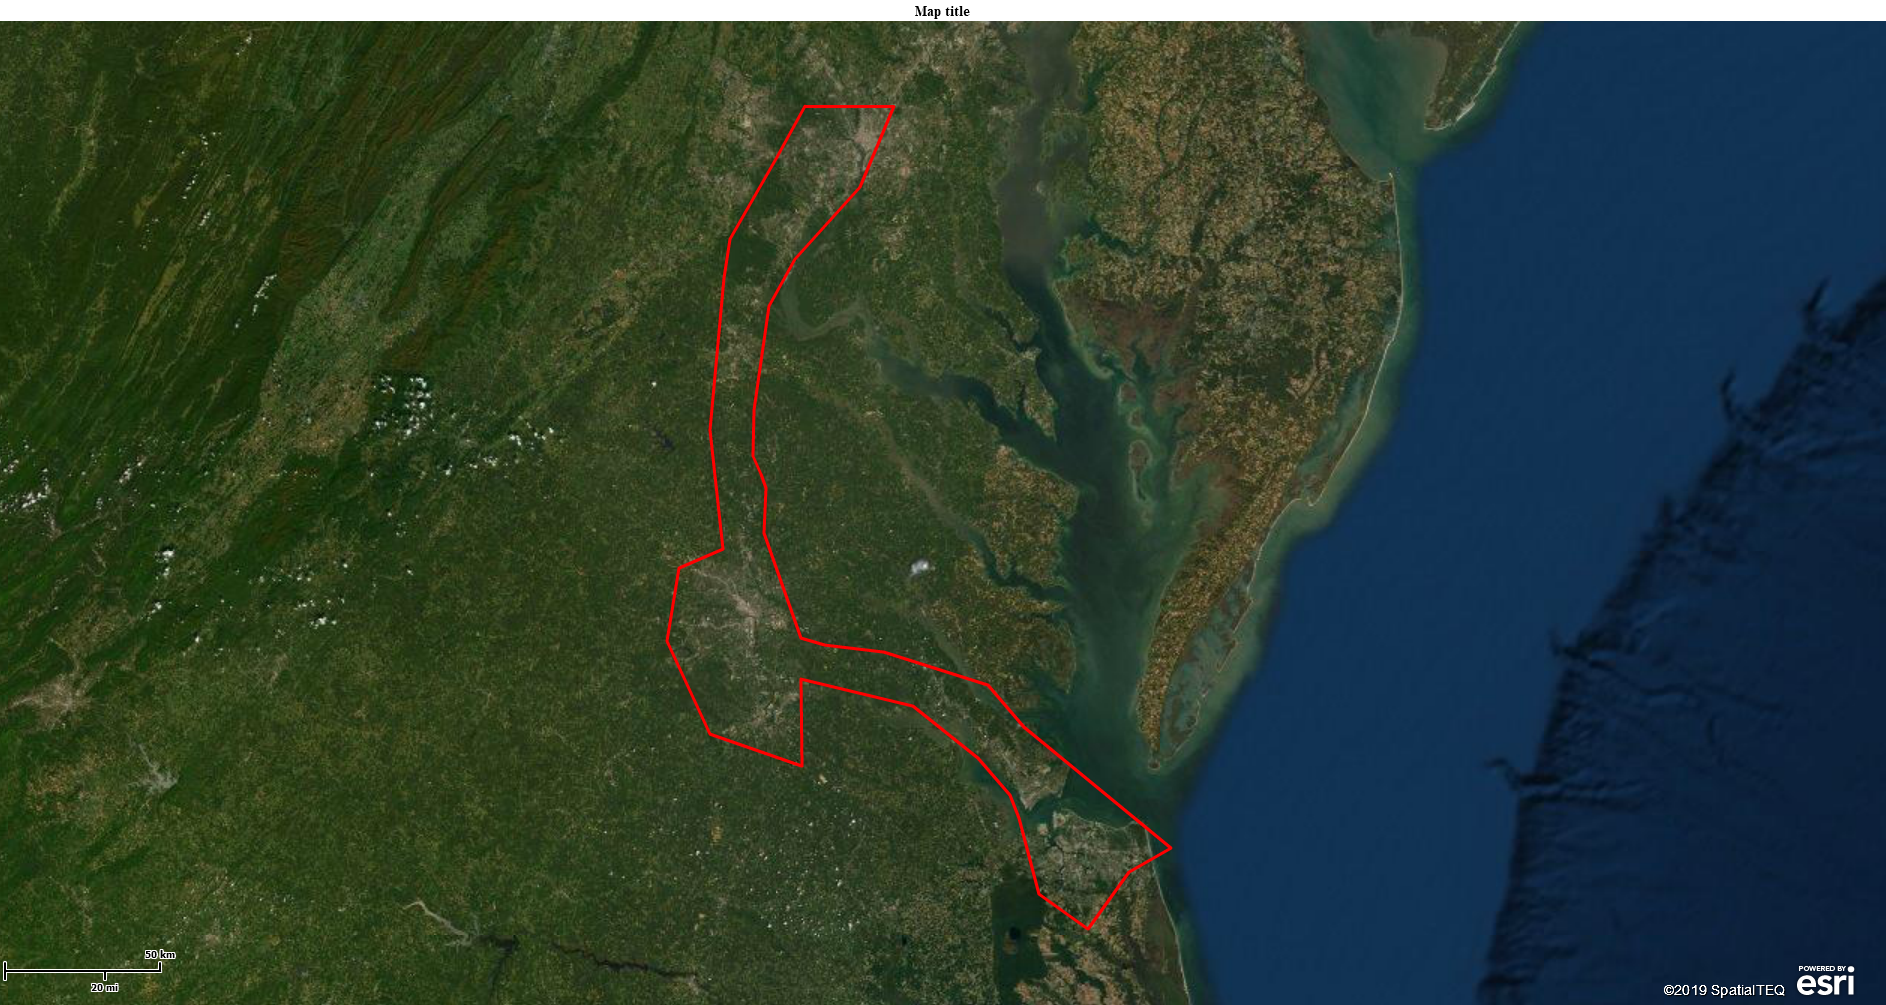
Satellite View DC/VA I-95 Corridor


Over that pink map background, with the highway layer turned on, is a drawn polygon, created to represent a rough buffer zone around the I-95 corridor from Washington, D.C. to Virginia Beach, VA.

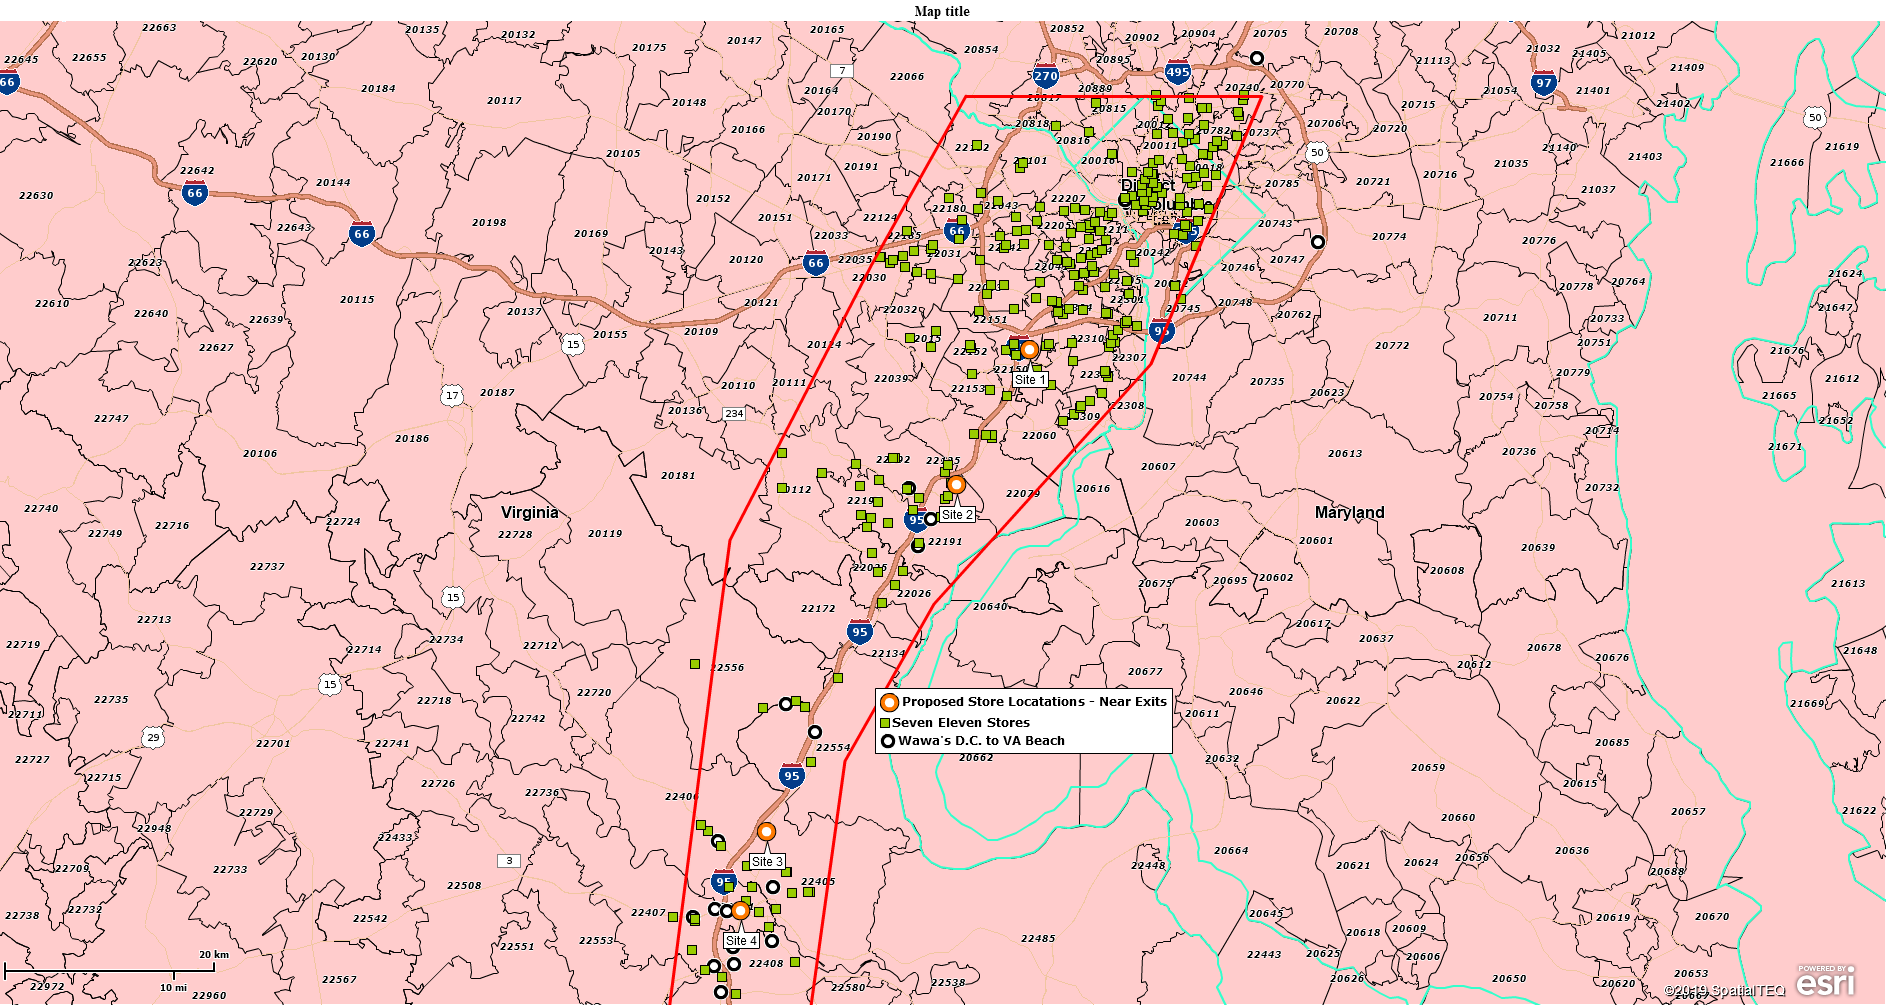
No Background Map – Colored State Layer

Remember, our map audience for this map project are the developers of a new set of convenience stores. They are interested in opening a series of convenience stores near I-95 exits in Virginia. As part of that market analysis, we need to understand more about the existing competition. And there is plenty of that, including multiple 7-Eleven and WaWa stores located in close proximity to the highway. Market analysis must answer the question, “Does this even make sense?”

Business Listings

All Map Business Online subscriptions now include access to business listings. So, a next step would likely be to select the Polygon buffering the I-95 corridor and choose the Yellow Pages icon located on the Polygon’s mini-toolbar for a Business Listings search for competitor locations.

Doing so will reveal a little more than one-thousand 7-Eleven stores and about seventy WaWa stores. Keep in mind, that’s 1,000 7-Eleven stores in the Virginia I-95 corridor alone. Yikes!

With the map now populated with the major competing stores, we can assess how many competing stores exist within a specified drive time of all our proposed store sites. With Map Business Online Pro a user could assess both straight line, driving time and driving distance, but with so many stores in the area, I felt driving time was the most appropriate analysis.

The proposed job sites are located close to key exits along the I-95 corridor. They are displayed on the Map as large orange circles with white doughnut holes. We’re interested in locating those stores only where there are less than three 7-Eleven stores within a five-minute driving time. Driving time is important. I know for me, when I must exit the turnpike to get gas, coffee or food, I want to minimize the time I lose from my trip. I’m not going to get off and drive for more than five-minutes.

Map Business Online Pro – Market Analysis

Using Map Business Online Pro, we choose the option in Market Analysis called Find the Nearest. Following the options listed in the dialogue box, we choose the following:

  • Measure – Drive time
  • Customer Locations – 7-Eleven store dataset
  • Store Locations – Proposed convenience store locations
  • Time – 5-minutes from 7-Eleven to the proposed site location

The results of this analysis, displayed in the Data Window, will add Site Location data to the 7-Eleven dataset based on a Drive time of under five-minutes. Negative numbers indicate 7-Elevens that fall outside the range of the Find the Nearest parameters. Filter the Drive Time column to show only results that are greater than zero (> 0). Now, still in the Data Window arrange all the Proposed Sites in order and view the sites with the fewest competitors. These include Proposed Site 4, 5, 6, 7 8, 9, and 14.

Multiple Drive Time Territories

Another approach to investigating the areas surrounding a list of multiple center points, or proposed sites, is to build a set of territories around those locations and then pull data into the resulting analysis using the More Data button. Read more about More Data.

The combined elements of assessing multiple center points based on drive time areas require Map Business Online Pro. Use the first option in Market Analysis. To keep the territory map layers smaller, I would turn on the Census Tract layer which generally has tinier jurisdictions than ZIP codes.  Census Tracts are available in the Add Map Layers button.

Choose Search and Segment Data from Multiple Centers in Market Analysis.

  • Select or Plot Dataset – Proposed Site Locations
  • Use – Drive time
  • Radius – 5 minutes
  • Checkbox – To draw a drive time polygon

Click Next [note the routing credits used for this process] click Next again. In this final dialogue page, to create territories or marketing lists it is important that the user chooses to Segment the data by checking the Segment Checkbox underneath the Dialogue.

  • If you choose to segment a point layer to query, marketing lists are generated.
  • In our case, select a Map Layer option, Census Tracts, to generate territories

Process the analysis by clicking Next.  With a territory layer now created, use the More Data button in the territory analysis view to remove superfluous data layers and add data layers you find valuable. Results can be export and saved within Map Business Online for further analysis, or for data enrichment, another feature of Market Analysis.

Use Map Business Online Pro as a market analysis toolkit. Try different approaches. Every company has a slight twist to market analysis that is all their own.

Many of the features and applications associated with Map Business Online are interelated. Market Analysis helps with and benefits from sales territory management. Demographic analysis is one component of market analysis and a key element of sale territory management and competitor analysis. Business listings can be critical to a sales or marketing campaign while also providing key factors in strategic planning.

I guess the message is, maps are really helpful in business analysis and planning.

Are you using the Map Business Online Desktop App for MAC or PC? It’s hipper than Instagram and it comes with your subscription. Escape Web-Browser Tyranny!

Value-Added Resellers – Offer the tool to your customers as a reseller. Make money on training and consulting. Contact us with further interest in reselling Map Business Online.

Win a $20 Gift Card! Refer a business associate to Map Business Online in exchange for a $20 Amazon Gift Card!

America’s best geo mapping software.

Find out why over 25,000 business users log into www.MapBusinessOnline.com for their business mapping software and advanced sales territory mapping solution. The best replacement for Microsoft MapPoint happens to be the most affordable.

Discover Map Business Online – tools for making business maps


Posted in Business Mapping Software blog post, Sales and marketing | Tagged , , | Leave a comment

How to Work With Cities & Towns in Map Business Online

This seems a simple question, “How do I show cities on my business map?” And it is a simple question. But still, there are multiple options available to Map Business Online users when it comes to showing cities on their maps. It’s worth exploring those options in a blog.

A business mapping software is intended to make a business point. Sometimes the placement of cities is important to that business map point or purpose. Map Business Online has at least five ways for users to display cities on the map.

Cities are used in professional mapping software for a variety of applications:

  • Marketing analysis  – Cities and urban areas often represent the primary marketing areas of interest for businesses.
  • Sales Territory Mapping – Cities might be used for the base map layer of territory construction or reference points for salesperson start of day positions.
  • Map Visualizations – Cities provide map orientation points and are often relevant anchor points for business descriptions.

Background Map Cities

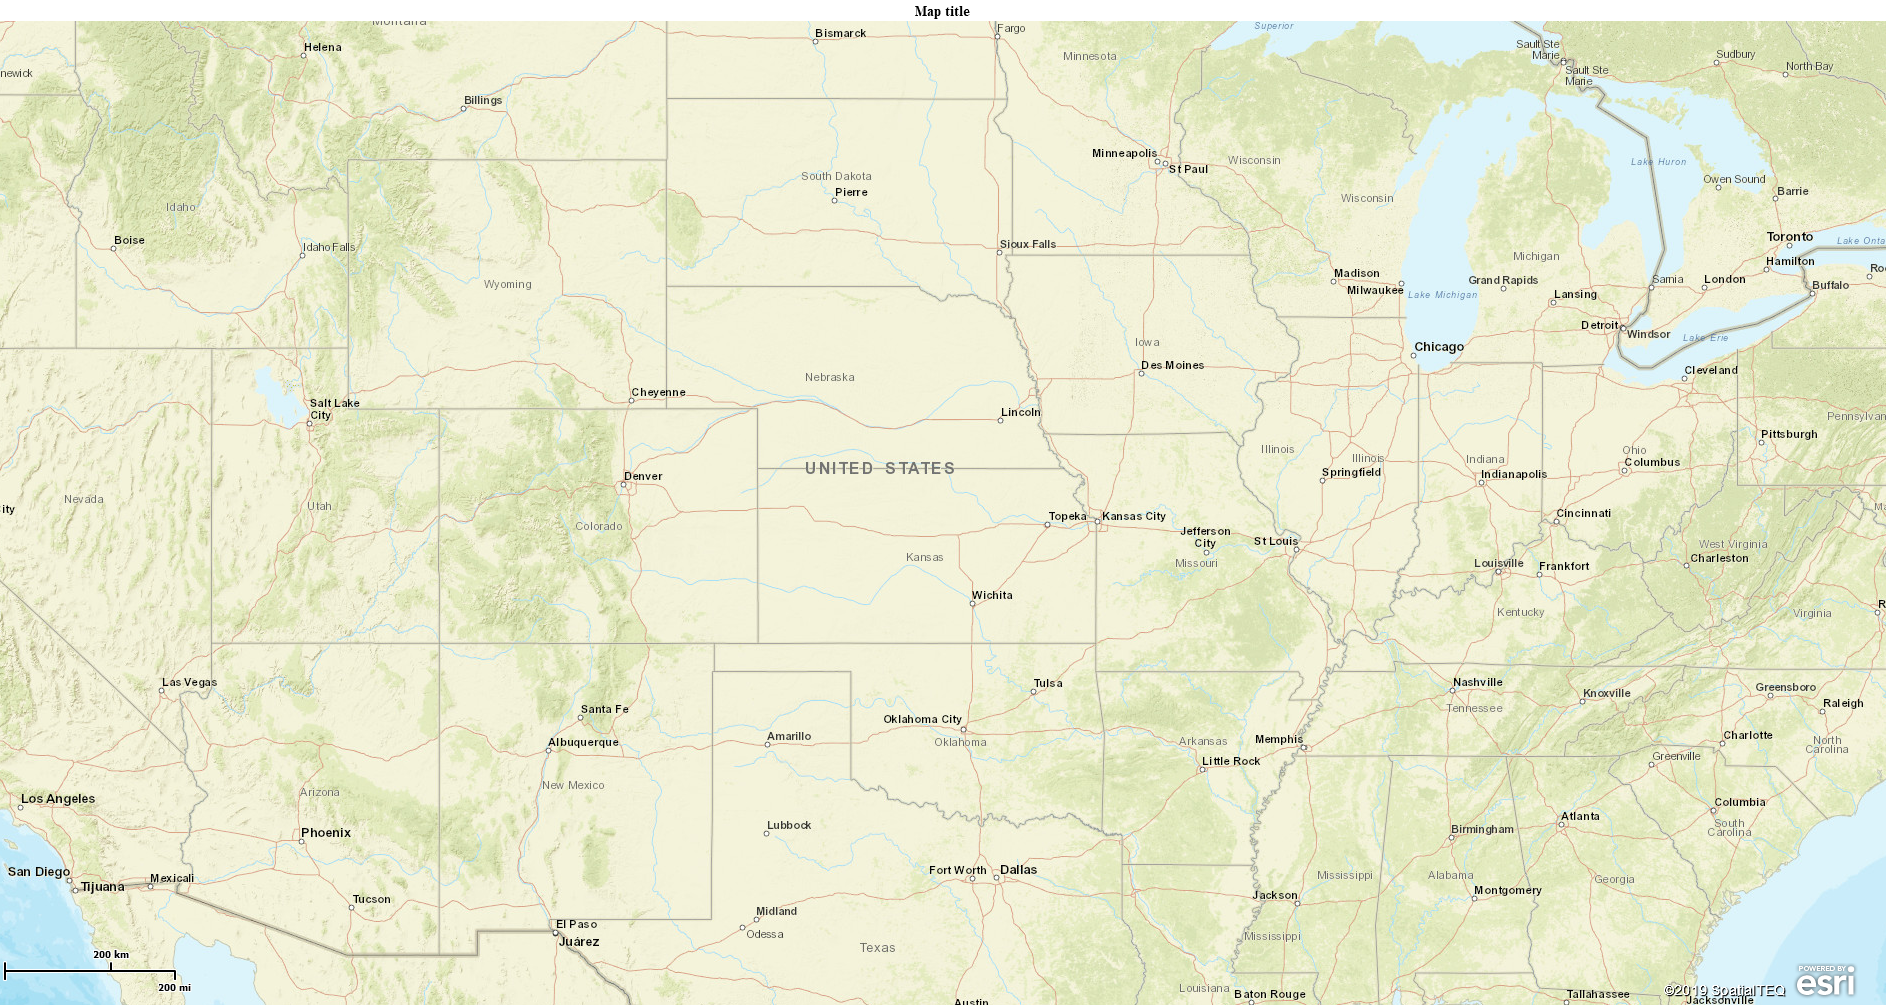
A basic business map often includes a map background, optional in Map Business Online. The lowest checkbox in Map and Data controls the background map options. The options noted as Streets and National Geographic include cities. These city details or points on the background map display larger cities only when viewed at a broad view or a nationwide level.  Smaller cities and towns show up only when zoomed in.

This web mapping characteristic, to display map objects like cities in a graduated style related to Zoom levels, is common across all business maps. It controls the object placement on the map so that only limited and relevant map objects, ZIP codes, counties and cities show at the most expanded map view. This generalization controls map clutter and eliminates overlapping map objects on the map. Think about it? Should small towns be displayed on the map at a nationwide view? No. That would create a map with impossible to read text and would leave very little discernable relevant detail.

So, background maps help display more cities as the map view is zoomed in. To maximize the visual impact of cities in the map view, try adjusting the zoom level of your map view to optimize the background map cities displayed. For many business maps, this background map option works well.

Keep in mind, background maps are a tapestry of map visuals, not points or overlaid boundaries. These cities and other map objects cannot be queried.

Streets Map Background with Selected Cities Displayed

City Map Layer

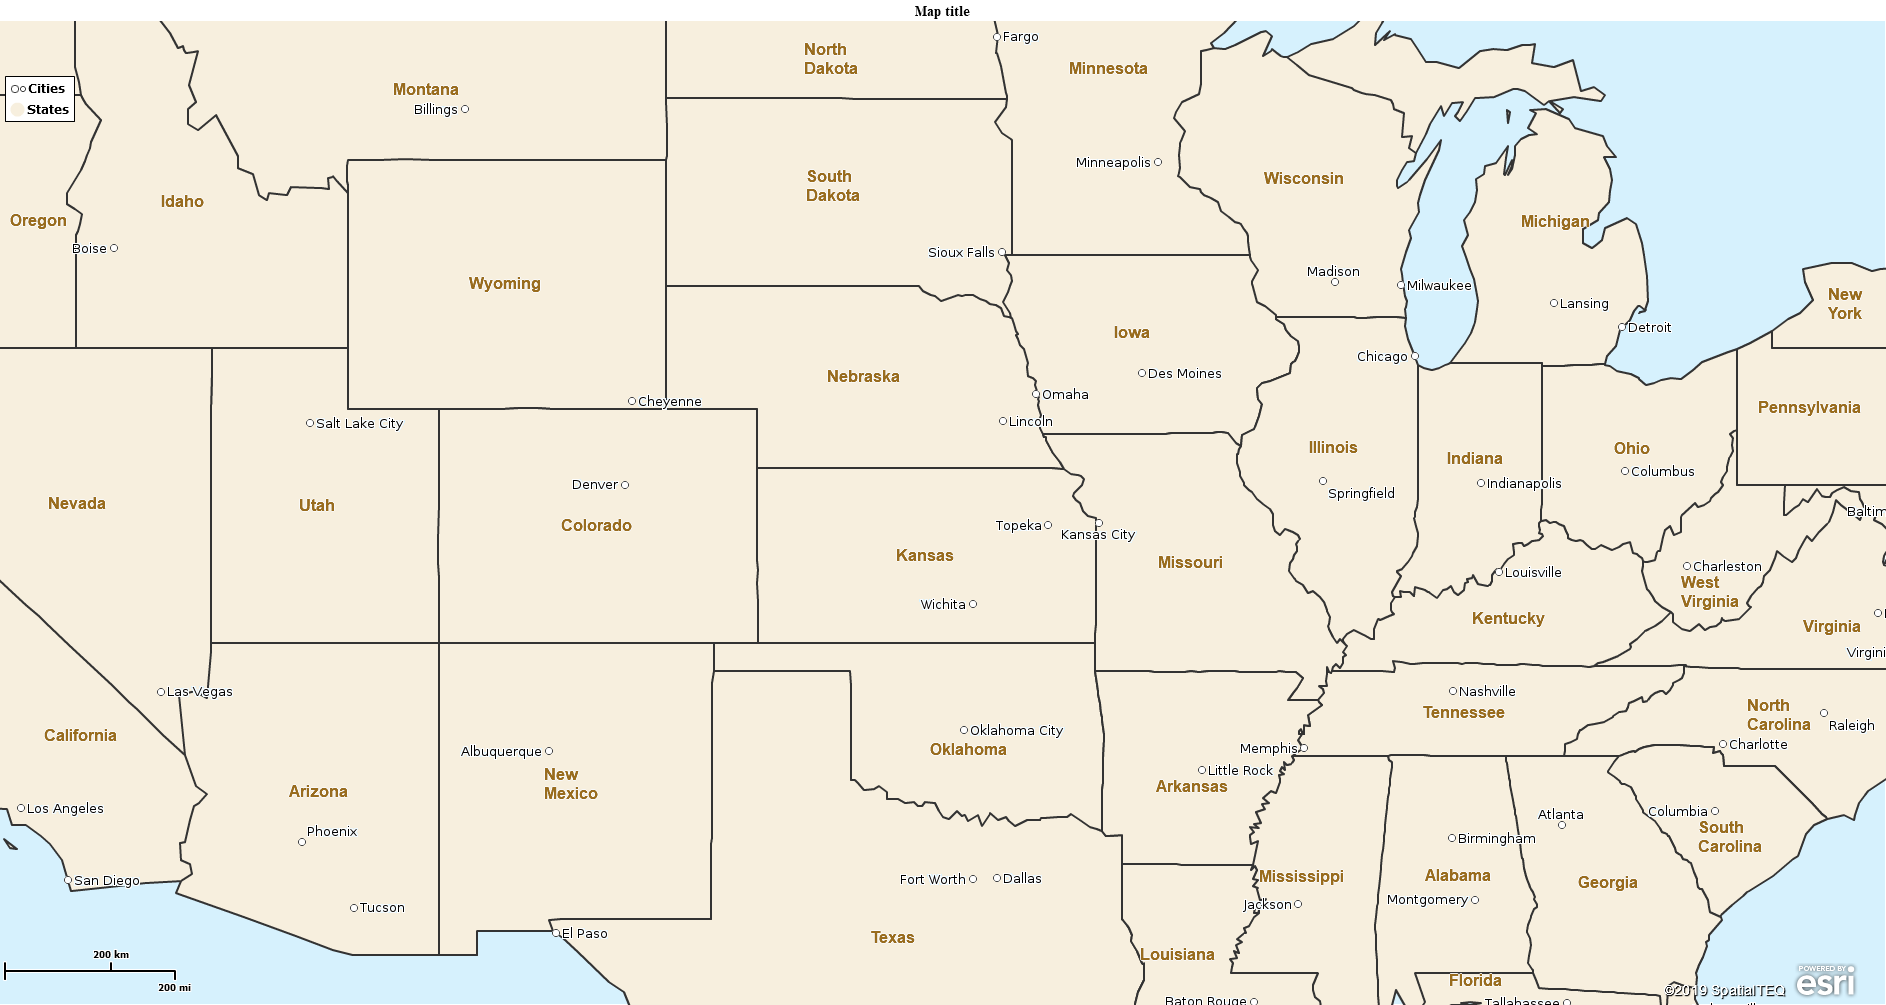
Map Business Online also provides additional map layers for more detail options, including query-able city layers that are searchable. The first of these city/town layer options is the Cites Layer. This layer, along with other additional map layers, is added to your map project from the Add Map Layers button, a blue globe seven buttons in from the left on the master toolbar.

Adding the Cities Layer to the map adds city points with a city label to your map. Just like the background map, larger, more populated cities display at the Zoomed-out levels, and more cities and smaller towns pop into view as the user zooms in.

The City Layer does not allow editing of these city points. The font and color are not editable. This layer is sometimes helpful for general city reference, where boundaries and color shading by city is not required.

Cities Layer Against a State Layer Background

City Limits Layer

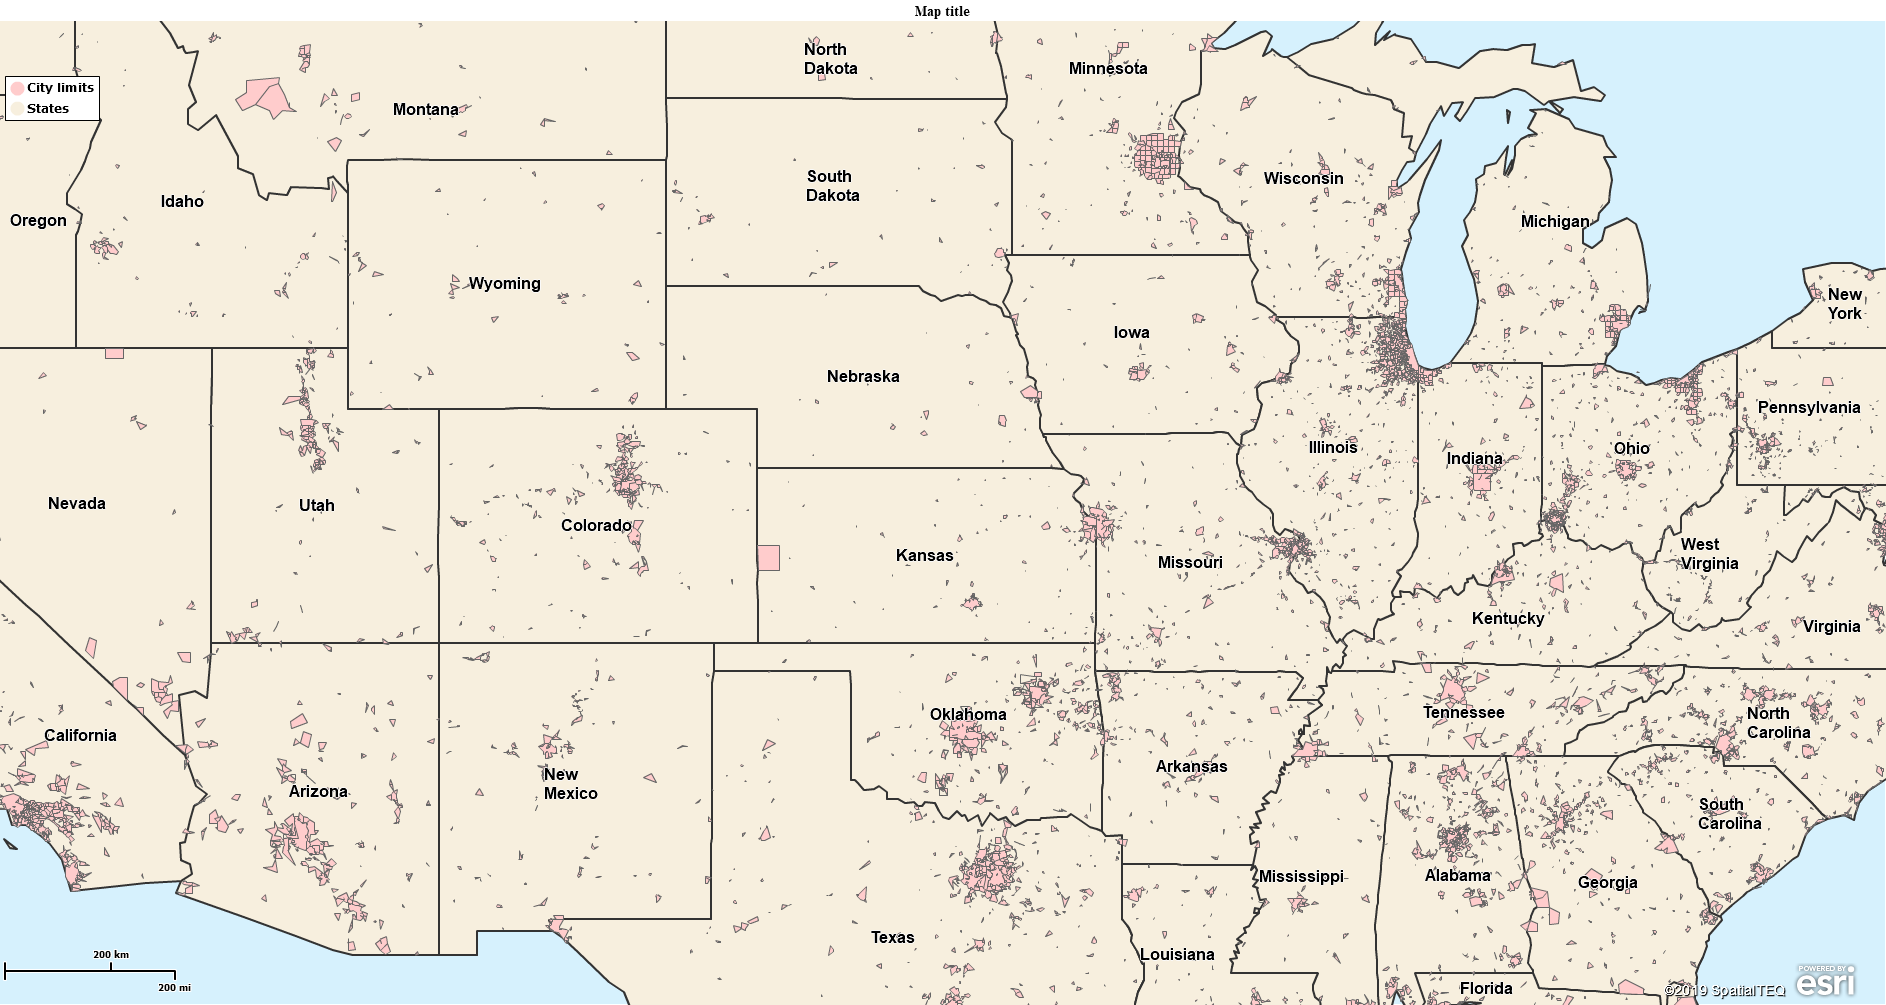
The second City layer available from the Additional Layer button is the City Limits Layer. This layer adds city boundary limits in addition to city labels to a user’s map project. The city limits layer is color shade-able just like the ZIP code or county layers.

The city limits layer has access to the demographic data library, to calculated data, and to imported user data layers for color shading, and label amendments. The city limits layer follows zoom level controls in a similar way to ZIP codes. At a nationwide view, smaller cities may not appear or may appear almost as points. Larger cities and towns will display boundaries and those boundaries will expand in scope, and more towns will appear, as the user zooms in.

City Limits data is great for city-based analysis. It is often used to build marketing models around urban or metropolitan areas. Keep in mind, the city limits layer is based on Census city and town limit boundaries. Places with tiny populations do not display boundary limits.

City Limits Layer Against State Layer Background

Public Data – Cities and Town

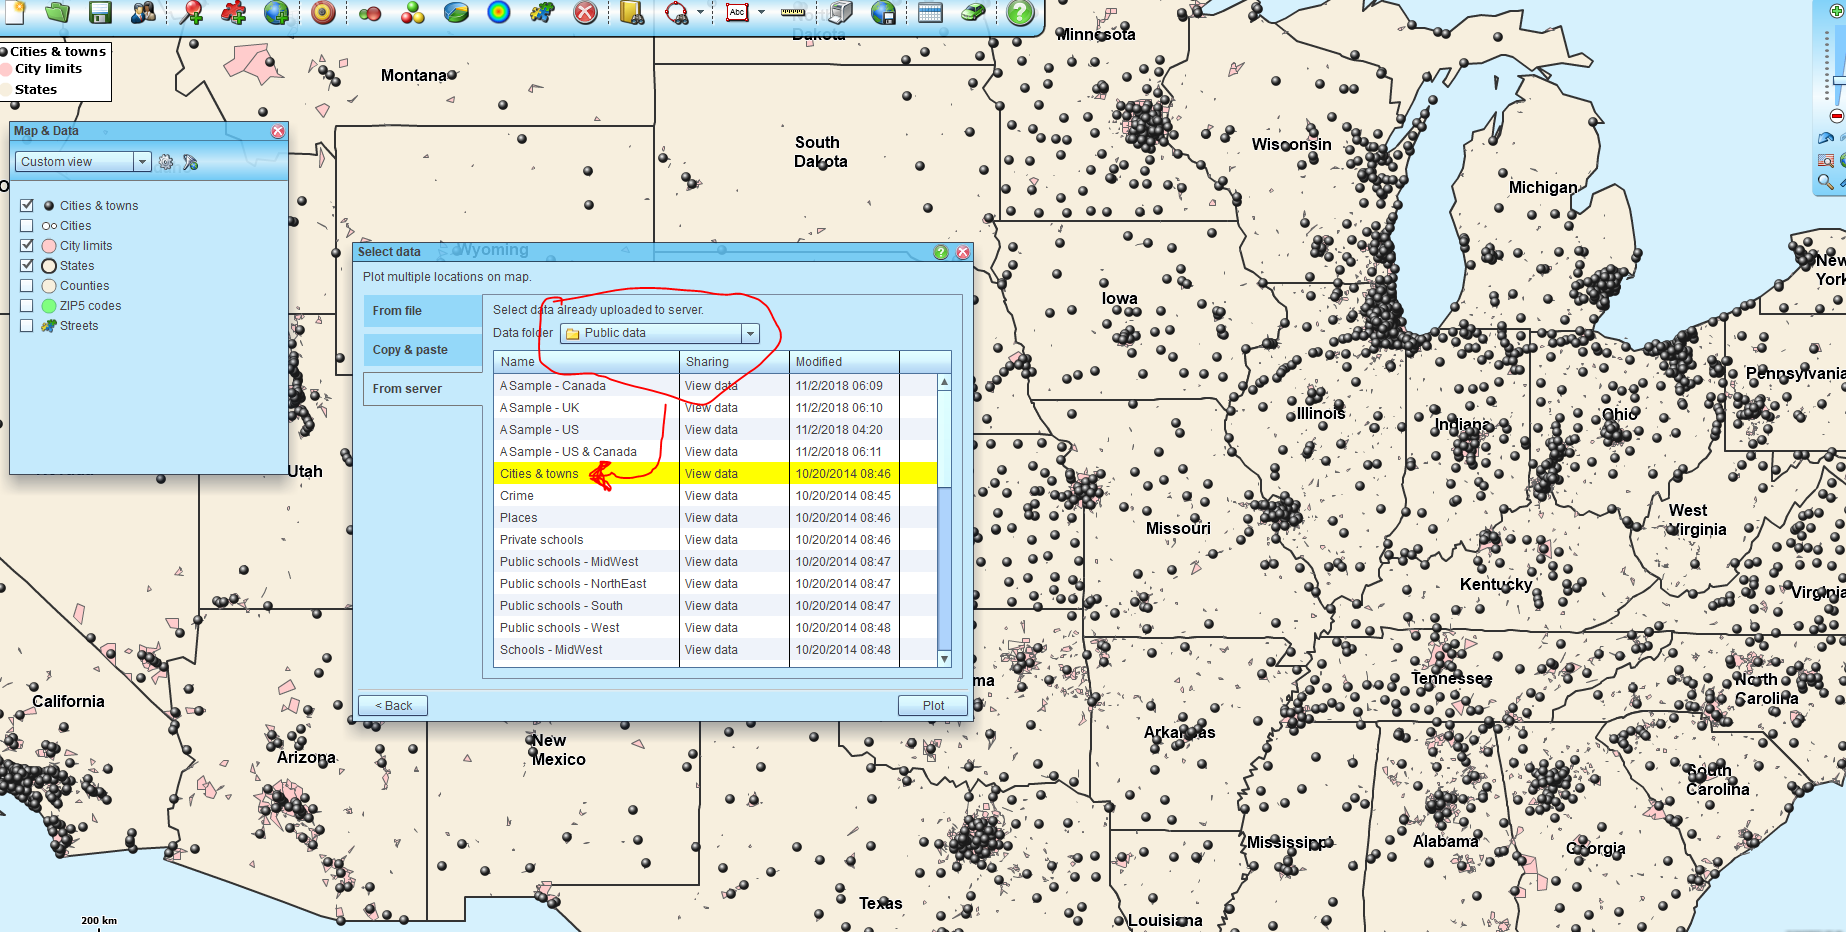
Map Business Online includes a set of public data sets that are available and supplemental data layers available for your map work. Access these layers by clicking the Plot Data button, then select the From Server option and choose Public Data.

The Public Data, Cities and Towns layer will plot 6,715 points on your map. Again, smaller cities or towns will come into view only as the user or viewers zoom into the map. The points imported as Cities and Town scan be symbolized and color-coded.

Import Your Cities

Occasionally, none of the Map Business Online options will display the cities you require at the zoom level you are comfortable with for your map audience. In this case, you can import cities as a spreadsheet for accurate placement on the map. This data will mirror the same import process and visualization options on the map as any other imported location point data set. Users will be importing city points.

Pubic Data Cities & Towns Point Data


Consider the MSA Layer Too

Also available in the Map Business Online add data layer options is the MSA or Marketing Statistical Area layer from the Census Bureau.  This map layer acts like the City Limits layer or the ZIP code layer. But it’s significance is that it combines regional urban areas into city-level market areas.  These are broader areas encompassing multiple cities.

Tweaking Your Cities

With your map project nearing completion one of the layers that is often used is city-data. If cities are critical to your map’s purpose, we recommend trying all the included city-data options available and described above. Observe how each city-layer helps your map communicate or detracts from the map’s ability to share information.

Experiment with different zoom levels and background map options. And remember, placing a point in incrementally for a particular city or town you want to highlight in a certain map view, is OK to do. Make your map sing by trying all the options available in your Map Business Online bag of tricks.

__________________________________________________

Are you using the Map Business Online Desktop App for MAC or PC? It’s hipper than Instagram and it comes with your subscription. Escape Web-Browser Tyranny!

Value-Added Resellers – Offer the tool to your customers as a reseller. Make money on training and consulting. Contact us with further interest in reselling Map Business Online.

Win a $20 Gift Card! Refer a business associate to Map Business Online in exchange for a $20 Amazon Gift Card!

America’s best geo mapping software.

Find out why over 25,000 business users log into www.MapBusinessOnline.com for their business mapping software and advanced sales territory mapping solution. The best replacement for Microsoft MapPoint happens to be the most affordable.

Discover Map Business Online – tools for making business maps

Posted in How to instruction, Sales and marketing | Tagged , , , | Leave a comment

Map Business Online Pro – Webinar Recording & Thoughts

Last week I presented a webinar focusing on Map Business Online Pro for users who were interested in our recently released Market Analysis tool. The above video is a recording of the webinar. Please review the webinar covering our latest Business Mapping Software release.

Webinar presenting is a bit like experiencing an ever-shifting roller coaster ride. You rely on the physical structure to hold and the technology to work, and you never know where you’ll end up. It could be you’ll end up in a heap on the ground – bruised, bleeding or worse.

People who present webinars know exactly what I mean.

Webinar presenting combines the abject terror of public speaking, with the unknowing anxiety of using brand new software when you are eighty-five years old and have a measure of dementia. And presenting adds a dash of strapping in for a ride on a Saturn Five moon rocket. You just never know how far the technology will take you, this time…

Sometimes I wake up at night from a nightmare where I’m presenting to fifty people and somebody just texted me that they can’t see my screen. And my laptop just turned into a vintage Etch-a-sketch.

Webinar Nightmares

At any rate, despite my anxiety, this webinar went pretty well. During the weeks leading up to the webinar, I spent a lot of time with Map Business Online Pro, exploring the tool and trying various application examples. Here are some tips I learned:

Keep Your Driving Time Analysis Local – Driving time analysis with specific time or day and week options turned on is a machine intense analysis. It takes traffic into consideration on top of the road networks. And keep in mind, that road network analysis is looking at all possible roads from a set of multiple points to, potentially, another set of multiple points. That is going to take some time, and if you run it across the whole country, well, you might want to take a nap. We’ll be adding some cautionary software stops to help users think through their queries. We believe that most of our users’ time-based analysis should be focused locally anyway.  If you require multiple point drive times for nationwide location datasets – talk to us.

Importing One Spreadsheet with Origin and Destination Data – Make sure your header data specifically describes the address components. Something like this:

Origin Address

Origin City Origin State Origin ZIP Destination Address Destination City Destination State

Destination ZIP

10 We St Crazy IL 60609 10 Salem Rd Pendleton MA 01542

Map Business Online’s geocoding process needs to see those guiding address descriptors or headers to plot dual addresses effectively. You’ll be able to manually override the addressing as usual. All I’m saying is, do yourself a favor and be organized for origin and destination analysis. It is a complex analysis. Don’t take it lightly.

Experiment a Little

Make sure you try a few different approaches to get the results you require. We describe center locations, typically fixed, as “Stores.” The searched data is often referred to as “Customers.” Make sure your Stores and Customers have a similar relationship. Sometimes it may help to run a small test to see how the results turn out.

When you experiment, remember you can undo the calculated data your Market Analysis queries have added to datasets by choosing to edit the data in Map and Data, pick Customize Dataset and edit the Calculated drop down option.

Multiple Passes May Get You There

Think of Map Business Online Pro Market Analysis as a toolkit, a jackknife with many small tools that can be applied to solve your problem. For instance, you may want to Search and Segment some location based-data to derive a segmented marketing list for outbound calling for a retail store.

You will notice the seven Market Analysis button tools in Pro broken into these sections:

Search

  • Search & Segment Data from Multiple Centers

Distance and Time

  • Batch Calculate Distance and Time
  • Find the Nearest Locations

Summarize or Enrich

  • Aggregate Customer Data
  • Summarize Demographic Data
  • Enrich a Dataset

Think about how your requirements might fit into these sections. Perhaps the very same data would then undergo a Find the Nearest analysis to help prioritize a direct mail marketing campaign to the potential buys within a ten-minute drive time of the retail brick and mortar store.

And even later, that same list could be appended to show sales data for the sale period.

Multiple passes to generate the overall analysis maybe your best solution.  Let us know your thoughts about Map Business Online Pro.

__________________________________________________

Are you using the Map Business Online Desktop App for MAC or PC? It’s hipper than Instagram and it comes with your subscription. Escape Web-Browser Tyranny!

Value-Added Resellers – Offer the tool to your customers as a reseller. Make money on training and consulting. Contact us with further interest in reselling Map Business Online.

Win a $20 Gift Card! Refer a business associate to Map Business Online in exchange for a $20 Amazon Gift Card!

America’s best geo mapping software.

Find out why over 25,000 business users log into www.MapBusinessOnline.com for their business mapping software and advanced sales territory mapping solution. The best replacement for Microsoft MapPoint happens to be the most affordable.

Discover Map Business Online – tools for making business maps

Posted in Business Mapping Software blog post, Sales and marketing | Tagged , , | Leave a comment

How Do I Access Demographic Data within Map Business Online?

How or where do I access Demographic Data in Map Business Online, business mapping software?

For those of us who use Map Business Online a lot, we know where the data is housed. But for new users, I thought a blog focused on only where you find that demographic data might be helpful.

The demographic data in Map Business Online is a library of categories with data listed by description and quantity. Usually, the quantities represent the number of people or households, but the data may also be posted in dollar value by household. Those demographic data listings are for use in Map Analysis and export by Map Business Online subscribers.

Map Object Access – Master Toolbar

The fastest way to access Demographic Data is to place a map object (a circle, or polygon) on the map. These draw or search tools are in the middle of the master toolbar, just to the right of the Business Listing book icon. They are the only tools on the Toolbar with dropdown arrows.

In either, the Search or the Draw tools select a circle map object creation button (radius search or circle icon) and place it on the map. Notice the mini toolbar that appears and is associated with the new map object. Click the Summary button on the mini toolbar (a sideways M). The radius search dialogue will immediately offer the entire library of demographic data for your perusal. Scroll through all the demographic data – if you have time. You can pull up to ten listings into your Map Object analysis for use on the map or for export. Other access points, described below allow even more data downloads. The summary button is for fast and easy access; to generate a quick spreadsheet or win a bet.

Territory Analysis – Data Window

One of Map Business Online’s most powerful tools is the presentation of Demographic Data in the Data Window’s territory view. Create a territory or select a previously created territory for viewing in the Data Window. With your territory view established, cast your beady eyes down to the lower right-hand corner of the Data Window screen. Notice the More Data button. Click the More Data to launch a database management tool that accesses the Demographic Data library. Read more about More Data.

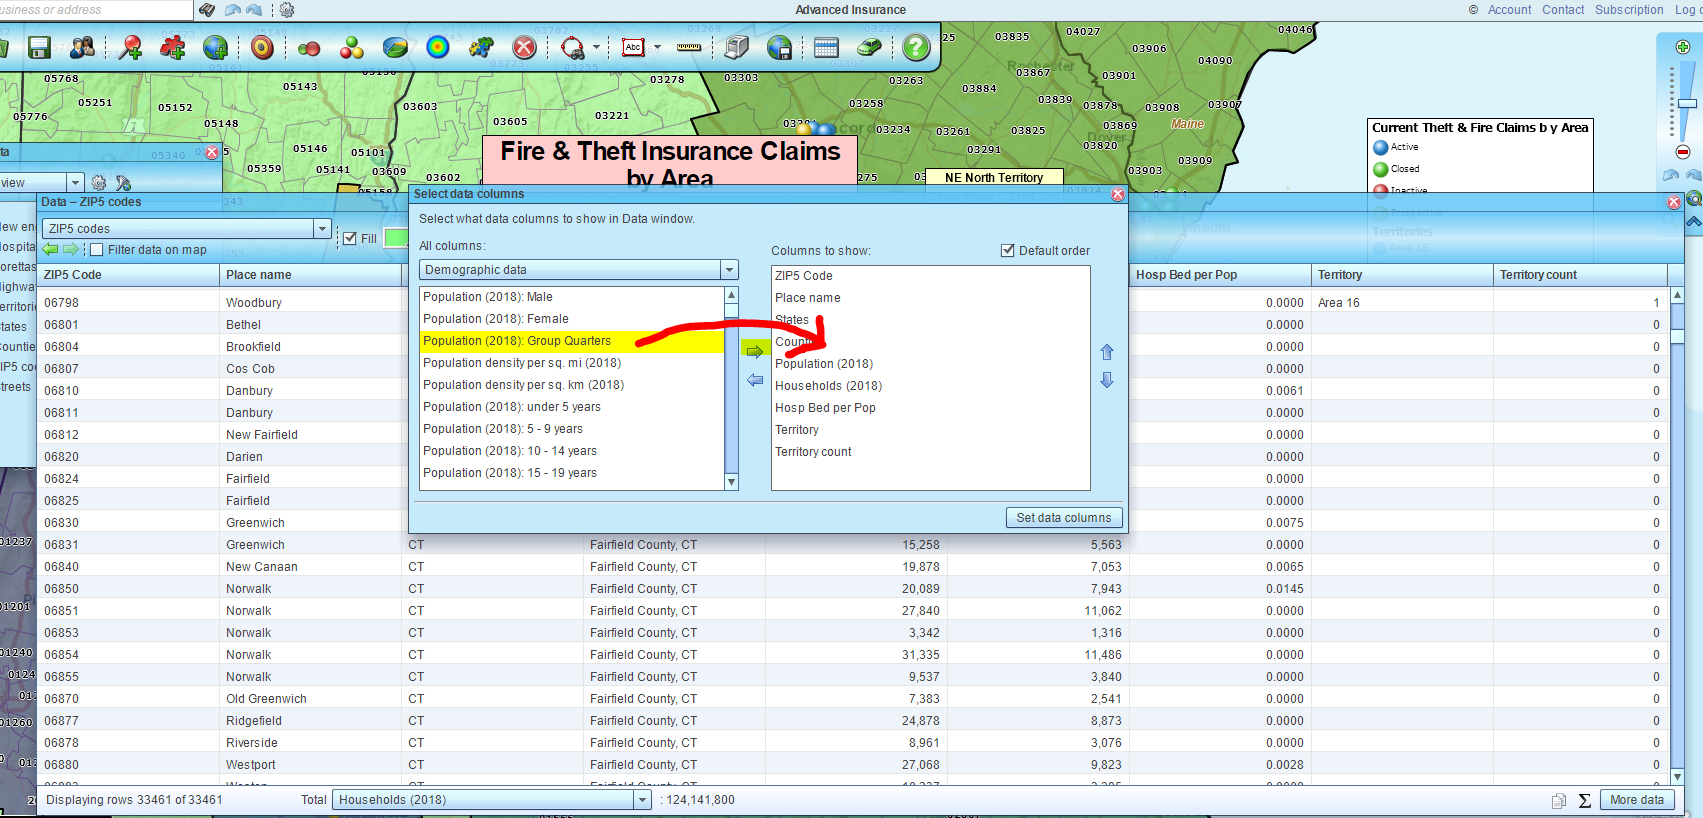
Once you have the More Data panel open, on the left side, select the dropdown to see the data options you have available. Notice the demographic data layers are listed here. You will find your imported data their too, as well as access to any calculated data layers you may have created. Pull down the Demographic Data category of your choice and move it to the right, into the Territory Analysis. It will now be included in all territories based on that map layer (ZIP codes) in that saved map project.

The More Data Database Management Panel

Filtering – Data Window

Also located in the Data Window view is the Filter option. Click the Funnel icon on the Data Window toolbar to access filtering. Map Layer views and territory views allow filtering by demographic category. Try various modifier options to filter based on the number of people in an area or the median income values. Results will limit the number of records in the Data Window view based on your filter. Export using that button on the far-right side of the Data Window toolbar. Read more about the Data Window.


Color Code Map – Master Toolbar and Map & Data

Back on the Master Toolbar, twelve buttons in from the left you will find the Color Code Map button. This button allows the user to color shade map layers based on imported data or demographic data. Click the button, choose your map layer and in the dropdown provided select Demographic Data. To read more about color shading options read this blog.

Calculate a Data Column – Map & Data

Map and Data, the light blue box that hovers over your map allows duplicated access to Demographic Data. Here in the map layers, when you hover over the layer and click the edit gear, are alternative ways to color shade a map layer. But you will also notice a button called: Calculated Data Columns.

Click into Manage Calculated Data Columns and choose to Add a Data Column. Once again, you will immediately notice Demographic Data listed as an option for creating a column. Select a few categories and move them to the right. Notice you have options to sum, subtract, multiply and divide.

Calculate Data columns is where I go to sum demographic categories and get critical totals such as:

  • Elderly American population by combining the elder age brackets
  • House-Hold Incomes higher than $79,000 for an area

Label Access – Map & Data

Finally, a Map Business Online user can also access demographic data for use in Labeling. Chose a map layer in Map & Data, click the Edit Gear and select the Label Tab vertically listed along the right side of the dialogue. Now click Format Labels. Read more about labeling.

Auto Labels and Custom Labels, both provide access to Demographic Data. Each label option offers five flexible label fields that will display underneath ZIP code, County, State or Territory labels. By selecting a numeric demographic or imported data option to display in any of these five label fields, the data displayed will be a summation of the data for the designated map layer area.

Wrap Up

Well, those are the places in Map Business Online where Demographic Data is accessed. Don’t forget to use your demographic data wisely. Balance your map view with critical data elements that support your map’s purpose. Don’t overwhelm your map audience with too much content.

Are you using the Map Business Online Desktop App for MAC or PC? It’s hipper than Instagram and it comes with your subscription. Escape Web-Browser Tyranny!

Value-Added Resellers – Offer the tool to your customers as a reseller. Make money on training and consulting. Contact us with further interest in reselling Map Business Online.

Win a $20 Gift Card! Refer a business associate to Map Business Online in exchange for a $20 Amazon Gift Card!

America’s best geo mapping software.

Find out why over 25,000 business users log into www.MapBusinessOnline.com for their business mapping software and advanced sales territory mapping solution. The best replacement for Microsoft MapPoint happens to be the most affordable.

Discover Map Business Online – tools for making business maps


Posted in Business Mapping Software blog post, How to instruction | Tagged , , , | Leave a comment

How to Build Clarity into Your Business Map

MapBusinessOnline provides a variety of professional mapping features including map visualization, location database management, and summation and calculation tools.  These map creation and geographic database tools allow the user to identify and analyze areas of interest on a map for business purposes.

A critical set of these tools is the draw and the search tools used to create map objects or shapes on the map. These buttons are located in the middle of the Master Toolbar under the heading Search Tools. Button placement on the toolbar can migrate over time as new features are added, that’s one reason we like to point out button locations.

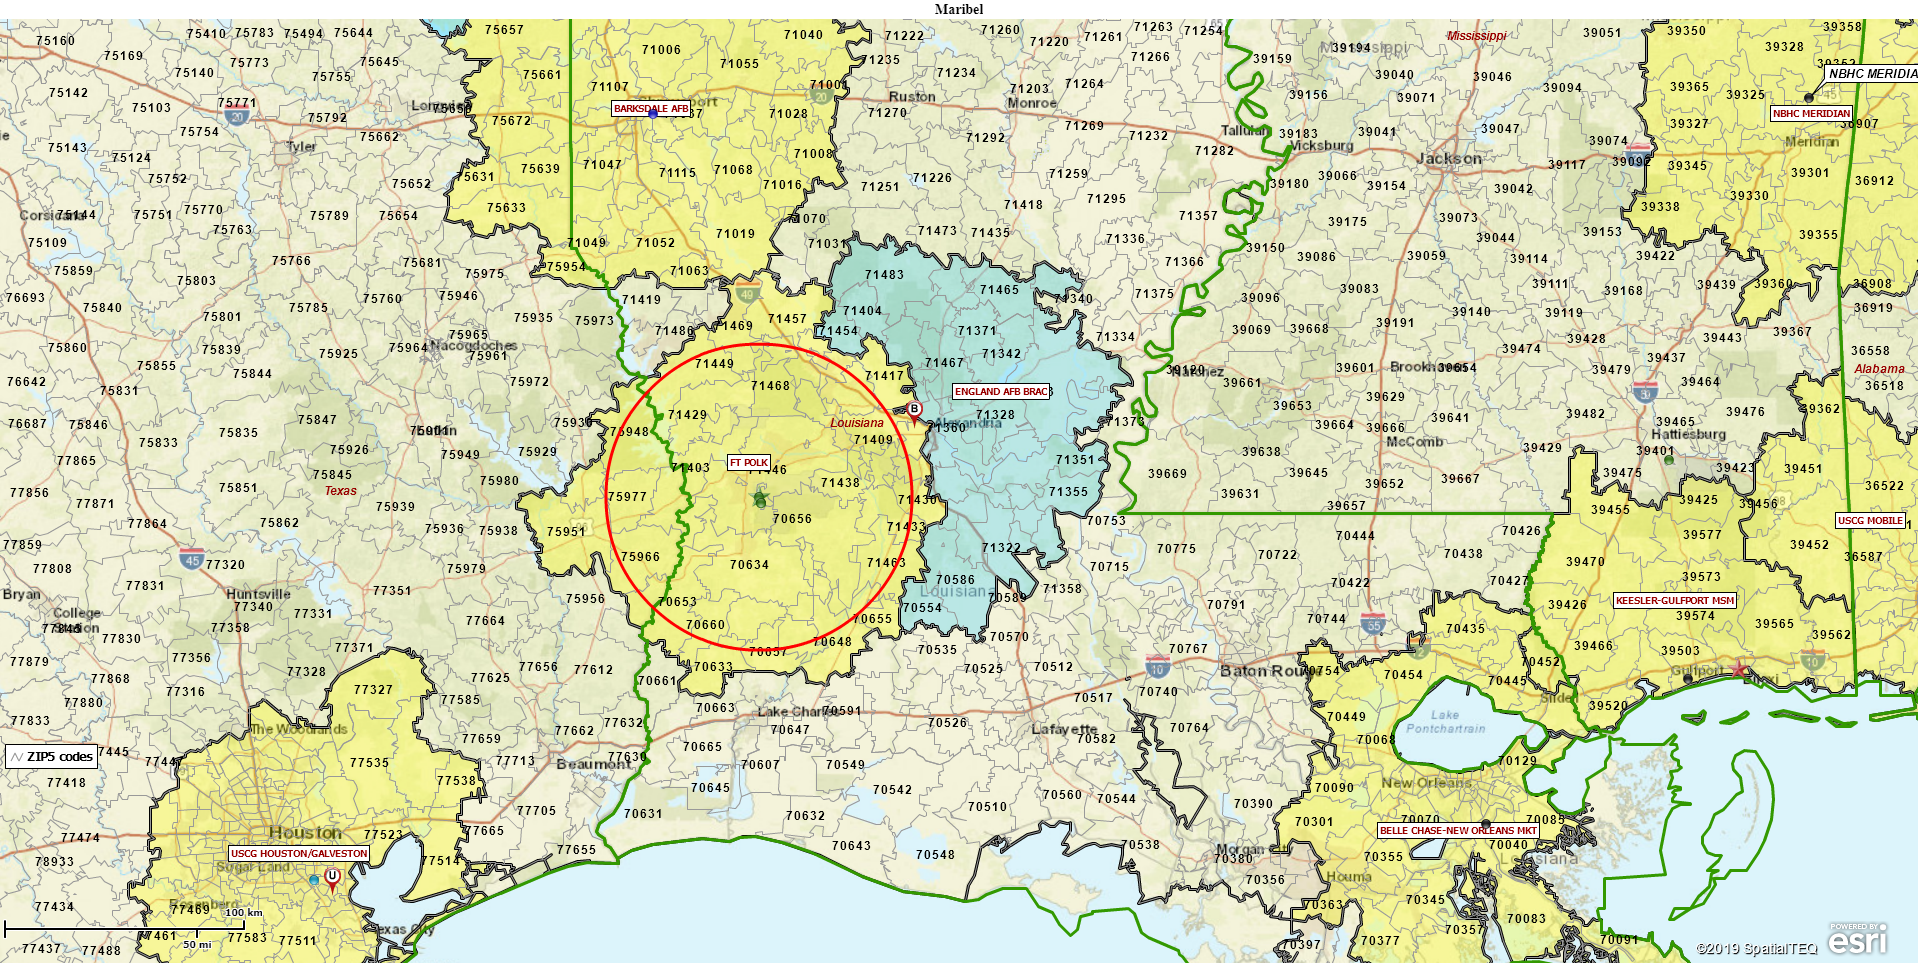
This week, I interviewed a long-time MapBusinessOnline user who has been applying some of these drawn map objects in a creative and yet entirely business-focused way. Her name is Maribel Roman and she is a manager at the Enrollment & Service Center at Www.tricare.mil in San Antonio, Texas.

Her maps were both informative and beautiful. This MapBusinessOnline user places a 40-mile radius circle on a map area to reflect a hospital system’s general coverage area around the central address. Next, she often draws another circle with a 40-mile radius overlapping the original circle. This is to expose areas outside of the hospital coverage area and differentiate those areas from inside the original 40-mile HMO coverage circle.

Appreciating Map Clarity

What I liked about her map was its clarity. The purpose of the map was clear. The colors of the map were understated which further emphasized the map’s intent. The mapmaker used her own choice of color for unshaded ZIP codes, as opposed to the Map Business Online default colors. We’re not always right – think for yourself and for your map. I believe she used a very transparent pale yellow, which tends to serve well as a background color.

Maribel’s territory boundaries were carefully colored a dark shade, and not too thick. They are darkened just enough to highlight the critical HMO system territory areas.  I asked her to tell the specific color she chose. She wrote, “Map & Data: check Line box (color= 999999), transparency=50% then uncheck fill box.” Business mapping can be detailed.  I love it.

I also liked her logic. She used 40-mile radius because it reflected actual insurance coverage rules applied by the armed forces to their network of service people. Each HMO’s are responsible for armed services healthcare within a 40-mile radius of the major hospital locations. As you might imagine, Congress and the various military branches have all sorts of rules around requesting and receiving healthcare. Maribel expertly crafted several key maps that visualize these rules.

Maribel’s Well Defined Map

MapBusinessOnline offers a variety of shape creation tools or map object tools designed to produce a variety of shapes on the map and color fill them with appropriate and differentiating shades. By experimenting with a variety of colors, and border thicknesses the map creator will discover there are optimum map views to present to their map audience. Specific map views, with understated colors, carefully chosen map object boundary thickness and shades, will make your map stand out. Your maps will be viewed as more effective and more professional.

Give Your Labels Some Love

Another map element applied subtly by Maribel and that deserves a map creator’s careful attention, is labeling. Labels existed to identify ZIP codes, counties, states, and territories. A critical step in map making is taking the time to decide which labels are most important to include on your map. Too many labels can make the map too busy, distracting from the map’s purpose.

Our map creator, in this case, chose to use ZIP code labels and to make them bold, non-italicized, and black. ZIP codes were the important elements to her health insurance map, so she chose to label them boldly. It made sense to give them prominent placement. It added value to the map.

For centuries cartography and map-making skills were restricted skillsets, available only to trained cartographers appointed by royalty or the Christian Church. Maps were state secrets. Mapmaking was half art and half science, although, during the Church era of the middle ages, science was abandoned in favor of God. Remember those Jerusalem centric maps of the world? (Me neither.)

Today, almost anyone can access advanced map-making tools such as MapBusinessOnline, or more advanced GIS tools like www.esri.com. I say, “Go for it.” Just make sure you apply some thought and creativity like Maribel Roman.

We recommend users access MapBusinessOnline via the downloadable Map App.

The Map App install is fast and easy. The Map App is a cloud-based service, once you’ve logged in you’ll have access to all of your previously saved maps and data. The Map App is a better user experience and provides access to more features than the Web App. The Flash-based Web App link will remain available until December 15, 2020.

The Map App includes the new Map Viewer app for free non-subscriber map sharing.

Value-Added Resellers – Offer the tool to your customers as a reseller. Make money on training and consulting. Contact us with further interest in reselling Map Business Online.

Win a $20 Gift Card! Refer a business associate to Map Business Online in exchange for a $20 Amazon Gift Card!

America’s best geo mapping software.

Find out why over 25,000 business users log into www.MapBusinessOnline.com for their business mapping software and advanced sales territory mapping solution. The best replacement for Microsoft MapPoint happens to be the most affordable.

Discover Map Business Online – tools for making business maps


Posted in Business Mapping Software blog post, How to instruction | Tagged , , , , | Leave a comment

How to Approach Market Analysis Using Map Business Online Pro

When I think about writing about new MapBusinessOnline features, I often consider describing possible workflows. With Map Business Online Pro Market Analysis tools, a workflow can be a very subjective experience.

Many MapBusinessOnline Pro business mapping users may simply require a map-analysis operation to achieve a single goal, For example:

  • Create 30-minute drive time sales territories around twenty-four center points
  • Calculate the driving time distances to a Store from all Customers within a 10-mile radius of the Store
  • Determine the top 25 cities with the highest income living within a 20-minute drive time of the city center

Other users may have to conduct more a extensive analysis that involves applying multiple business mapping tools. At times, these more complex projects may require the export of results and further analysis or operations outside of MapBusinessOnline, perhaps requiring a reimport for more MapBusinessOnline work.

For this reason, I like to refer to MapBusinessOnline Pro as a toolkit. You may ask, “What sorts of projects in my business might warrant the use of MapBusinessOnline Pro?”

Market Analysis

I can’t claim that every marketing map analysis challenge will be suited to a MapBusinessOnline, location-based solution. But I can say that if the markets in which your business plays entail geographic and demographic components, you may find market map business analysis helpful.

Examples of geographic components would be addresses, ZIP codes, city limits, or Market Statistical Areas. Demographic components would be applied if your business considers population, household income, or some other demographic characteristic important to sales success.

Expansion Planning – Moving to a new area is a location-based challenge. How do new ZIP codes compare to old ZIP codes? What’s are the best demographic ZIP code areas to expand the business into?  Once the move occurs, what are the new territories and prospective customer lists for each rep?

  • Create an existing and viable demographic profile by ZIP code (MSA or county) as a baseline against which to compare future marketing efforts
  • Develop a total regional market analysis map that provides up to a dozen possible areas with optimum customer, resource, and labor characteristics
  • Analyze potential location area costs for doing business – buildings, taxes, labor, insurance
  • Search for Business Listings of competing businesses or potential prospects. Business listings can be critical to strategic plans.

Match Customers to Stores – Customers, patients, vendors – your business customers are unique to you. Analyzing the relationship between end-users and places of business can be complex. Use market analysis tools to understand customer placement concerning physical places of business.

  • Find the nearest group of customers to a specific store or set of store locations
  • Calculate the distances between end-users and facility locations, such as customers and dealers
  • Analyzing time and distances across a network of address points to address logistics issues like time on the road, fuel consumption, or general expense reporting

Field Sales Accountability – MapBusinessOnline market analysis tools provide a set of tools for managing people on the road or in call center environments.

  • Create territories based on driving time or driving distances to and from home locations.
  • Assess sales potential based on demographic category statistics for standardized urban areas
  • Monitor sales results across all territory areas and share the results via interactive web maps or business meetings

Market Share Analysis – Businesses that are responsible for selling products that compete with other manufacturers are very interested in their share of the market. Map-based analysis of market share should include actual sales figures by sales target areas. If the user has total product sales estimates for the industry/area, and the user’s company’s sales figures for the same product, market share calculations should be straight forward.

  • Visualize total market and company sales figures against a territory map
  • Create a share market ratio using calculated data columns
  • Demographic overlays that describe market makeup by location or region

Accessing Tools from a Tool Kit

MapBusinessOnline lets the user conduct market analysis by processing spatial analysis one process at a time. For instance, your project may require a map visualization of existing sales. MapBusinessOnline provides such visualizations for almost every one of our customers, daily. And that visualization may be all a user requires.

But you may also require a demographic breakdown showing Median HouseHold Income by ZIP code, for instance. This entails a second operation, easy to apply and expand upon your original map visualization.

Market Analysis offers an additional array of map-based analysis operations to further extend the scope of your business analysis.   In terms of workflow, think of it this way:

  1. Import your organization’s relevant location-based business data into Map Business Online
  2. Color-code the imported points as required for optimum map audience viewing
  3. Create an appropriate demographic background map using map layer shading
  4. Use market analysis to
    1. Add drive time or distance-based territories
    2. Calculate driving times or distances between locations
    3. Find all imported customer data within driving times or distances of multiple center locations

By keeping your use of MapBusinessOnline flexible, and taking advantage of all the simple and more complex operations available in the overall software, a map user will find answers to business questions that benefit your organization and that user’s value to the company overall.

We recommend users access MapBusinessOnline via the downloadable Map App.

The Map App install is fast and easy. The Map App is a cloud-based service, once you’ve logged in you’ll have access to all of your previously saved maps and data. The Map App is a better user experience and provides access to more features than the Web App. The Flash-based Web App link will remain available until December 15, 2020.

The Map App includes the new Map Viewer app for free non-subscriber map sharing.

Are you using the Map Business Online Desktop App for MAC or PC? It’s hipper than Instagram and it comes with your subscription. Escape Web-Browser Tyranny!

Value-Added Resellers – Offer the tool to your customers as a reseller. Make money on training and consulting. Contact us with further interest in reselling MapBusinessOnline.

Win a $20 Gift Card! Refer a business associate to Map Business Online in exchange for a $20 Amazon Gift Card!

America’s best geo mapping software.

Find out why over 25,000 business users log into www.MapBusinessOnline.com for their business mapping software and advanced sales territory mapping solution. The best replacement for Microsoft MapPoint happens to be the most affordable.

Discover Map Business Online – tools for making business maps

Posted in A story, Business Mapping Software blog post, How to instruction, Sales and marketing | Tagged , , | Leave a comment