A Word About ZIP Codes – ZIP5, ZIP3, ZCTA, and Points

To build a ZIP Code Map using MapBusinessOnline click this link & register

MapBusinessOnline includes a map layer of ZIP5 codes for spatial reference to ZIP code boundaries.  US Postal Service (USPS) ZIP code boundaries are used as the basis for territory construction.  By applying MapBusinessOnline map layers like ZIP5 codes, states, and counties as the basis for territory construction, MapBusinessOnline can incorporate data into territory analysis views. Analysis that might include demographic categories or user-imported data.

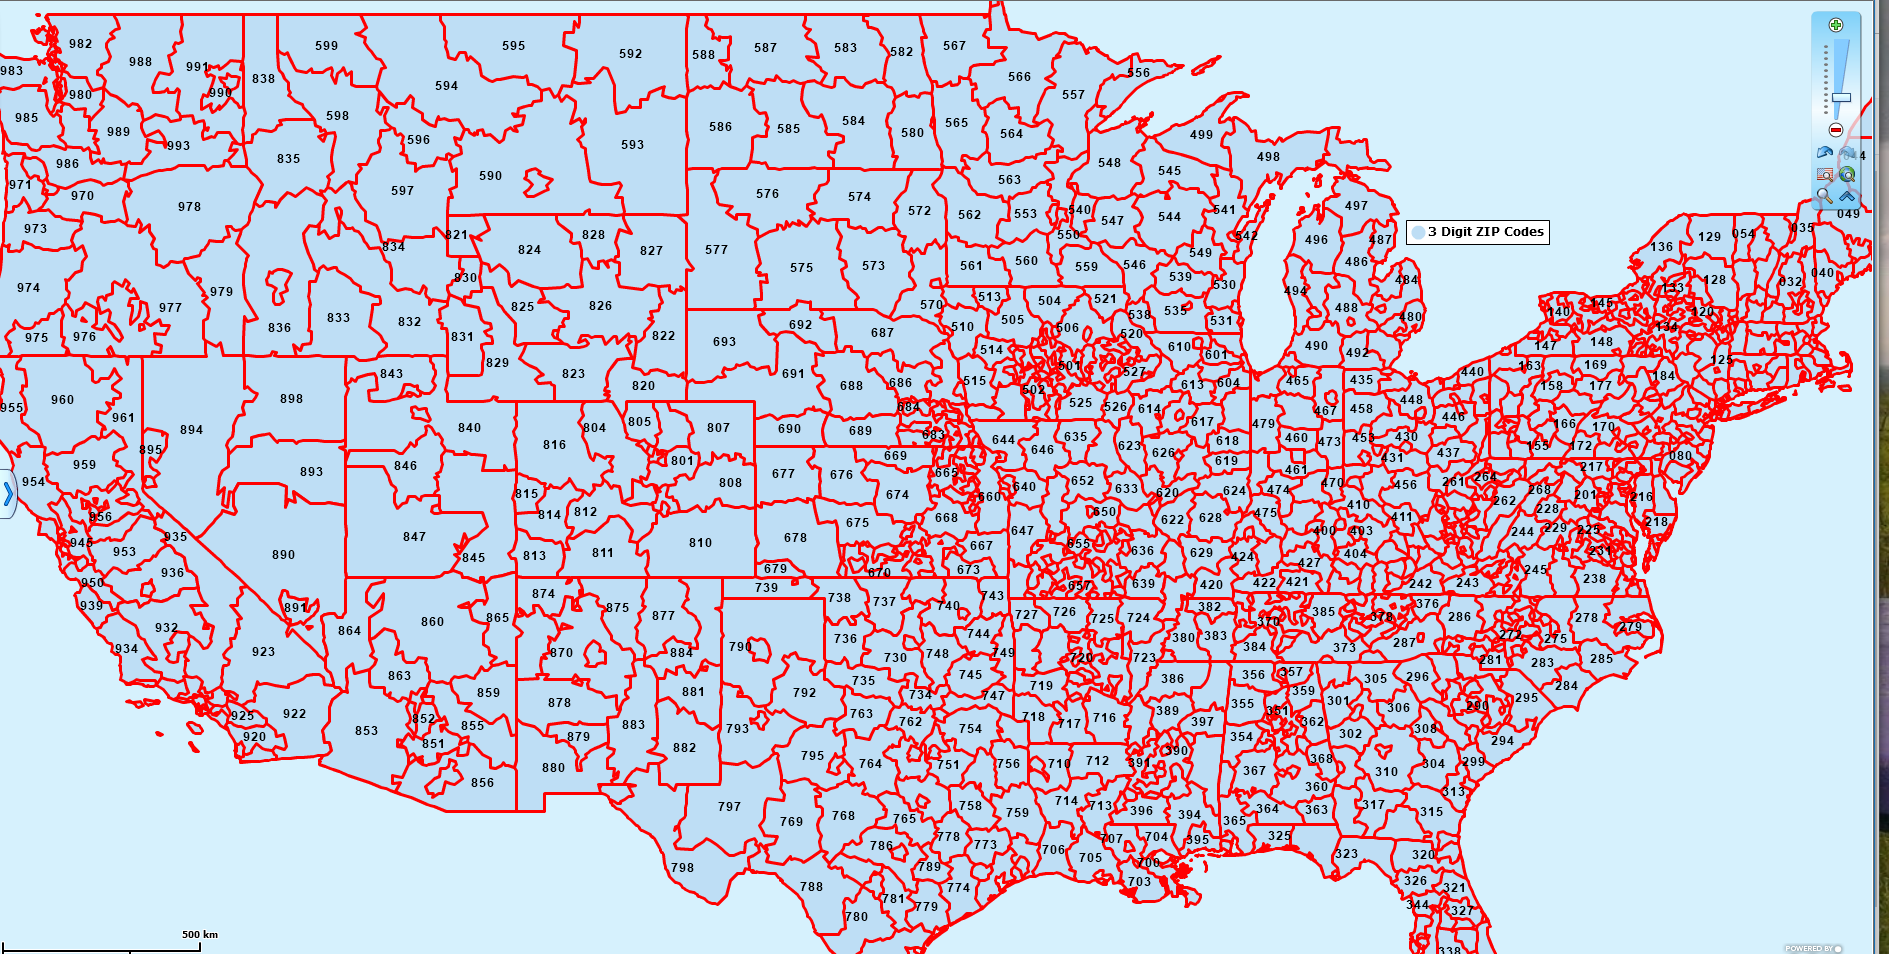
MapBusinessOnline Standard subscriptions also include access to ZIP3 or 3-digit ZIP codes through the Add Map Layer button.  3 digit ZIP codes represent larger areas around the nation.  A 3-digit ZIP code is simply the first three digits of a 5-digit ZIP code. So for Massachusetts, the 3-digit ZIP code numbers would include 021 and 019. The 5-digit ZIP code where I grew up was 01966. Go Vikings!

3 Digit ZIP Codes


Census ZCTA ZIP Codes

First-time MapBusinessOnline users will note that the ZIP code layer delivered with a new subscription is set to the default of ZCTA ZIP codes from the US Census Bureau. ZCTA stands for ZIP Code Tabulation Area. A business mapping software user can change the ZCTA layer to the USPS standard ZIP5 Code layer by clicking the Map Options Gear in the Map & Data toolbar. Choose the ZIP Code tab and the Drop Down to USPS ZIP Codes With Fillers. CTA ZIP codes will provide more accurate estimates for specific Census categories.

Learn More About ZIP Code Mapping Using MapBusinessOnline

ZIP Codes with Fillers

We recommend selecting the USPS ZIP codes with fillers because that ZIP5 code map layer option will automatically accommodate national parks and other areas where ZIP5 codes do not exist. This avoids creating many mysterious territory holes in your business map, especially out west where national parks are a certified thing. So if you notice your sales territory maps have white spaces in them, the fill isn’t consistent, it is probably from a lack of fillers. Remember, if you do change to ZIP5 codes with Fillers the fix is not retroactive. You will have to reconstruct your sales territories to fix those holes.

ZCTA ZIP code and USPS ZIP5 code boundaries generally reflect identical boundaries.  But there can be some differences. ZCTA is a Census Bureau version of ZIP codes used to tabulate census data. ZCTA ZIPs are more closely aligned with Census block areas, where the USPS postal codes focus more on mail delivery and other USPS concerns.  ZCTA ZIPs are designed to focus on populated areas. Rural areas may not have associated ZCTA ZIP codes. Read more about ZCTA ZIP codes here.

MapBusinessOnline first included ZCTA Census-based ZIP codes because they are freely available from the Census Bureau, making them appropriate for use with our free 1-month trial of the product.

ZIP5 Boundaries vs. Points

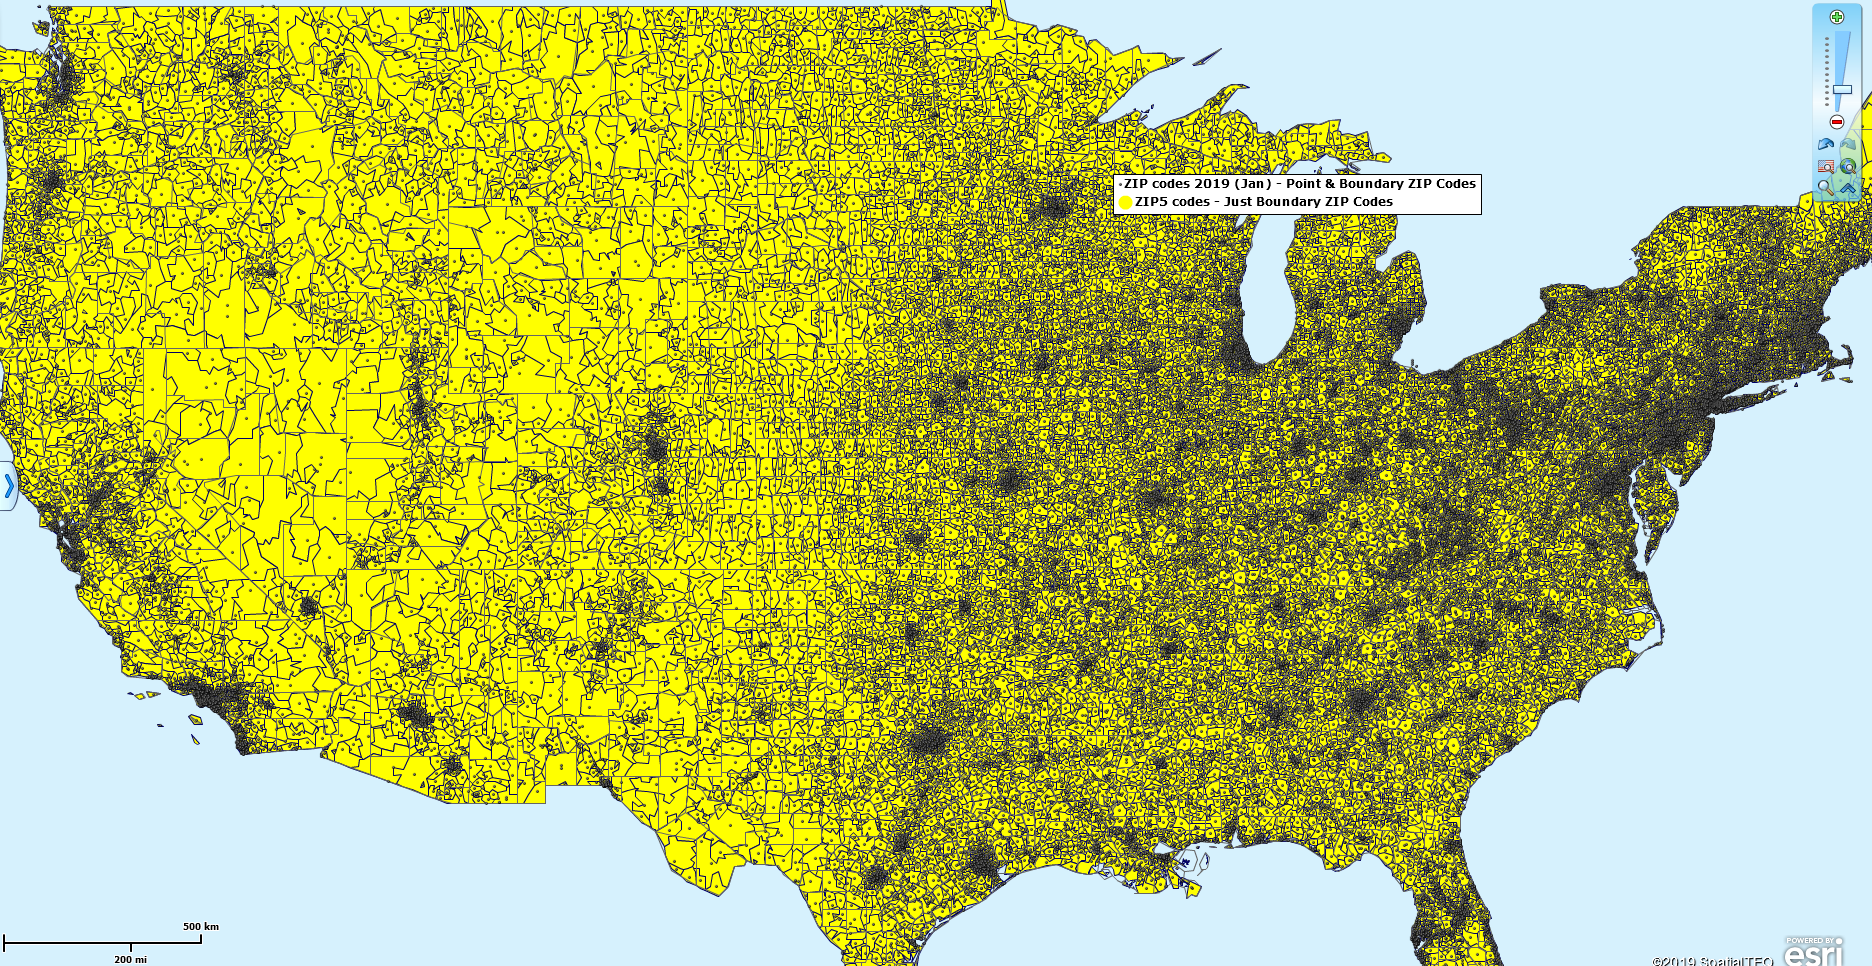
ZIP5 codes are generally attributed to the US Postal Service. USPS ZIP codes in Map Business Online map layers are boundary ZIP codes.  MapBusinessOnline boundary ZIP codes are used to create territories and areas of interest. A ZIP Code radius search of a ZIP code layer returns a collection of boundary ZIP codes for export.

Point ZIP Codes over Boundary ZIP Codes

Point ZIP5 codes represent large USPS mail stops for big facilities like military installations, hospitals, assisted living centers, or skyscrapers.  The USPS ZIP Code list includes 33,353 boundary ZIP codes and 7,638 point ZIP codes as of this writing. A complete list of Boundary and Point ZIP codes is exportable from the ZIp5 Code layer in the Data Window view. The ZIp data is also available in the MapBusinessOnline Public Data from the Server, accessed through the Plot Data button on the master toolbar. Read more about Boundary and Point ZIPs.

A common question from MapBusinessOnline potential users is, “How do I map my ZIP codes?” While all this ZIP code information may feel a little overwhelming, please remember that ZIP codes are a man-made organizing tool to help deliver mail efficiently. ZTCA is a twist on that tool to help the Census Bureau compile data, and boundary and point ZIP codes simply differentiate areas from large buildings.  With all that in mind, go build yourself a ZIP code map.

Remember, for sharing your ZIP code map your non-subscribing map viewers can now download the Map App for free and access a free Map Viewer App that automatically launches MapBusinessOnline from your emailed MapShare link.

_______________________________________________

Discover why over 25,000 business users log into www.MapBusinessOnline.com for their business mapping software and advanced sales territory mapping solution. The best replacement for Microsoft MapPoint happens to be the most affordable.

To access MapBusinessOnline, please register and download the Map App from the website – https://www.mapbusinessonline.com/App-Download.aspx.

After installing the Map App, the MapBusinessOnline launch button will be in the Windows Start Menu or Mac Application folder. Find the MapBusinessOnline folder in the Start Menu scrollbar. Click the folder’s dropdown arrow and choose the MapBusinessOnline option.

The Map App includes the Map Viewer app for free non-subscriber map sharing.

Please read customer reviews or review us at Capterra or g2crowd.

Contact: Geoffrey Ives at geoffives@spatialteq.com or Jason Henderson at jhenderson@spatialteq.com.

Posted in Business Mapping Software blog post, How to instruction | Tagged , , , , , | 1 Comment

How Do I Search Data By Territory?

How Do I Search Data by Selected Territories? That’s a great question for a Map Business Online user to ask.  Did you realize there is a button on the Data Window toolbar called Search Data by Selected Territories?  Well, there is. It is a Bright Yellow Puzzle Piece – See my carefully highlighted picture just below.

The Search Data Button in the Data Window

That innocuous little button does a variety of things, but is especially useful for sales territory mapping.  Let’s explore this further.

The Data Window

The Data Window provides a datasheet view of any data layers you’ve imported; data Map Business Online provides like map layers and demographic data; and combinations of data that you have overlaid and filtered using the More Data button and the Filter button.

Read more about the More Data button.  Read more about the Filter button.

The Data Window provides its toolbar of functions along its top margin. These buttons enable a variety of capabilities. Notice the Data Drop Down selector on the far left of the Data Window toolbar. You will discover that as you drop down and select different layers, a changing array of buttons appear in Data Window toolbar.

The Data Window toolbar changes depending on the type of data you’ve selected.

Try selecting the different data layers available. Notice the shifting toolbar options. When you select an imported point layer, the Data Window toolbar functions are focused on filtering and editing point layers.  When you select a map layer, the toolbar provides tools that are focused on filtering and editing map layers. What a convenient and clever business mapping software!

http://www.mapbusinessonline.com/Solution.aspx/Excel-Maps

Querying Data by Territory

A major use of business mapping software is the ability to query a set of data based on an area on the map. That area could be an administrative district like a ZIP code, a drawn circle or polygon, or a territory. Examples of data querying requirements might be:

  • I’ve imported a list of prospects. I want to see all of the prospects within these specific counties
  • I need to find all the boundary ZIP codes in my territories
  • We need to see a list of all patients with the flu in these three ZIP codes

For this blog, we’re concerned about querying data within a Territory

For example, a new sales manager has imported all the company’s customers into a sales territory map. The manager plans on sitting down with each sales rep and to discuss their existing customer base. The map view shows a distributed set of blue dots over all the territories nationwide. To prepare for the meeting, the sales manager pulls up an isolated map view of each salesperson’s territory with the Data Window view of the rep’s associated customers.

The process in Map Business Online:

  1. In the Data Window Data Dropdown, select the imported company customer list
  2. Next, select the Yellow Puzzle Piece or Search Data by Territory button
  3. Choose the option to search inside a territory
  4. Select the territory of the next rep your meeting with
  5. Name the filtered result
  6. Export or simply use the Data Window in the meeting to view the data

The manager could also go back to the Territory view and filter to select only that territory, clicking Filter Data on the Map, to isolate and view just that territory for the meeting. Watch a video that demonstrates how to Filter Data on the Map.

Another quick solution using the Yellow Puzzle piece button is the query of all the boundary ZIP Codes. Using the Data Window Dropdown, select the ZIP5 code list, then select the Yellow Puzzle piece button. Name the result and export.  Remember, those are boundaried ZIP codes. If you want ALL ZIP codes, you will need to retrieve the latest total ZIP code list from the Plot Data Button:

  • Click Plot Data and choose the lower option – From Server
  • Drop down to the Public Data
  • Select the most recent ZIP Code (2019) list
  • Import the list – it will populate all sorts of dots on your map (you can uncheck in the Map and Data)
  • Select and Query using the Yellow Puzzle Piece as above to secure a list of every ZIP code in that particular territory or all territories

Read more about Point and Boundary ZIP Codes here.

Use the Yellow Puzzle Piece button in the Data Window for quick and easy data query and export.

Value-Added Resellers – Offer the tool to your customers as a reseller. Make money on training and consulting. Contact us with further interest in reselling Map Business Online.

Win a $20 Gift Card! Refer a business associate to Map Business Online in exchange for a $20 Amazon Gift Card!

America’s best geo mapping software.

Find out why over 25,000 business users log into www.MapBusinessOnline.com for their business mapping software and advanced sales territory mapping solution. The best replacement for Microsoft MapPoint happens to be the most affordable.  Discover Map Business Online – tools for making maps by map makers.

Posted in Business Mapping Software blog post, How to instruction | Tagged , , | Leave a comment

How Do I Color-Code My Business Location Data?

Another common MapBusinessOnline Chat inquiry centers around color-coding imported address data points. Any address or Latitude/Longitude dataset imported into MapBusinessOnline can be color-coded by symbol.  You can also color-code by map layer (ZIP code, county, Census tract).  So, by all means, add extra columns to your data for color-coding. (Some people use the term color coating map.)

Your spreadsheet should include columns for Name | Address | City | ZIP code | Sales | Sales Rep | any other data you want to include. Read more about importing data here.

Business map users color-code and symbolize their imported layer for a variety of reasons which could include:

  • To differentiate location points by type of business
  • To display ranked sales by rep or account
  • To quickly identify where a field person starts their day

Color-Code with Symbols

Keep in mind, in MapBusinessOnline, when using the Symbols button (the three colored dots under the Color-code section of the Master Toolbar), you can only color-shade your points and symbols by one theme or one column of your data. For example, you can color-code points based on Revenue 2018. But you can’t color-code by both Sales Rep and by Revenue 2018.

If you want to color-code by two or three themes or variants use the Color-code with Circles or put Charts on the Map options. Both are buttons on the master toolbar.

That being said, you could color-code a set of imported addresses by Sales Rep and then note the Revenue 2018 in the point’s label. You could also note the revenue by state, county, or territory in those respective labels. Those revenue numbers would be totals, aggregated by jurisdiction. MapBusinessOnline’s labeling function will sum the data for you. Each jurisdiction label, and each imported point Callout has five flexible label fields for you to populate. That’s in addition to name and address data labels.  Read more about labeling here.

Most of the time you will use the Symbol Color-Coding button on the master toolbar to color-code points. MapBusinessOnline lets the user color and symbolize with a range of up to 100 colored symbols. That’s plenty. Any more than that and you’ll lose your map audience’s attention (first their eyes glaze over, then they start to drool.) It’s all part of learning how to color-code a map.

Within the color-code by symbol dialogue the business mapping software user can:

  • Adjust coloring shades of symbols – MapBusinessOnline even accepts HEX number id’s
  • Choose symbols from the library or import your own symbols
  • Adjust color-shade range values
  • Choose from preselected coloring schemes

Best of all, it’s wicked easy to tweak. Just click the Symbol Color-Coding button again to adjust the coloring scheme to your liking. You’ll find that it remembers what you did.

For the most part we’ve focused on color-coding your imported business data, I just want to remind you that you could search for and download Business Listings and apply the exact same color-coding rules to those points. Read more on Business Listings here.

Remember, if you want to represent three separate columns of revenue covering three years, select the Color Code with Circle or Put Charts on the Map buttons. These buttons allow you to select two or three comparative columns and adjust the data symbol intensities and chart options, creating obvious comparative visualizations for your map viewers.

Try Map Business Online Map App for Windows or Mac – Faster, Better, Cooler

Color-Code Map or Boundaries Button

But wait. You could also uncheck you imported Data Layer in Map and Data and color-code map layers and territories based on imported data columns. The same rules apply, but this time your color-shading will be applied to ZIP codes, State, Counties, or Territories. Read more about Color-Shading ZIP codes etc. here.

In some business circles, the color-shading of administrative districts like ZIP codes is called heat mapping. In MapBusinessOnline we include our Heat Mapping option, which simply plots graduated intensity colors based on numeric values in a column of your data. Use the Heat Map button on the master toolbar to try that out on your map.  This is a great way to display sales figures because it quickly shows the most intense areas of activity. And it’s a great way to wake up that drooling audience (see ‘drool’ above.)

The Boundaries button is also a way to access Demographic Data for color-shading a map layer. For instance, you could color code the ZIP code layer on a map by population levels in each county, or you could color-shade the city limits layer by medium income.

Just as with color shading by points the Boundaries button dialogue provides controls over summation by map layer, exact color, data source, number of ranges, color applied to areas with no data, and it offers preselected color schemes.

Boundaries functionality is also reachable through any map layer settings gear in Map and Data. Look for the Color Code Map layer button. It’s nice to have multiple ways to get to the same operation across the program.

Single Symbol & Color for Imported Points

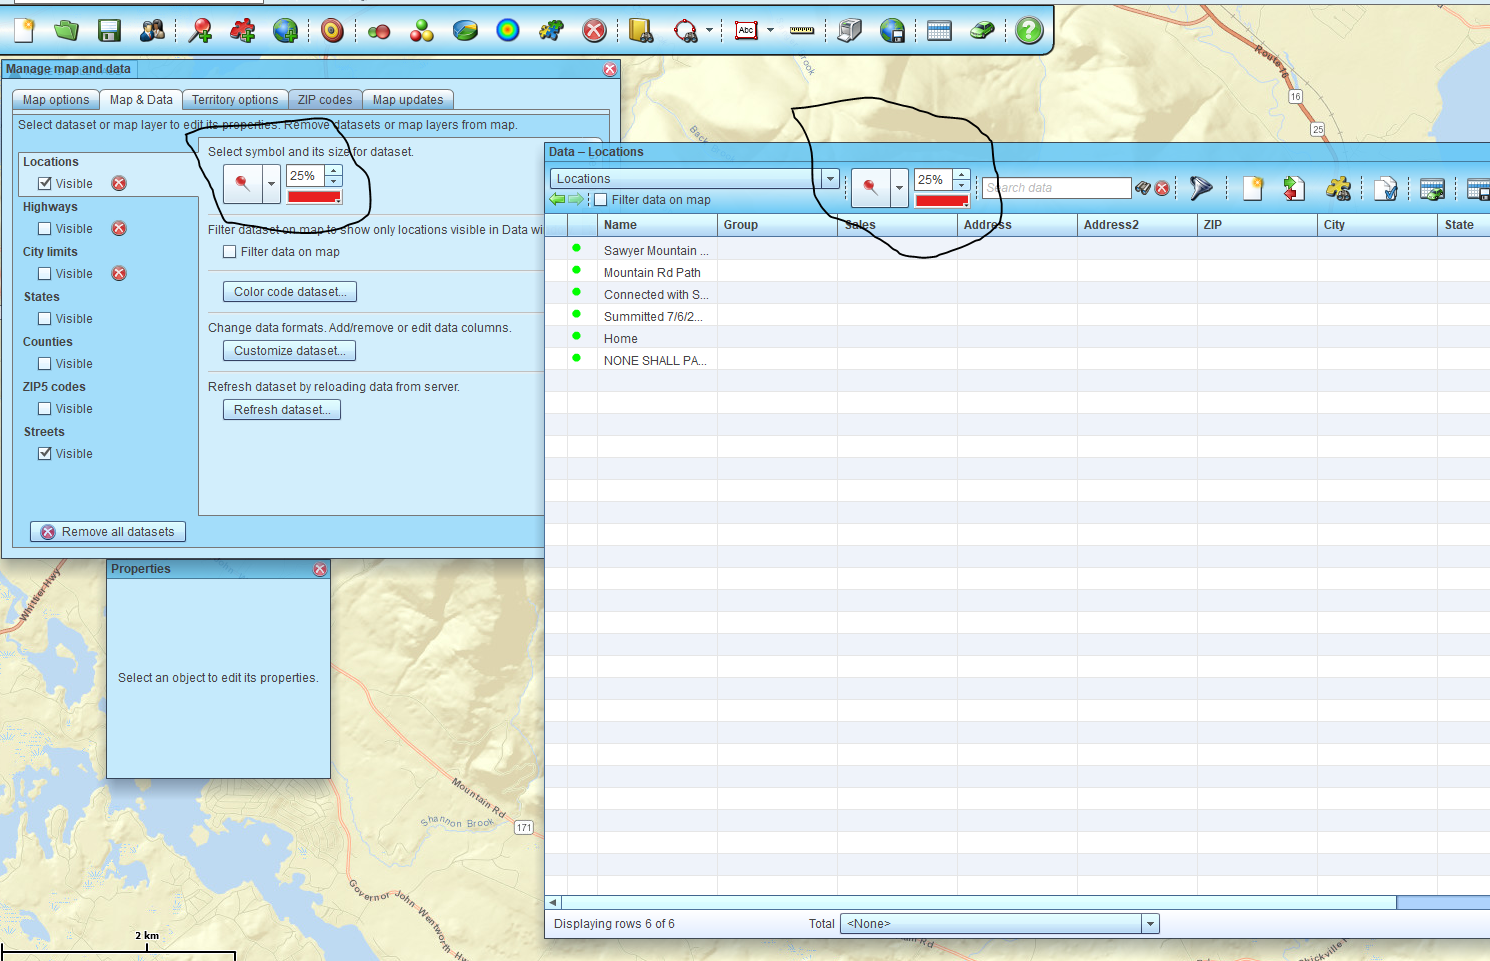
You will notice, as you import your business data the application automatically assigns a color and a symbol to your data.  You’ll see blue dots or circles at 50% presentation size on the map after import.  To adjust these points to a new color or symbol, without a creating a whole color-coding scheme, simply select the imported layer in Map and Data and click the edit settings gear – here you will find a symbol selector and a color and size adjustment tool.  You will find the same adjustment tools in the Data Window when the data layer is selected.

Same Bat function, two Bat places

Use these selectors and adjusters to tweak the point layer on the map – change from one color for all points to another color. Change the size of all points. Or choose a new symbol for all locations. But if you want to apply a full color-coding and symbol variation scheme, return to the top of this blog.

Import You’re Own Symbols

In all of the above scenarios, where the symbol library is available, you have the option to import your own small Jpeg symbols. Place your cursor in the Symbol Selector as if to select a new symbol. But instead of selecting a symbol, push the scroll bar on the right to the top. There it is – the ‘import your symbol’ function.  It’s pretty self-explanatory. Before you go further, go make or find a symbol online or at a yard sale or in the back of a magazine at the barbershop. Once you’ve got your custom symbol, go back to the scroll bar and import it.  Now it is in your library of symbols for you to access.

The import symbols process is one way to drop a logo on the map, depending on file size.

These are the straight forward approaches to color-coding and symbolizing your imported data in Map Business Online. Now let’s clean up that drool.

_______________________________________________

Find out why over 25,000 business users log into www.MapBusinessOnline.com for their business mapping software and advanced sales territory mapping solution. The best replacement for Microsoft MapPoint happens to be the most affordable.

To access MapBusinessOnline, please register and then download the Map App from the website – https://www.mapbusinessonline.com/App-Download.aspx.

After installing the Map App, the MapBusinessOnline launch button will be in the Windows’ Start Menu or Mac Application folder. Find the MapBusinessOnline folder in the Start Menu scrollbar. Click the folder’s dropdown arrow and choose the MapBusinessOnline option.

The Map App includes the Map Viewer app for free non-subscriber map sharing.

Please read customer reviews or review us at Capterra, or g2crowd

Contact: Geoffrey Ives geoffives@spatialteq.com or Jason Henderson jhenderson@spatialteq.com

Posted in Business Mapping Software blog post, How to instruction | Tagged , , | 1 Comment

I Hope This Isn’t Too Revealing

Business mapping software and GIS tools transform location-based business data into new perspectives on business issues. These new views of your business data are used to confirm suspected trends in business, or they may reveal something completely unexpected.  “My heavens,” said Granny, “Business maps are so very revealing.”

Examples of what business maps reveal to the Map Business Online customers who subscribe to them include:

ZIP codes with High Populations Expose Inadequate Sales Coverage – Sales territory alignment and sales coverage areas are common applications of business mapping software.  Demographic ZIP code maps, while less common, are created regularly. Combining these layers, perhaps with an overlay of the locations where salespeople start their day, can be revelatory. Look for areas with high population counts. The map view can be a simple ZIP code heat map based on population. Make a note of all high population ZIPs that do not have a salesperson starting their day within 20 miles of that ZIP code center point (radius distances will vary based on business type.)

Insurance organizations often match agent or adjuster density with population density. Retail and restaurant chains also consider population densities when expanding.  Matching sales coverages to demographic statistics are so revealing, it’s absolutely shocking.

The Top Five Most Lucrative Cities for Expansion – Market analysis can feel overwhelming. The opportunity to expand your business is a great problem to face. But you are busy managing your unique business, not the business of market analysis. How can you get it all done?  The good news is that business mapping software can easily reveal your best markets for expansion if you provide your critical business metrics.

Armed with your best performing ZIP codes and a general sense of who your ideal customer is, business mapping software can generate a ZIP code profile of your business. This analysis might include a demographic breakdown of your typical customer and the rough size of your best performing service area. You know this. City income levels by age and sex are often a crucial demographic for consumer businesses, as are population statistics. Presented with the ten most lucrative urban or rural options, you and your team can think through which of these cities is your best expansion option based on additional factors related to your specific business  – like the job market, city climate, childcare resources, and crime statistics.

Armed with your everyday understanding of your business, business maps can be daringly revealing.

Try Map Business Online Desktop Apps for Windows or Mac – Faster, Better, Cooler

Sales Territories are Defined by Critical Business Elements – Sales territories are often created and assigned based on legacy sales dollars per region, demographic income statistics, or population levels. These are classic applications of Map Business Online. But sales realities don’t remain static after the first territories are posted. Over time markets change, while industries rise and fall. By regularly reviewing the sales territory structure with respect to sales trends, savvy sales managers can tweak account assignments and coverage areas to address changing markets. These reviews need only take place once or twice a year, but online business mapping makes this analysis fast and painless.

Sales territory maps should consider emerging industry opportunities.  Are all salespeople calling on alternative energy and biotech companies? If not, why? Does any single customer organization constitute more than 25% of a salesperson’s total revenue stream? (allowable percentage may vary.) Why?  These are questions that business maps can help expose and answer.

Reviewing your sales territory structure on a regular basis is revealing, rewarding, and comforting.

A Single Salesperson’s Territory – The humble traveling salesperson. To the traveling salesperson, the sales territory map is a Godsend. An affordable solution with optimized vehicle routing, many road warriors use Map Business Online to manage their sales routes. The salesperson’s customer views are just as critical. Some with basic requirements including just a few hundred customers and prospects might even use the tool as a CRM. Their sales map represents their world. They take notes on accounts and plan their visits, all within Map Business Online. A revelation here might be the fact that they haven’t called on an account in several sales cycles. Regularly color-coding customer locations by the date of last sales call will provide an informative map view for the salesperson on the go.

Other Map Business Online map views helpful to sales associates include:

  • Business listings from specific NAICS industry categories by coverage area
  • A map view of lost accounts for occasional follow-up
  • A map layer of all coffee shops and diners with WiFi

Salespeople’s maps leave little to the imagination.

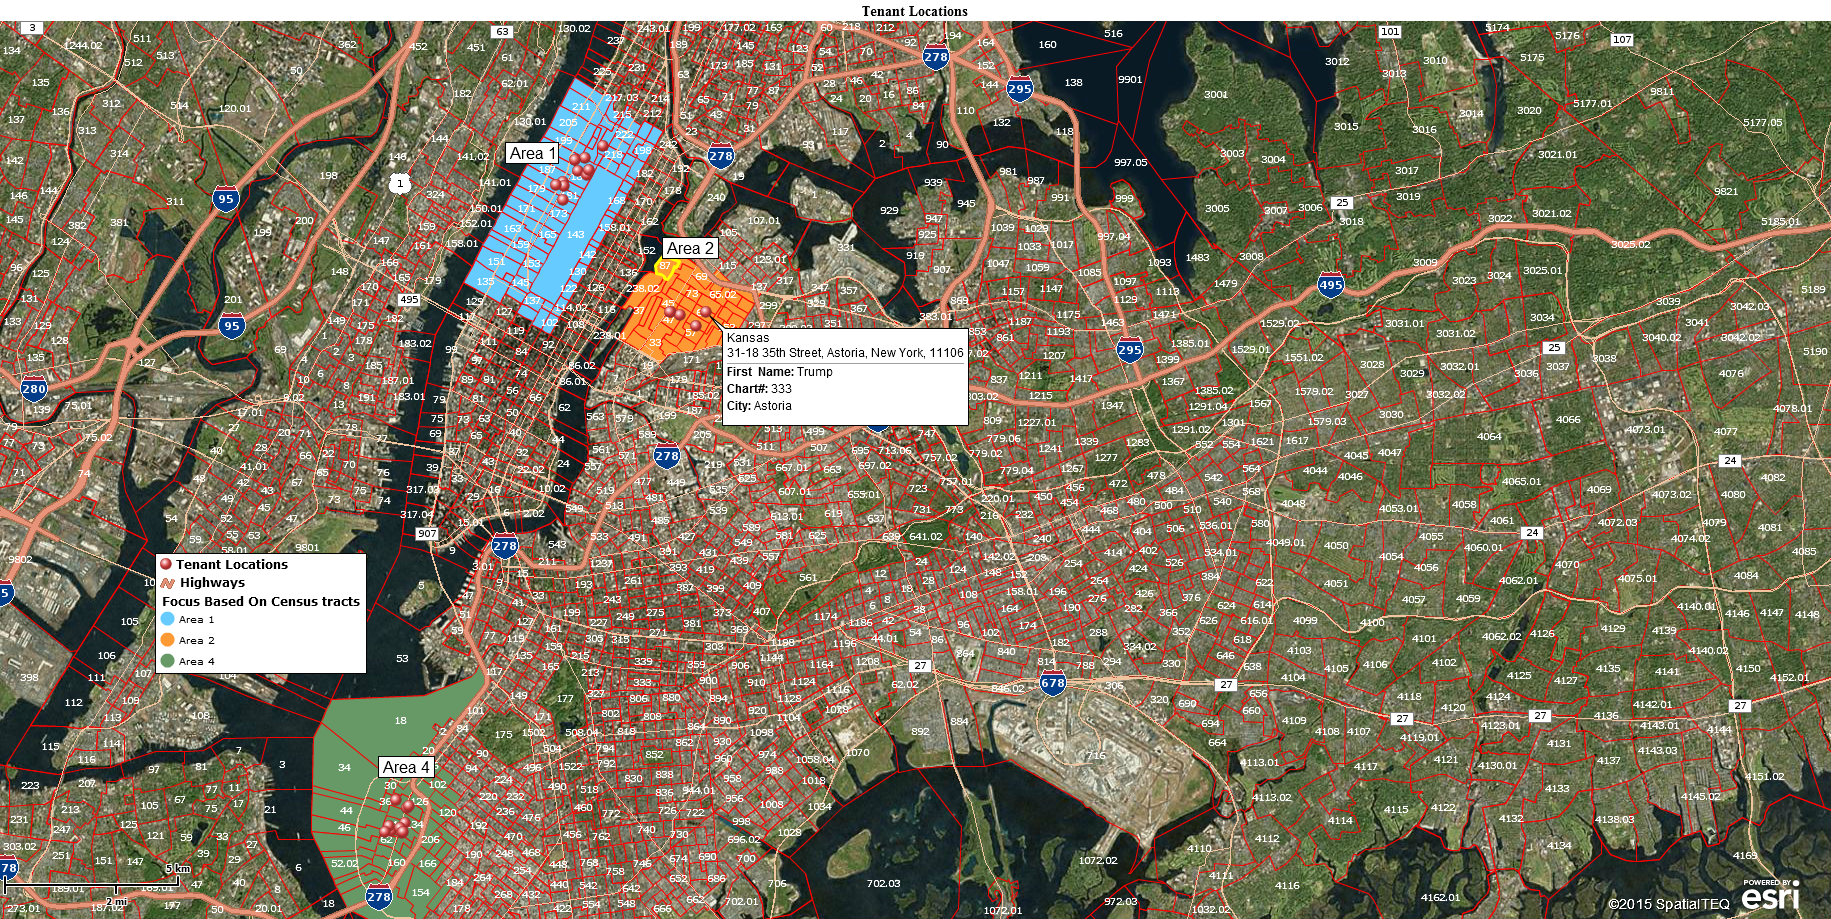
Manhattan Home Care Clinician Territories – We all know New York is unlike anywhere else on Earth. Well, that fact impacts home care clinicians too. Map Business Online territories arranged by Census tracts are used to accommodate high population areas around Manhattan and other densely populated urban areas. Typically, ZIP codes are applied, but in New York, a ZIP code could include a half a million people. A switch to Census tracts, as a base map layer, allows the healthcare map-user to focus in on smaller city segments.

Census Tract Map Layer in Use

Home care scheduling can be an overwhelming task to manage. I’ve spent time with a home care agency scheduling team. So many aspects of home care appointment management are subject to change at any moment:

  • Patient status – sudden hospitalizations or just not feeling well
  • Homecare agency overloads or staff shortages (think the Flu)
  • Traffic issues
  • Weather emergencies
  • Patient deaths
  • They forgot their appointment
  • Car trouble

And any of these sorts of issues will throw off appointment scheduling balance leading to more delays and cancelations. I was horrified to realize how difficult homecare scheduling really is.

Digital map views with patient and clinician overlays can institute organization over a chaotic environment.  Start of day staff visualizations helps schedulers view options when things get crazy. Territory assignments based on realistic driving time estimates, and peak traffic time-of-day assessments, help to guide decision making and ease scheduling nightmares.  They don’t all go away at once, but things can be managed more effectively using business maps.

And homecare scheduling with maps isn’t for everyone. But you may find within your organization a person who loves maps and also understands scheduling. Mash those two facts together and watch your system improve. Reveal that map geek and leverage their spatial skills towards business problems.

No matter what they are wearing, maps can never be too revealing.

Value-Added Resellers – Offer the tool to your customers as a reseller. Make money on training and consulting. Contact us with further interest in reselling Map Business Online.

Win a $20 Gift Card! Refer a business associate to Map Business Online in exchange for a $20 Amazon Gift Card!

America’s best geo mapping software.

Find out why over 25,000 business users log into www.MapBusinessOnline.com for their business mapping software and advanced sales territory mapping solution. The best replacement for Microsoft MapPoint happens to be the most affordable.  Discover Map Business Online – tools for making maps by map makers.

Posted in Business Mapping Software blog post, Sales and marketing | Tagged , , | Leave a comment

Map Business Online License Terms-of-Use

Every software application is regulated by a terms-of-use legal agreement or license. Map Business Online is no exception. Most of us ‘click to agree’ without reading software agreements. Some of us click after visually scanning the agreement. And a few of us read the whole agreement before clicking “I agree.”

There are a few allowances and restrictions in the Map Business Online Terms-of-Use agreement that are important to Map Business Online, and some aspects of the agreement offer generous allowances users should be aware of. Below is a plain language review of the agreement’s key components.  For IT managers, Enterprise mapping use is described here.

Legal Access to Map Business Online

Map Business Online subscriptions are a single user license agreement. This means each Map Business Online licensed user pays for and is allowed access to one instance of Map Business Online. Each individual paying user is allowed access to the business mapping software and accesses the tool by logging in with the specific licensed user email address.  The license does not allow second and third users to access the tool by using the registered user’s email and password. Sharing login email credentials for logging in is a violation of the license agreement.

The single user who pays for the license may access the tool through multiple machines, but this is not the same as another person accessing the tool using the subscriber’s email address.

Multiple users using Map Business Online to create and edit maps should own multiple licenses or team subscriptions. If your organization has multiple users logging in to the application using one shared email account and password, you are violating the terms-of-use agreement. Any non-registered users should stop accessing the tool in this manner.

For example, if ABC Company buys one Map Business Online full-year subscription and allows multiple employees to access the tool using a general log-in email such as Sales@abccompany.com, they are in violation of the terms-of-use agreement. Or if Frank@abccompany.com allows other people in the office to log into his  Map Business Online account and do map work, that too is a violation of the software license.

In addition to license non-compliance, multiple users who access the tools using one registered email address often override each other’s map data, and map adjustments. Misuse of the software in this way is risky. Maps and data get lost. We get panic calls from users who’s “maps have disappeared.” Retrieving lost maps gets expensive for the user. The tool is not designed to support multiple user access in this manner.  Team sharing is designed to support collaborative map editing.

Try Map Business Online’s Desktop App for Windows or Mac

We politely request that customers who allow multiple users to access one Map Business Online subscription, please assess your business mapping requirements, and consider purchasing more subscriptions.  If someone is editing maps, buy them a subscription. They are probably map-subscription-worthy.

Free Map Sharing

Map Business Online MapShare functionality allows non-subscribers to view shared maps as interactive web maps. This is the best way to share maps for view-only applications. MapShare allows up to 100 publicly shared map sessions per month at no charge. Publicly shared maps allow map viewers to:

  • Share routes and generate optimized vehicle routes
  • Query data and export the results
  • Pan and Zoom all over the world map
  • Save image files
  • Print maps

Not everyone loves maps, but if some of your shared map viewers are asking to edit and create maps, the company should consider buying them subscriptions. As mentioned above, they are map worthy folks.

Key Application Allowances

SDK and API tools are available for users to leverage programmable access to data and maps services. Read more about Map Business Online API and SDK services here.

Subscribers may include map images, printed maps, driving directions, and business data in presentations, reports, marketing studies, and academic publications for personal or internal business use – not for resale. Subscribers can print up to, but not exceeding, 5,000 copies of sales collateral containing Map Business Online maps or output.  So far, I know of no one printing more than 5,000 maps.

Subscribers can display or post on externally accessed Web sites, only to promote subscriber’s own products and services, or to display business locations and market areas.  This is fine to do as a consultant or value-added reseller. Just don’t try to resell the web maps without permission.

Map Business Online includes a growing demographic data library.  Demographic data may be used to generate informative maps and map images. The data may be exported for use outside of the application. Do not resell the demographic data or set up automatic download access to Map Business Online demographic data.

Business listings are also available through Map Business Online.  Business listings are purchased by Map Business Online users. They can be exported for use in marketing outside of the application.  Users are not allowed to resell the downloaded business listings.

Vehicle routes are also generated in Map Business Online and may be exported for use in other devices or for routing reference, outside of the application.  Map Business Online is not a fleet tracking tool and should not be used as such.

In general, all these services are included in Map Business Online for the user to use in their business processes. Just don’t try to resell the datasets, routes, or map views. If you have questions about the license agreement or a business idea, please call us to ask questions or discuss the idea.

Value Added Resellers – Offer the tool to your customers as a reseller. Make money on training and consulting. Contact us with further interest in reselling Map Business Online.

Win a $20 Gift Card! Refer a business associate to Map Business Online in exchange for a $20 Amazon Gift Card!

America’s best geo mapping software.

Find out why over 25,000 business users log into www.MapBusinessOnline.com for their business mapping software and advanced sales territory mapping solution. The best replacement for Microsoft MapPoint happens to be the most affordable.  Discover Map Business Online – tools for making maps by map makers.

Contact: Geoffrey Ives geoffives@spatialteq.com or Jason Henderson jhenderson@spatialteq.com

Posted in Business Mapping Software blog post, How to instruction | Tagged , , , | Leave a comment

What’s the Value of Business Mapping Software?

Every business spends money on software programs that support business activities. Companies spend millions on Oracle, SAP, or other ERP systems. CRM systems are somewhat less expensive to license, with costs in the thousands of dollars. Word processing and spreadsheet software licenses for the entire employee team often entail office-wide licensing agreements. As expensive as all these software options may be, their value to a business is well known based on decades of general use.

Less well understood by the general business community is the value of business mapping software.

Read Case Studies of Actual Business Mapping Software Users

Business mapping provides four basic tools that other software services cannot provide:

  • An accurate visual model of the physical world, complete with administrative district layers, world views down to street level detail, and associated demographic data
  • Address Geocoding – the ability to convert address (or Lat/Long) spreadsheets into accurately mapped location points that are tied to tabular data fields
  • Search and draw tools that organize and classify administrative districts into areas of interest, or territories – commonly applied as sales territory mapping
  • The ability to filter and report collated data by geographic elements – by ZIP code, driving distance, drive time, or map object

The value of business mapping is manifest through its unique geographic perspectives that only a map overlaid with location-based business data reveals. A carefully crafted business map can provide an organization with tactical and strategic direction. Business maps offer the structure to communicate company goals, and with established business model used to generate a viable market analysis.


Address Lists vs. Areas of Concentration

A prospect/customer list may contain a thousand names, or it may contain a million names. Regardless of how many names it holds, it’s still just a list. The same customer list geocoded onto a compelling digital map immediately reveals valuable and visual business intelligence. These customer related map visualizations may include:

  • Areas of customer concentrations or density maps where additional sales support may be warranted
  • Customer dearth areas, underserved markets where more sales coverage is required, stat
  • Revenue generation patterns that define the most lucrative areas by city or ZIP code leading to market analysis profiles that will generate new business

Sales Territory Maps Post Progress Toward Goals

Sales territory maps designate areas of accountability by rep. Typically these ZIP code or county maps define where a salesperson will spend their time, focus their sales efforts, and accrue sales against a company goal. Regular reviews of progress toward goal keep a salesperson focused on the right objectives and motivated to increase their compensation. Last time I checked, there is serious value in salespeople achieving goals.

Sales territory maps often expose legacy sales assignments with overlapping coverage areas and redundancy in rep assignments. These overlapping territories are valuable opportunities to improve efficiencies.

Shared territory maps help to inculcate the sales team with skills.  Maps are the perfect backdrop to regular sales meetings where account successes and failures are discussed, policies are reviewed, and winning strategies are discovered, cultivated and shared.

A crucial component to territory progress meetings is the discussion of new opportunities. Hungry and open-minded sales reps often stumble across new markets. These fledgling opportunities will eventually blossom into the industries of tomorrow that constitute most of the company revenue in the future. Mature industries like paper mills, fossil fuels, and hospitals will be supplanted overtime by biomedical, alternative energy, and home-care companies, ad infinitum. IMHO, the value of developing new markets is inestimable.

Strategic Vision

A good place to begin any short-term or long-term strategic plan is with a business map. An accurate description of an existing marketplace will define the baseline business situation for the entire business team.  Sales objectives and business expansion plans may be combined to outline a path forward based on growth potential.  These business plans may include map-based business analysis of several specific types:

  • Market Analysis – An analysis of potential markets based on existing business success.  Seek new ZIP codes or counties that match your business’s best performing demographic profiles
  • Competitor Analysis – Location based depictions of existing competition in critical markets help define the marketplace. Competitor maps allow any business to see what it’s up against. Relevant industry resources for both you and your competitors should be included in competitor analysis. Take into consideration, company branch locations, critical resources, and sales associates’ start-of-day locations
  • Unique Industry Elements – Every industry has its basic elements and some of them may have location components. For instance, the automobile tire business can be described through car model sales, driver registrations by county or ZIP code, automobile tire retail locations, and tire wholesale locations

A business map provides the visualization tools an astute business leader will use to describe both existing business and company growth plans for moving the organization forward. Maps and sales territory images communicate critical elements in a way that most associates will understand immediately. People like looking at maps. Maps are visually pleasing. In this way, a map communicates the underlying business intelligence required to support plans for growth. Just imagine how long it would take associates to grasp a business plan from a spreadsheet.

The Value of the Unexpected

Business mapping software, like it’s more complicated big brother Geographic Information Systems (GIS), often surprises the business user with unexpected business insights that only a geographic perspective can provide.

These surprise map views might improve public safety. For instance, serial robberies viewed geographically can lead to perpetrator apprehension because these views tend to narrow down the field of suspects from practically anyone to someone who lives in area X, drives a blue car, and has worked in the food delivery service. Most police departments access basic GIS services for the purpose of solving crimes.

Known felon home address records overlaid on a digital crime map may reveal possible repeat offenders that must be considered in cases that endanger the public. Such a case occurred in Maine just last year.

Retailers may unexpectedly discover, through a map-based study of traffic patterns, reasons behind a slow-down in business. Consumers may willingly and frequently travel a ten-minute car ride to your store. But adjust that traffic pattern such that the driving time drifts to twenty minutes and sales may plummet. Before and after maps, based on population, income, and drive time may display new patterns in your business.

Successful businesses seeking to expand into new areas will seek map based business analysis to confirm or discover which areas promise to be the most lucrative. Maps overlaid with business data tell stories; valuable stories.

In each of these cases, business maps are adding value to a business process or organization’s analysis. While there may be businesses out there processing data with no location information, it’s a rare occurrence. In general, businesses that are processing location data, data with addresses or geographic coordinates, and they can benefit from the application of business mapping.

There’s significant value in business mapping software. It is a tool for growing sales, expanding markets, and understanding business trends. If your business doesn’t value those capabilities, well, there are other places to work.

_______________________________________________

MapBusinessOnline access has officially transitioned from Web Browser (Adobe Flash Player) access to the Map App download access.

  • Please download the Map App from the website – https://www.mapbusinessonline.com/App-Download.aspx.
  • After installing the Map App, the MapBusinessOnline launch button will be in the Windows’ Start Menu or Mac Application folder. Find the MapBusinessOnline folder in the Start Menu scrollbar. Click the folder’s dropdown arrow and choose the MapBusinessOnline option. You can drag the Icon to the task bar for a quick launch button.
  • All saved maps will be available through your Map Library Folder, the second button in from the left on the Master Toolbar. (Green File Folder icon.)

Map App access to MapBusinessOnline.com provides enhanced features and a better user experience.

The Map App includes the new Map Viewer app for free non-subscriber map sharing.

Value-Added Resellers – Offer the tool to your customers as a reseller. Make money on training and consulting. Contact us with further interest in reselling MapBusinessOnline.

Find out why over 25,000 business users log into www.MapBusinessOnline.com for their business mapping software and advanced sales territory mapping solution. The best replacement for Microsoft MapPoint happens to be the most affordable.

Contact: Geoffrey Ives geoffives@spatialteq.com or Jason Henderson jhenderson@spatialteq.com


Posted in Business Mapping Software blog post, Sales and marketing | Tagged , , | Leave a comment

Achieving Collaborative Team Map Editing with Map Lock

Map Business Online Team Edition is all about enabling shared map editing. Team subscriptions start at quantities of five licenses and provide the team administrator with tools to share subscription access and create groups of users with preset privileges: View only, map editor, data editor, or both map and data editing privileges.

Sharing maps for collaborative editing in Map Business Online is called Private Sharing. Public sharing means generating interactive URL’s that are not editable. Read more here. Private sharing is for users who desire to share business maps with each other for collaborative editing.

Any two full-year subscribers to Map Business Online can share maps with each other for editing. To be clear, Map Business Online Team Editions provide the ability to set up groups of users and to share a subscription based on volume purchases.

Opening a Shared Map

When Map Business Online Team Edition subscribers share maps for collaborative editing, map editing collaborators follow the below noted steps to access and edit maps. Those team members, or individual users, will retrieve that shared map in their “Maps Shared with Me” folder; an option within the Open Map & Manage Save Maps dialogue.

To access and edit a Map Shared with You:

1.       Go to Map Business Online. Make sure you’ve logged in

2.       Click the ‘Open map’ icon on the master toolbar. Map Business Online will prompt you to save your current map if necessary.

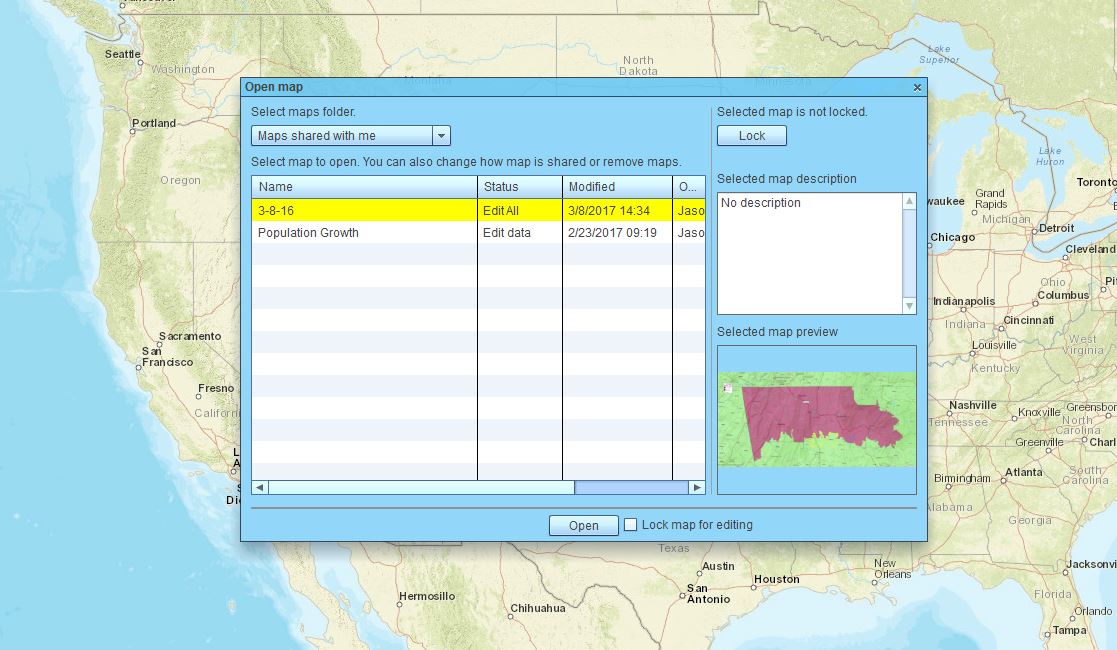
3.       The ‘Open map’ dialog will pop up with a list of your maps that exist on the Map Business Online server. In the maps folder, follow the drop down to and select the ‘Maps shared with me’ folder.  Select the map you want to edit. A dialogue will open on the left side of the selection panel. If the creator of the shared map has turned on Map Lock for editing protection, then a corresponding checkbox will appear below the selection panel indicating the map is locked. You can choose to maintain Map Lock or release it by clicking the Map Lock button in the upper right corner on or off.

Map Lock is initiated to allow one person at a time to edit shared maps. Click the Map Lock button in the upper right corner to set the map for view only or to protect the map while you conduct editing.

Finally, click ‘Open’ to open to edit or view the shared map.

Map Lock – Locking the Map for Editing

Map lock is a gatekeeping tool to control map editing and prevent data overrides. Think of it as an off and on switch controllable by any of the map contributors. When Map Lock is turned on, all your edits are protected from being overwritten by other map collaborators while you work.

When the original Map Creator saves their business map, they decide whether or not to include Map Lock in their shared map process.  Once they include it, the Maps Shared with You will include it as an option for editing protection. 

After a collaborator selects the targeted map in the Maps Shared with Me list, he or she may choose to leave Map Lock on or to turn it off.  If you are doing some serious editing and you want to make sure your edits are saved from override by others – leave Map Lock on.

If you are one of a team of map editors, we recommend you leave Map Lock on. If you tend to walk away from your desk for long periods of time, neglecting the workloads of others and are still included on an editing team – the Map Business online team administrator will be able to unlock your map for other users to access.

If your map is not available for editing or if someone else is editing the map, the shared map will show a Red “View Only” indicator next to the map title at the top of the screen.

Editing Shared Maps

Access your map from the Maps Shared with Me folder. Make sure you are not in View Only mode (check map title area.)  A View Only status could be the result of an incorrect privilege setting by the map originator or it could be a failure to adjust Map Lock in the Open Map Dialogue.

With Map Lock properly adjusted, begin you map edits. A map and data editor will be able to add map objects, adjust territories, import data, and color code symbols and map layer fills.

Save Your Map Edits!

Once you’ve completed your map edits make sure to save your map and immediately exit the shared map. The Save Map dialogue will present an option to release the shared map from Map Lock, so others may edit the map.  Uncheck Map Lock at the bottom of the shared map dialogue.

Collaboration means others will be editing your map.  You’ll want to get in the habit of exiting a shared map as soon as your edits are complete.  Map hogs don’t get Christmas cards. Don’t be a map hog.

Seriously, shared map editing means you share the responsibility for everyone’s map work. By saving and exiting promptly you allow others to conduct edits, and you allow the map originator unfettered access to your adjustments for review.

Map Business Online users use collaborative map editing to:

Win a $20 Gift Card! Refer a business associate to Map Business Online in exchange for a $20 Amazon Gift Card!

America’s best geo mapping software.

Find out why over 25,000 business users log into www.MapBusinessOnline.com for their business mapping software and advanced sales territory mapping solution. The best replacement for Microsoft MapPoint happens to be the most affordable.  Discover Map Business Online – tools for making maps by map makers.

Contact: Geoffrey Ives geoffives@spatialteq.com or Jason Henderson jhenderson@spatialteq.com


Posted in Business Mapping Software blog post, How to instruction | Tagged , | Leave a comment

Replace MapPoint Now! Recommended by a Former User

It was just an average business mapping Thursday at Map Business Online.  Chat’s started rolling in on our website chat system.  One of the first chats of the day asked this question with a comment:

“Is this software easy to use? I miss MapPoint.” 

What was unusual about this inquiry was that it so succinctly expressed the frustration and longing many MapPoint users are experiencing today.  They had a business mapping tool that served them well for a decade or more, and suddenly Microsoft canceled MapPoint and now the diminishing MapPoint user-base mapping world is filled with errors and an unknown future.

Understandably these MapPoint users feel stuck. Any new business software may require approvals to purchase. They may have to get buy-off from an assortment of internal users. Replacing MapPoint requires vetting various vendors and dealing with creepy salespeople.  It’s a whole thing they need to resolve, and business still needs to get done. Who has the time?

Here at Map Business Online, we answer these questions every day, assuring potential clients that Map Business Online is easy-to-use, and in fact, is even better than MapPoint.  Still, every software has a learning curve and many users may not feel up to the change.

With all the cloud-based options out there, it’s a challenge to say the exact right thing to any given MapPoint user and convince them that your tool is the one they need; that thousands of Map Business Online users must be on to something.

Then, later that very same day, we got this beautiful email below from a new ex-MapPoint customer who recently converted to Map Business Online. I quote:

“I just wanted to say thank you for this amazing mapping tool! I’ve tried a number of sales territory map solutions and this is by far the best. I just (finally!) switched over from MapPoint and this is so much better, I wish I had switched sooner. Your videos and blog are also really helpful, though most things I have figured out on my own. It looks like I also have a lot more to discover as I explore the data visualization tools. Thanks again!”

– Andrea Harrington, Business Analyst,

Wow. This wonderful, and well-written email thrilled our whole team for a bunch of reasons:

1.      Our development team has been competing with MapPoint for decades, even prior to Map Business Online.  They’ve spent years fine-tuning a product that provides easier and more effective solutions to business mapping challenges than MapPoint. Our goal is to produce and publish an “Amazing mapping tool.”

2.      Probably our best effort at replacing MapPoint is out territory mapping functionality.  It is intuitive and flexible. You can build maps by clicking ZIP codes or by selecting them with a polygon tool.  Or you can import a list of ZIP code or counties and create a territory that way. Territory management in Map Business Online includes the ability to add demographic data to your analysis.

3.      Delaying that switch over from MapPoint is understandable from the perspective of change is a pain in the neck. But dealing with obsolete ZIP codes and demographic data must be awful. It’s like continuing to eat from that huge, stale box of classic Cheerios when your daughter’s fresh box of Honey Nut Cheerios is just sitting there on the table, staring at you.

4.      We create all of our videos and blogs for the sole purpose of assisting with the business mapping process and any Map Business Online learning curve a user might incur. We’re always open to suggestions on better ways to demonstrate how our tools work, and new subjects to write blogs and create videos about.

5.      We believe 90% of the folks who use Map Business Online require no personal support to get up and running. We only hear from a handful of customers. Not that there aren’t tricky aspects to business mapping in general. For instance, point versus boundary ZIP codes

6.      Map Business Online has a growing list of features and functionality beyond territory mapping and business intelligence visualization. We recently added access to business listings, and just this month plan to release Map Business Online Pro – map-based market analysis with drive time searches around multiple centers, and much more.


We also like to remind MapPoint users that Map Business Online is a cloud-service requiring an Internet connection, but you can download a PC or Mac application here and avoid the web browser-based software. The apps are like MapPoint desktop installation but require an Internet connection.

So, after a great Thursday last, let’s encourage all those MapPoint users out there to take the time to replace MapPoint and join the rest of the up-to-date world of business mapping. It shouldn’t take an act of Congress.

Wait. I better check the news, in case that’s a bad metaphor today. 

Win a $20 Gift Card! Refer a business associate to Map Business Online in exchange for a $20 Amazon Gift Card!

America’s best geo mapping software.

Find out why over 25,000 business users log into www.MapBusinessOnline.com for their business mapping software and advanced sales territory mapping solution. The best replacement for Microsoft MapPoint happens to be the most affordable.  Discover Map Business Online – tools for making maps by map makers.

Contact: Geoffrey Ives geoffives@spatialteq.com or Jason Henderson jhenderson@spatialteq.com


Posted in Business Mapping Software blog post | Tagged , , | Leave a comment

Tips for First Times Users of Map Business Online

First time user to Map Business Online?  Do the below actions first, to become familiar with our business mapping tool:

Log into Map Business Online by clicking Map on the Www.MapBusinessOnline.com toolbar.  Allow Flash Player to load, Flash will be gone eventually. You can always download the Windows or Mac Application to avoid Flash Player.  Apps and web browser access – its all included with the Free Trial or the Subscription.

Map & Data

When your Map Business Online map shows up, notice the map view. That’s our street Map Layer. You’ll see it checked on in Map & Data.  Map & Data, that light blue check-list hovering over your map,  has many map look and feel controls embedded.

In Map & Data uncheck the Streets box. You’ll see nothing but blue. Now, say out loud, “Let there be map!” and check the box back on. Boom! Now there’s a map.  That’s your Map background control.

You’ll notice if you hover your mouse over the Street layer and click the Edit Gear, you have background map options for your map. In the drop-down, try Satellite and Topographic views. After you’ve played with these options, go back to Streets.

Now, still using Map & Data, check on the State layer checkbox. You’ll see states populate the map.  The State Layer also has editing features. You’ll see them there in front of you, or click the Edit Gear to get to the editing panel. within that Editing Panel view:

  • You can adjust line or boundary colors thickness
  • Uncheck the fill button to see the map clearly (I prefer this setting for states) but you could simply adjust the transparency scroll bar to adjust the color opacity
  • Click Color Code Map Layer to consider color shading based on Demographics. Go ahead, try some of those schemes. There’s a button on the master toolbar (three puzzle pieces), right in the middle, labeled Color Code Map. It does the exact same thing. Now you’re getting it
  • The rest of the stuff in that State Layer Edit Panel is a little more advanced. Play with them if you want but I suggest you close the edit panel now and move on

All of the other map layers listed in Map & Data are editable in the same way as the State layer – ZIP codes, Counties, or any additional layers available through the Add Map Layer button on the master toolbar.

Add Business Data to Map Business Online

Every map user, at some point, will want to add business data by address to Map Business Online. Read this helpful blog about adding data points into Map Business Online. That gets you familiar with manually dropping in location points via the address bar or the draw tools. Then read about importing spreadsheets of location data.

That’s a lot of information adding location data, and it gets you familiar with the major features of Map Business Online. Now take a breath. Watch a funny pet video.

Map Navigation

Here are a few quick tips about map navigation:

  • In the upper right corner you can use the vertical Scroll Bar to Zoom in and out. Notice the map layer labels as you scroll in and out – County, City, Blocks. These reference zoom levels may come in handy at times
  • Click the USA Flag to Zoom out to the national map view or the World icon to Zoom way out
  • At the bottom of the Scroll Bar panel is the Magnifying Glass zoom tool. Use it to drag rectangles on the map that Zoom into areas of interest
  • Finally – notice the blue back and forward arrows just under the scroll bar. Very handy. At the top of the application, above the Master toolbar are two more Blue Arrows for undo and redo

Building a Territory

Alright, let’s just do this.  Many users come to Map Business Online for Sales Territory Mapping.

Turn on the Zip code layer. In the Search Tool drop down, 8 buttons in from the right, drop down and select the Polygon Search Tool. As you select the button, it turns green.

  • Click on the map and run your line across a series of ZIP codes. Lift your finger and press again to make a turn. Bring it back to the tiny circle at the beginning of the polygon.
  • Budda-bing! Up pops a dialogue asking you to choose your map layer – Choose ZIP5 codes
  • Budda-bang! Name it and click Create
  • Behold your Territory in the Data Window. Your specific selection of ZIP codes are listed here

You could export the list of boundary territories by clicking the right-most button on the Data Window toolbar.  Know your Data Window.

These tips will get you started using Map Business Online.  For a great list of helpful videos read this blog that I posted a few weeks ago – the Top Ten Map Business Online Help Videos.

And here’s another key blog about the subject of Extracting Data from within Map Business Online.

By following the suggestions on this blog, new users will become familiar with the Map Business Online user interface and many of the major features of the tool.

Win a $20 Gift Card! Refer a business associate to Map Business Online in exchange for a $20 Amazon Gift Card!

America’s best geo mapping software.

Find out why over 25,000 business users log into www.MapBusinessOnline.com for their business mapping software and advanced sales territory mapping solution. The best replacement for Microsoft MapPoint happens to be the most affordable.  Discover Map Business Online – tools for making maps by map makers.

Contact: Geoffrey Ives geoffives@spatialteq.com or Jason Henderson jhenderson@spatialteq.com


Posted in Business Mapping Software blog post, How to instruction | Tagged , , | Leave a comment

Two Popular Data Extractions from Map Business Online

Extracting data from a business map shouldn’t be difficult. If it is, call and complain. In Map Business Online, downloadable data is generally viewed in the Data Window. The Data Window is a tabular view of data – your imported business data and our shared geographic map layers and demographic data. They all live happily together in the Data Window.

Open the Data Window by clicking the Spreadsheet icon on the master toolbar in Map Business Online.

Think of the Data Window as your map-based spreadsheet. Within the Data Window are many functions, including:

  • The ability to sort data columns – Click the header of any column to shift the sort arrangement
  • The ability to filter data – Click the Funnel icon on the Data Widow toolbar to filter data column records by modifiers. Filter sales records by dollar volume or customer addresses by sales rep. modifiers include >, <, =, contains – all that good query enhancement stuff
  • The ability to select from a dropdown any map layer or data layer from the business map. View ZIP codes, imported data, or marketing lists
  • The ability to add relevant demographic data or imported business data to your map analysis using the More Data tab
  • The ability to manage, edit or delete territory alignment and territory analysis
  • The ability to extract ZIP codes from an area of interest or a territory
  • The ability to total data columns
  • The ability to copy and paste data rows into third-party applications
  • The ability to filter map and data views on by map view
  • The ability to extract data out of Map Business Online as a . CSV file

It is the extraction of imported business data or included MBO data that I am interested in discussing in this blog.

Data Extraction

Map Business Online users extract data from the application in a variety of ways. These data results save as marketing lists or query results exported as a CSV file using the right-most button on the Data Window Toolbar. Sometimes the application is a search/filter tool for querying imported location-based data. Read more about filtering in Map Business Online.

A popular data extraction action in Map Business Online is a ZIP code list defined by an area of interest. That area could be a selected county, a group of counties, a territory, or simply a map object, like a circle or a polygon.

ZIP code extraction is impacted by the fact that ZIP codes come in two flavors:

  • Boundary ZIP Codes – Geographic areas defined by a five-digit ZIP code. What most of us think of as ZIP codes
  • Point ZIP Codes – Large facilities that are a single drop-off point for mail – Hospitals, Universities, etc.

Map Business Online users have two possible paths for ZIP code extraction. One exports all types of ZIP codes: point and boundary ZIPs. The other is more basic and extracts boundary ZIP codes. Any sales organization tracking sales will want to extract the Point & Boundary ZIP codes to capture all records

Extracting ZIP Codes by Map Object (Polygon or Circle)

To export just the Boundary ZIP Codes associated with a map object, follow these steps:

  1. Draw a Map Object and note the Search Data pop-up menu.
  2. Select the ZIP5 codes layer (visible or invisible).
  3. Name the ZIP Code list and click Create. The Data Window Opens.
  4. Export using the Data Window Toolbar’s Export button on the right.

Video: Extract Boundary ZIP Codes by Map Object (Polygon or Circle)

To export ALL point and boundary ZIP Codes within a map object, follow these steps:

  1. Draw a Map Object and note the Search Data pop-up menu.
  2. Select the ZIP5 codes layer (visible or invisible).
  3. Name the ZIP Code list and click Create. The Data Window opens.
  4. Click the Export button – far right on Data window Toolbar.
  5. After you click the Export button, you’ll see options to a.) Export by territory, and b.) Include Point ZIPs.
  6. Click Next, and then Save the exported file.

To Export All Territories with all ZIP Codes

  1. In the Data Window, select the ZIP code layer.
  2. Click the Export button – far right on Data window Toolbar.
  3. After you click the Export button, you’ll see options to a.) Export by territory, and b.) Include Point ZIPs.
  4. Click Next, and then Save the exported file.

Demographic Data Extraction

Another popular data extraction exercise among the Map Business Online user base is the demographic data pull. The easiest way to achieve a demographic data extraction is to select an area of interest or a map object (circle, polygon,  a blob) and click the sideways M on the mini-toolbar associated with the selected region.  That’s the summary button.

Clicking the summary button opens a dialogue that defaults to our Demographic Library of data layers. Select up to ten categories for your pull.  Move those layers to the right panel, click Next, and save your data.

The Data Window’s More Data button will allow more demographic layering and more filtering and query options when conducting territory analysis. Once you’ve derived your demographic results, export by clicking the right-hand button on the Data Window toolbar.

Data extraction in Map Business Online is easy.  And it beats tooth extraction, that’s for sure.

_______________________________________________

Find out why over 25,000 business users log into www.MapBusinessOnline.com for their business mapping software and advanced sales territory mapping solution. The best replacement for Microsoft MapPoint happens to be the most affordable.

To access MapBusinessOnline, please register and then download the Map App from the website – https://www.mapbusinessonline.com/App-Download.aspx.

After installing the Map App, the MapBusinessOnline launch button will be in the Windows Start Menu or Mac Application folder. Find the MapBusinessOnline folder in the Start Menu scrollbar. Click the folder’s dropdown arrow and choose the MapBusinessOnline option.

The Map App includes the Map Viewer app for free non-subscriber map sharing.

Please read customer reviews or review us at Capterra or g2crowd.

Contact: Geoffrey Ives geoffives@spatialteq.com or Jason Henderson jhenderson@spatialteq.com

Posted in Business Mapping Software blog post, How to instruction | Tagged , , | Leave a comment