Remember, George Washington was a map surveyor. Oh. Snap.
We have several ways to approach the city by population challenge. The first approach involves importing a list of City Points from Map Business Online’s included Public Data library. The second approach uses our City Limits layer available to all full-year subscribers of Map Business Online.
Public Data, City Points
For general Map Business Online subscribers, you can click the Plot Data Button and choose the lower option to Select Data Already Uploaded, in the drop-down choose Public Data. Then select the Cites and Towns option and import that data which will place 6,715 cities on the map as points.
The Data Window automatically opens and shows you the Cities dataset in a tabular data view. Notice the Population column included in the data. We’re going to filter the City layer based on the Population column.
Click the Filter Button on the Data Window Toolbar.
In the data selector, where it says Capital, drop down to select Population
In the top Modifier drop down select (>) to indicate “Greater Than”
In the far-right box type in 10,000 for your population guide
Click the Filter button in the lower right
Your Data Window view now shows only 2,903 city records of the total 6,715 cities. You’ll find that noted in the lower left. You can export that list by creating a Marketing List (Colored Arrows button on the Data Window toolbar) to save by name. Then use the Export button to the far right of the Data Window toolbar.
To view only those records on the map, Check the Filter Data on the Map button on the upper left-hand corner of the Data Window. Feel free to adjust symbol colors, size or even color code those records by population using the Three Colored Cannon Ball icon on the Master Toolbar.
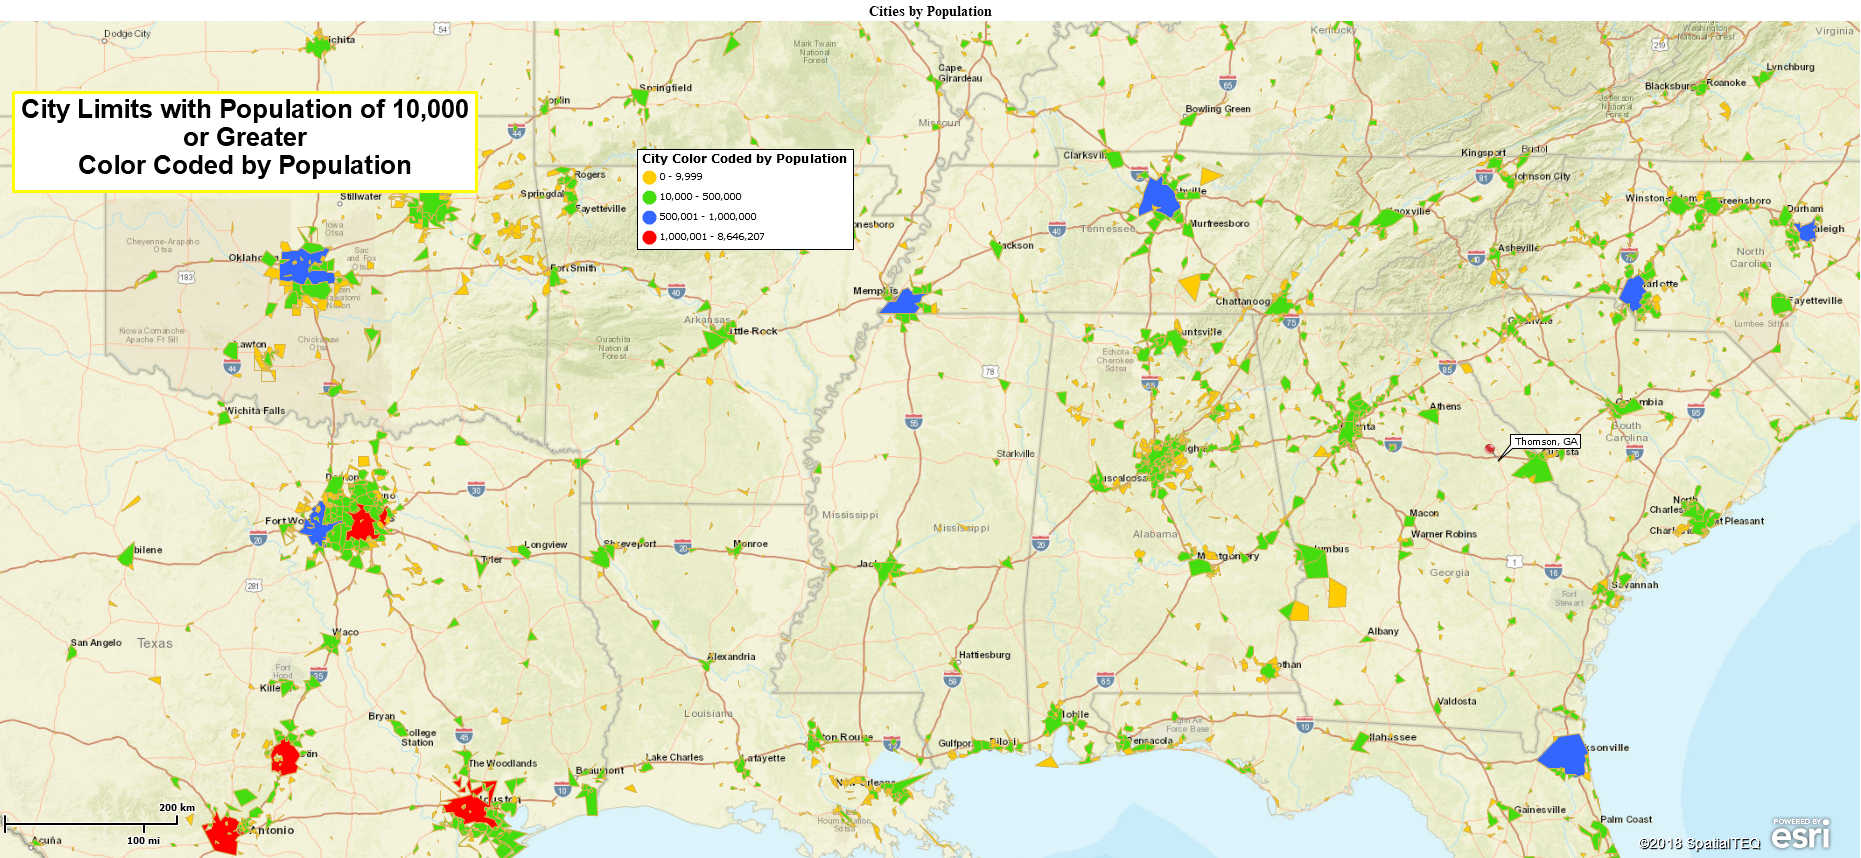
Filtering City Limits Data
For full-year subscribers you do have the Add Map Layers button on the master toolbar that includes premium layers like City Limits. Click the Blue Earth icon and add the City Limits layer to your map. It will now appear as a checked-on option in the Manage Map & Data box and the city boundaries will show on your map. You will see larger cities at the Nationwide zoom level, and you’ll expose smaller towns as you zoom in.
Open the Data Window and choose the City Limits Layer. You’ll see the City Limits dataset in tabular form. We now need to add population to this dataset.
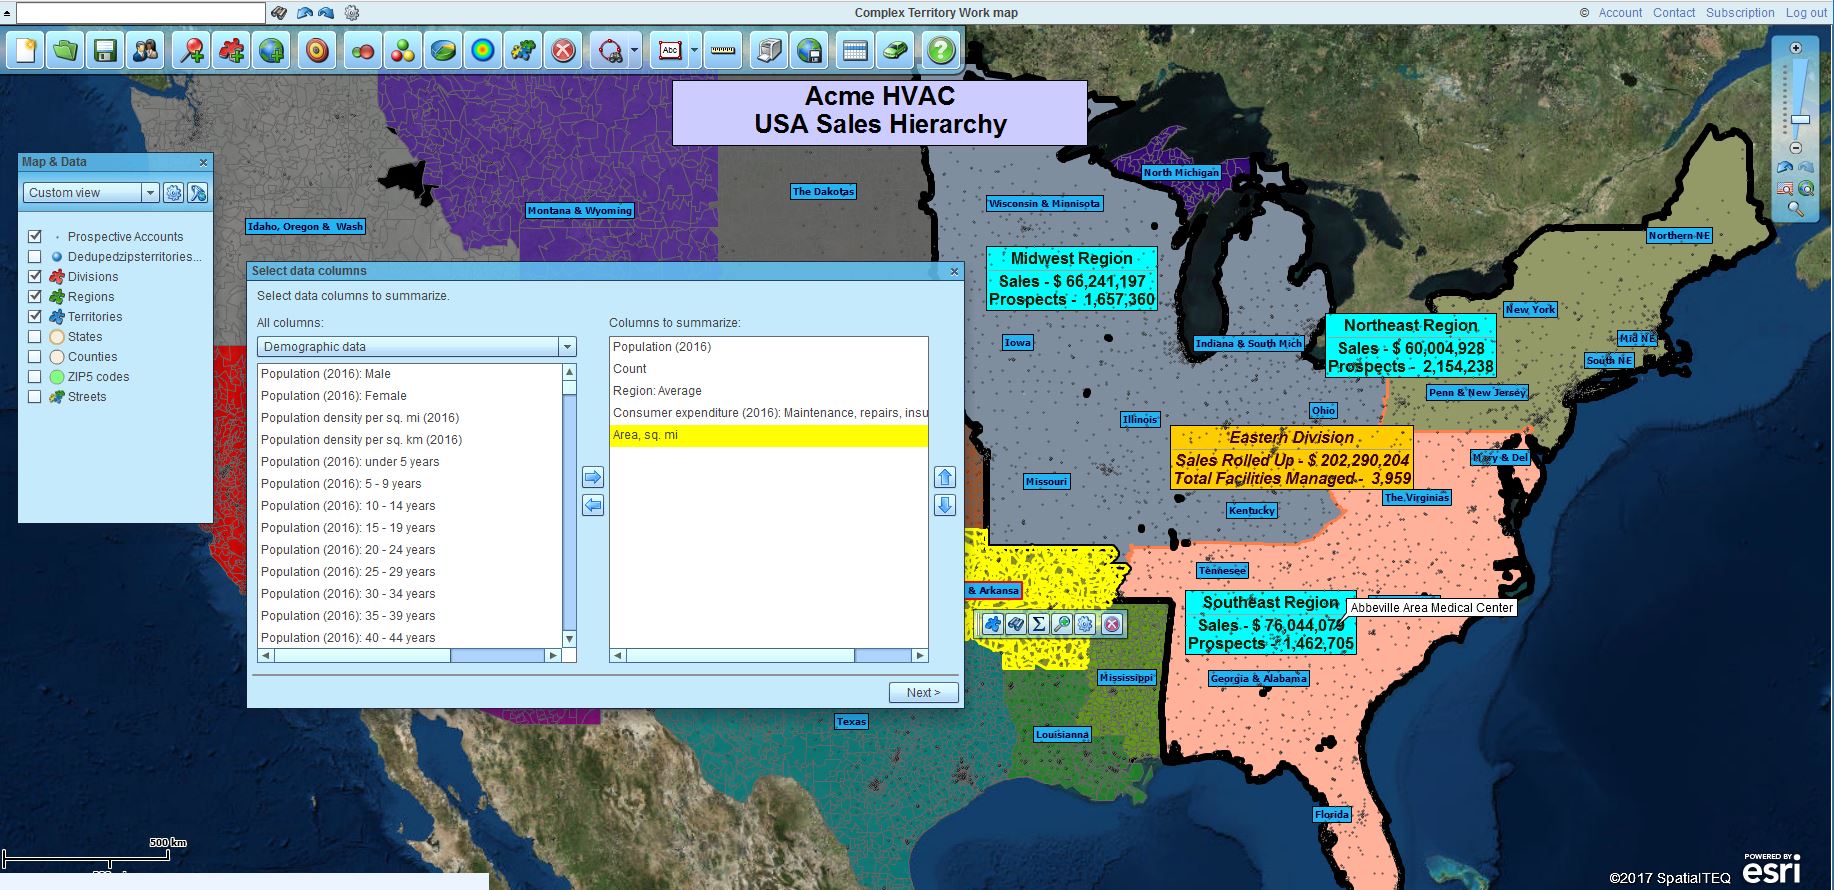
In the Data Window view, with City Limits selected, click the More Data option in the lower right
In the dialogue box on the left, drop down to select General, and then below that choose Demographic Data, and then select Population 2017 (2017 data is projection – you could select 2015 data for Census actuals.) Using your cursor select and move the population subject to the right side.
Click Set Data Columns. Now population has been added to your city limits layer.
Click your Filter button again, you will see Demographic Data already and population selected. Adjust the modifier section to show (>) greater than, and fill in the number target of 10,000. Press the Filter button
In the upper left-hand corner once again check the Filter Data on the Map box to view only the cities with 10,000 people or more on the map view
Congratulations, you are an official filtering wizard using Map Business Online. Go forth and filterfy. That’s a thing, right?
Click the contact us button to request help or ask us some questions.
Find out why over 25,000 business users log into www.MapBusinessOnline.com for their business mapping software and advanced sales territory mapping solution.
Contact: Geoffrey Ives geoffives@spatialteq.com or Jason Henderson jhenderson@spatialteq.com (800) 425-9035
Find out why over 25,000 business users log into www.MapBusinessOnline.com for their business mapping software and advanced sales territory mapping solution.
Contact: Geoffrey Ives geoffives@spatialteq.com or Jason Henderson jhenderson@spatialteq.com (800) 425-9035
Your boss just informed you that you will be using MapBusinessOnline to build a customer visualization map of the company business. It’s Monday and you have until Wednesday to get that map on his laptop for a business presentation he’s got scheduled for Thursday.
For some of you, your boss may have specified more specific aspects of his required map, for others he just expects you to know what he wants. Either way, how do you build your first business map?
Where Do I Start?
Make sure you have a registered account at the Map Business Online website. The FREE trial will allow you to build and save two maps and import up to 1,000 location records. If you think that’s good enough, give your first map a whirl. Remember FREE trial printouts will have a watermark that goes away with a paid subscription, but the interactive web map sharing will be there for a FREE trial account.
We recommend signing up for a full year subscription at $500.00 per user per year (for the USA or Canada.). You’ll use your email address to register and to login.
Next download the Map App. The Map App includes a button icon (Windows Start Menu or Mac Applications folder) to launch the map application. Login with your email and password. (For more on the Map App see the bold text at the bottom of this article.)
As Map Business Online takes a few moments to start and get the application ready for business mapping. A first-time user of Map Business Online will find the application starts up leaving you at the New Map option. Choose Create New Map using the Default view.
USA subscribers will start their first map as a basic USA wide street map. There should be a Manage Map & Data blue box open on the left of your screen. This box lets you turn layers off and on and by clicking the each layers edit gear you can adjust the transparency, color, border thickness, and labels associated with each map layer. Think ZIP code look and feel, but manage Map & Data also controls counties, states and map background.
If you lose that Blue Manage Map & Data box, fear not. Click the Gray and Blue arrow button located on the Left side of your map right in the middle of the left side panel.
Where did Map and Data go?
Import Your Customer Data
Most new Map Business Online users jump right to importing their business data before they tweak map layers, and because your boss asked you to build a customer visualization map, we’ll do that too.
Click the Dataset button in the Adding to Map section of the Master Toolbar, located five buttons in from the left side. The Dataset button icon is a red map tack with a green plus sign. Browse to where your customer data is located, in Excel, CSV or any standard spreadsheet data file format.
Your imported data should be arranged in sensible columns with headers:
Business Name
Address
City
State
ZIP code
2017 Sales
Rick & Nance Hair Salon
19 Norwood Ave
Rockport
MA
01966
$243
Bobby Orlando Salon
88 Main Street
Rockport
MA
01966
$239
Walter Julian Doo’s
74 Main Street
Rockport
MA
01966
$241
Select your data source and click Next.
Select the desired Sheet in your spreadsheet
Make sure the correct columns from your data are assigned to the proper addressing drop downs. Usually this is a simple double-check, but we sometimes assign weird column headings which can confuse a mapping tool looking for words like ZIP or State, or something close
In the final dialogue-box you’ll find options for labeling. Choose columns in your data that make sense for your on-map Callout tags. Fill up to five flexible fields with information in addition to addressing. Then click Plot.
The Data Window will automatically pop-up showing your data in a MapBusinessOnline tabular sheet. You’ll see a column on the Data Window left side with colored dots that displays the level of accuracy in your geocoding. Green is great, Yellow is good, and a Red X means it didn’t geocode at all.
You map will now display colored dots symbols at your address locations.
If you geocoded by ZIP code only, there will be dots in the middle of ZIP codes
If you have duplicated addresses, symbols will be stacked and when selected a list of Named options will appear for selection
To select another symbol, in the Data Window view make sure your data is selected in the data drop down, then move to the right of the drop down and click the down arrow next to the symbol noted there. You’ll find a whole library of options for symbols. You can also reach symbol options from Manage Map and Data. Hover over the layer choose the edit gear and see the symbol selector under the General Tab.
Color Code Your Data?
MapBusinessOnline will present an option to color code your data layer immediately. You are welcome to do that. You can say no for now and later choose one of the color code options on the Master Tool Bar. Usually that would be the Color Code with symbols option – three colored balls icon. Try it. The dialogue will walk you through the process with range and symbol options. You can easily click that button again to readjust the color scheme.
Map Navigation
Now that your business data is on the map your might want to understand how to quickly get around on the map. Place your mouse cursor anywhere on the map and grab the map and move it around. You can also double-click to Zoom In. But once a Map Layer, like ZIP codes, is turned on the double clicking selects objects instead of zooming.
Use the Zoom Tools located in the upper right corner of the map view. Push the scroll bar up and down to Zoom In and Out. Use the Back and Forward arrows to Undo and Redo moves on the map. Click the USA flag to Zoom to the USA view. And use that Magnifying Glass button on the bottom of the Scroll Tools to turn your Cursor into a rectangle zoom tool. Click it on and create a rectangle on your map to zoom into that area.
Use the Address Bar in the upper left-hand corner of the map view to key in an address, press the Binoculars and Zoom to that address. Key in an address this way: 19 Norwood Ave, Rockport, MA, 01966. Keying in a ZIP code will let you Zoom to that ZIP code.
Adjust the Background Map
Now go back to Manage Map and Data. The bottom check box controls the background. It probably says Streets right now. Try the different options available. Or try no background map at all. Think about what your boss might prefer.
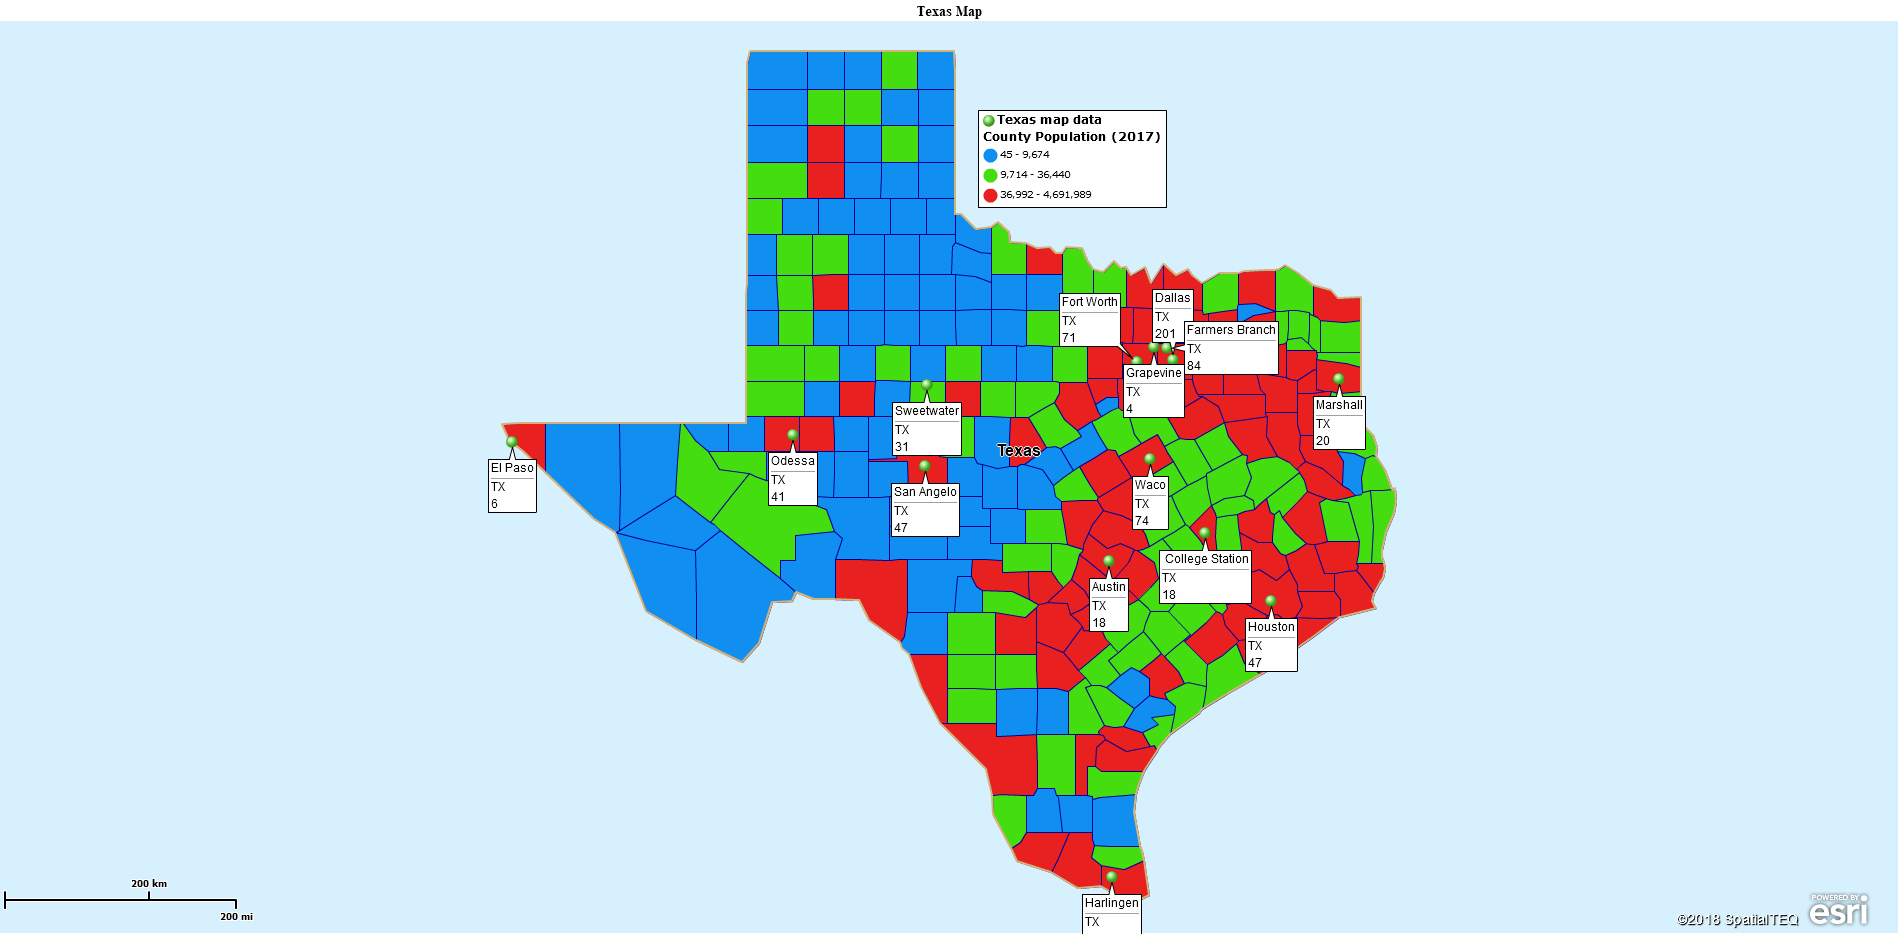
A Quick Texas Map
Save Your Map
With your map more or less started, save your map view by clicking the Save button on the toolbar – it’s three buttons in from the left.
To share a map with your boss, choose the Share Interactive Map button to the right of the Save button. Choose the public share option. Copy the provided web map URL and paste it into an email to your boss. Get some feedback on the map to see if there’s more information desired, or perhaps some editing of the map view.
Your boss may want to do much more with your business map. Remember, with a paid subscription, you can always build multiple maps. Don’t try to solve all the world’s problems with one map. Maps can get cluttered and lose their meaning. But certainly take some notes on your new list of requirements and see what MapBusinessOnline can do to help you get the map you need.
Click the contact us button to request help or ask us some questions.
_______________________________________________
MapBusinessOnline access has officially transitioned from Web Browser (Adobe Flash Player) access to the Map App download access.
After installing the Map App, the MapBusinessOnline launch button will be in the Windows’ Start Menu or Mac Application folder. Find the MapBusinessOnline folder in the Start Menu scrollbar. Click the folder’s dropdown arrow and choose the MapBusinessOnline option. You can drag the icon to the taskbar for a quick launch button.
All saved maps will be available through your Map Library Folder, the second button in from the left on the Master Toolbar. (Green File Folder icon.)
Map App access to MapBusinessOnline.com provides enhanced features and a better user experience.
The Map App includes the new Map Viewer app for free non-subscriber map sharing.
Value-Added Resellers – Offer the tool to your customers as a reseller. Make money on training and consulting. Contact us with further interest in reselling MapBusinessOnline.
If you transported a sales person from an office three decades ago directly into a desk today, they’d feel like they’d walked into a new planet where everyone speaks a foreign language.
“What do you mean my Rolodex is in my computer?” “Who is this stranger asking to ‘join my “professional network?’”
Technology is changing the sales landscape not just every year, but every day. In 2017 alone, more than 700 pieces of new sales tech arrived on the market. Each promises to make our sales teams smarter, better, and more efficiently than ever. And as it turns out, many seem to be working.
With so many new and interesting products available, it can be hard to know what to pay attention to. To help hone things in, here are four of 2018’s most promising tools. These are the sales technologies we predict will transform the way you do business this year.
Every sales team has a rep with an X-factor that launches them to the top of the leaderboard month over month. And every sales manager would do anything to bottle that X-factor up and pass it out to the rest of the team.
But when you ask that top rep what it is they do that closes so many deals, they typically can’t put their finger on it. That’s where conversation intelligence comes in. This AI tool “listens” to the conversations between prospects and reps, analyzes what works and what doesn’t, then turns the results into actionable data. Using that information, you can train your entire team on what the best reps do.
2. Chatbots
Another smart technology that’s reshaping the sales landscape is the chatbot. On any given week, you probably interact with a few — increasingly, without even knowing it.
There are a variety of uses for chatbots in a sales funnel. Perhaps the most significant is in the discovery process. While traditional funnels call for sales development reps to get on the phone with a prospect during discovery, chatbots let AI take over in these early stages. This alone could reshape the structure of many sales teams, saving time and money.
Despite fears from some professionals that an automated interaction could be a turn-off to customers, the data says something different. More than a third of consumers want to see more companies using chatbots and nearly a quarter say it’s their preferred method of contacting businesses.
3. Location Intelligence
Location intelligence, also known as business mapping software, is a method of uploading data and recreating it in a visual map. It can be used to solve for a variety of challenges sales teams face — everything from ensuring territory coverage to fixing supply chain issues to looking for new or expansion territories.
What makes it game-changing is the approach: visualization.
Sales leaders have access to more data than ever before, which can be transformative. Using data, sales professionals can make smarter, faster, more customer-drive decisions, but only if they understand that data first.
The brain processes images in less than 13 milliseconds, and there is evidence that information transmitted visually helps with better pattern recognition and is retained longer than information presented with words alone. Using business mapping, teams can react more quickly to data. This is crucial in a competitive environment where agile decision-making can make a difference in overall revenue.
4. Personalized Video
Email fatigue is very real and very dangerous to sales teams that rely on cold email as a primary form of outreach. Billions of emails are sent every day, and the average person deletes 48 percent of the emails they receive in just five minutes.
Yet email remains, for the foreseeable future, one of the primary methods to reach leads. The key for emerging sales tech isn’t to create new communication channels, but to reinvigorate the old. But how do you stand out in a crowded inbox?
One of the answers may be personalized video. A variety of tools exist that make it simple for reps with no production skills to make personalized videos and attach them to their emails via an integration with their customer relationship management system (CRM). A lead opens the email and the video plays automatically. It’s an eye- and ear-catching way to cut through the clutter.
You could spend your entire work year just exploring the sales technologies on the market without ever getting the time to try one out. Honing in on these four transformative tools will help you focus on the areas where you can make a big difference, right away. Try one (or more!) out in 2018 and see the impact it will have on how you sell.
Taylor Burke is a writer for TechnologyAdvice, covering marketing and sales. She’s passionate about helping brands become more authentic, transparent, and connected with their audiences.
A commonly used business mapping software feature is color shading an administrative district, think ZIP code or county. In Map Business Online we call these jurisdiction areas map layers. These map layer areas include: Census Tracts, city limits, counties, MSA’s, school districts, states, and ZIP codes (5 & 3 digit.)
Map Business Online offers two ways for color shading map layers, like ZIP code mapping, from an imported dataset.
Use the Color Code Map Button (three puzzle piece icon). This process lets you select the map layer you’d like to color code and then asks you to decide on the dataset you’ll use to apply the color shading
Use the Create Territories Button – Import a pre-defined territory or area of interest spreadsheet using the Create Territories button. Your spreadsheet will have a Territory Name Column and columns for ZIP code. (In the case of county) you’d include a County column and State Column)
As most of you know, Map Business Online lets you process color shading from several locations within the application. For instance, the same dialogue for color shading you just used in the Three Puzzle Piece button – Color Code Map – is also found in Manage Map & Data. Hover over the map layer, click the Edit Gear and choose Color Code Map layer.
These various approaches to color shading jurisdictions gives the Map Business Online user multiple options for visualizing territories and areas of interest by imported data, demographic data, or RealDatasets NAICS industry sector data (coming in February 2018).
Examples of why Map Business Online users color shade by map layer or area of interest:
Sales Manager – Color shade by imported sales data to show sales activity by ZIP code or county, answering the question, “Where are my sales?”
Franchise Marketer – Color-code ZIP codes by franchise availability, answering the question, “What franchise areas are available for sale?
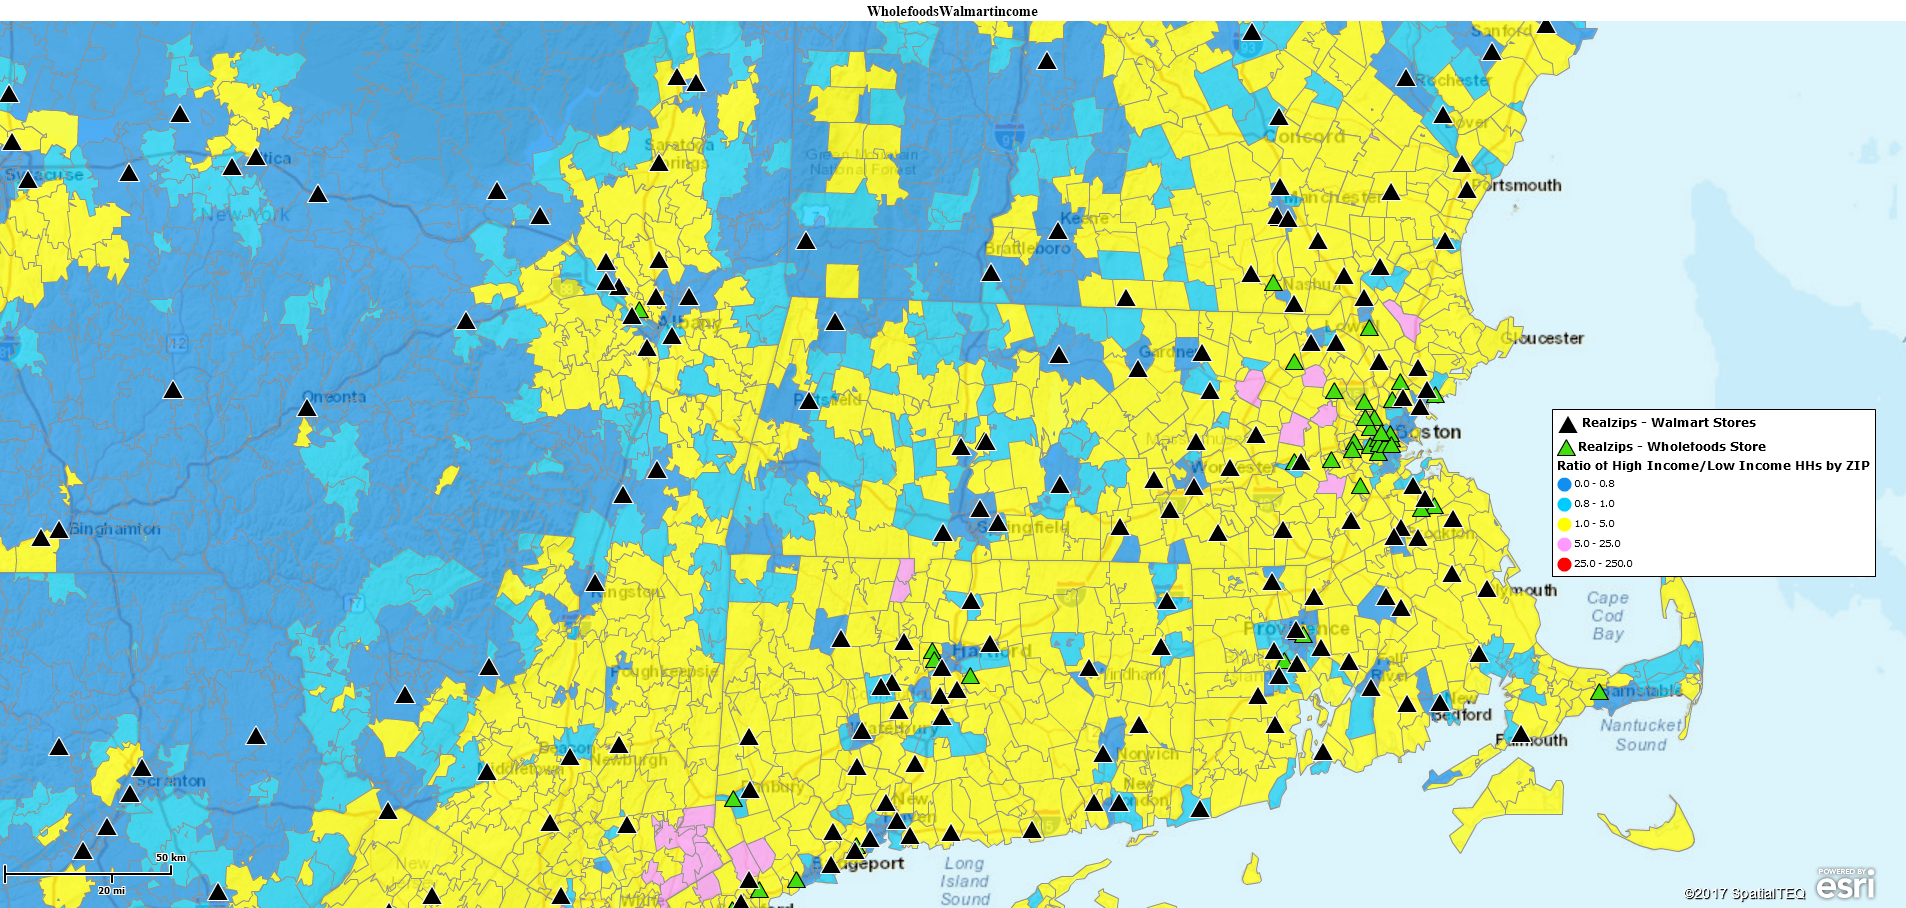
Retail Sales Analyst – Color shade territories by population or house hold income, or a calculated result using multiple demographic layers. This process helps to define successful market area characteristics for profiling.
Political Analyst – Color-code Census tracts by eligible voting population. Helps politicians to determine which districts to gerrymander to insure future instability. (Did I say that out loud?)
County Clerk – Color shade counties to show year-over-year population growth. Helps with tax planning.
Marketing Analyst – Color-code ZIP codes based on periodical and newspaper circular add results by retail store to determine campaign success rates.
Color shading by map layer is some times referred to as heat mapping because the map maker could define the color shading in such a way that hot areas of activity are highlighted. In Map Business Online the Heat Map button is used to create heat maps and does so by accessing numeric data in imported point data layers and converting this data to color graphics denoting activity. Map Business Online heat maps have an adjustable color scheme that looks like a tornado map from weather reports in July.
Regardless of what tools you use in Map Business Online to visualize your business data, try all the different approaches to make sure you find the easiest and most informative views for your business audience. Testing a map view is easy and wicked cheap (very inexpensive.)
Find out why over 25,000 business users log into www.MapBusinessOnline.com for their business mapping software and advanced sales territory mapping solution.
Contact: Geoffrey Ives geoffives@spatialteq.com or Jason Henderson jhenderson@spatialteq.com (800) 425-9035
Every week new users try MapBusinessOnline as a possible routing software replacement for Microsoft MapPoint. MapPoint gave away a lot of routing functionality for $350 per seat. The cancellation of MapPoint means there are many companies around North America that used MapPoint real-time tracking looking for an affordable MapPoint replacement that just isn’t out there for less than $5000.
We’ve enhanced the MapBusinessOnline routing offering to benefit ex-MapPoint users seeking a routing solution. Those business mapping enhancements include:
Increased the stops per route allowance to 150
Fully optimized routing that determines that fastest route from beginning to end
An enhanced Software Development Kit that includes the ability to automate route generation
The ability to generate MapBusinessOnline route files for route sharing and file storage
MapBusinessOnline routing is user friendly. The user imports a list or creates address locations on the map. From there a user may create routes through incremental stop selection or by building spatial queries and filters to create routable lists. There is a convenient one click button to ‘route to all stops from a list’ in the Data Window.
MapBusinessOnline users apply MapBusinessOnline routing to a variety of business operations:
Sales Planning – Managers, administrators and individual sales people alike use the MapBusinessOnline routing tools to plan trips, calculate expenses, set-up call lists and manage their sales territories
Field Services Management – Managing field services and delivery operations requires more than just optimized routing. Manager need to know how much time is expected at each stop and where their mobile teams might be from hour to hour.
Home Care Staffing – In addition to basic route planning and staff scheduling, clinician managers need to accommodate emergency situations and unplanned medical emergencies. Allowable patient information details can be very helpful – like, “The dog doesn’t bite.”
Retail Display Management – Specialists travel from store to store on a schedule setting up and refilling retail displays.
Here is a list of key questions that come up as customers consider MapBusinessOnline routing capabilities:
Does MapBusinessOnline allow the user to route around or avoid specific areas or cities?
You bet. Select the polygon draw tool and zoom into your particular avoid area Create a line drawn barrier around that intersection, exit ramp, or city. In the polygon toolbox select the Set as Route Barrier check box. Now your route will avoid that area.
Does MapBusinessOnline include a repeat stop-off option I can easily insert into my route?
We got you covered. The next time you enter that repeat stop-off address in the route window, hold your mouse cursor over the right side of the stop and chose the Star Icon to make it a favorite route stop option. Your repeat stop will now be available for future route work.
How can I set up a subset list of selected route stop-offs from an overall imported list of addresses? For example, a route bus address list includes all kids on the route, but the driver only stops at one pickup/drop-off location per neighborhood.
Tricky. Make sure your overall bus address list includes a column for designated Stop Locations. Import your overall list. Next, filter the list based on Stop Locations only. Once that view is in the data window, click the Add All Rows from Data Window to Route button.
Can I create multiple route lists? For example, bus routes or service routes that might change by day.
Yes. Import your overall routing system with addresses. Next, filter your overall list of stops in the data window based on a day of the week column and add that list to the Route function using the Add All Rows button. Keep in mind each MapBusinessOnline user is currently limited to one active route view at a time.
Can I use my GPS device to find my real-time location on the MapBusinessOnline map?
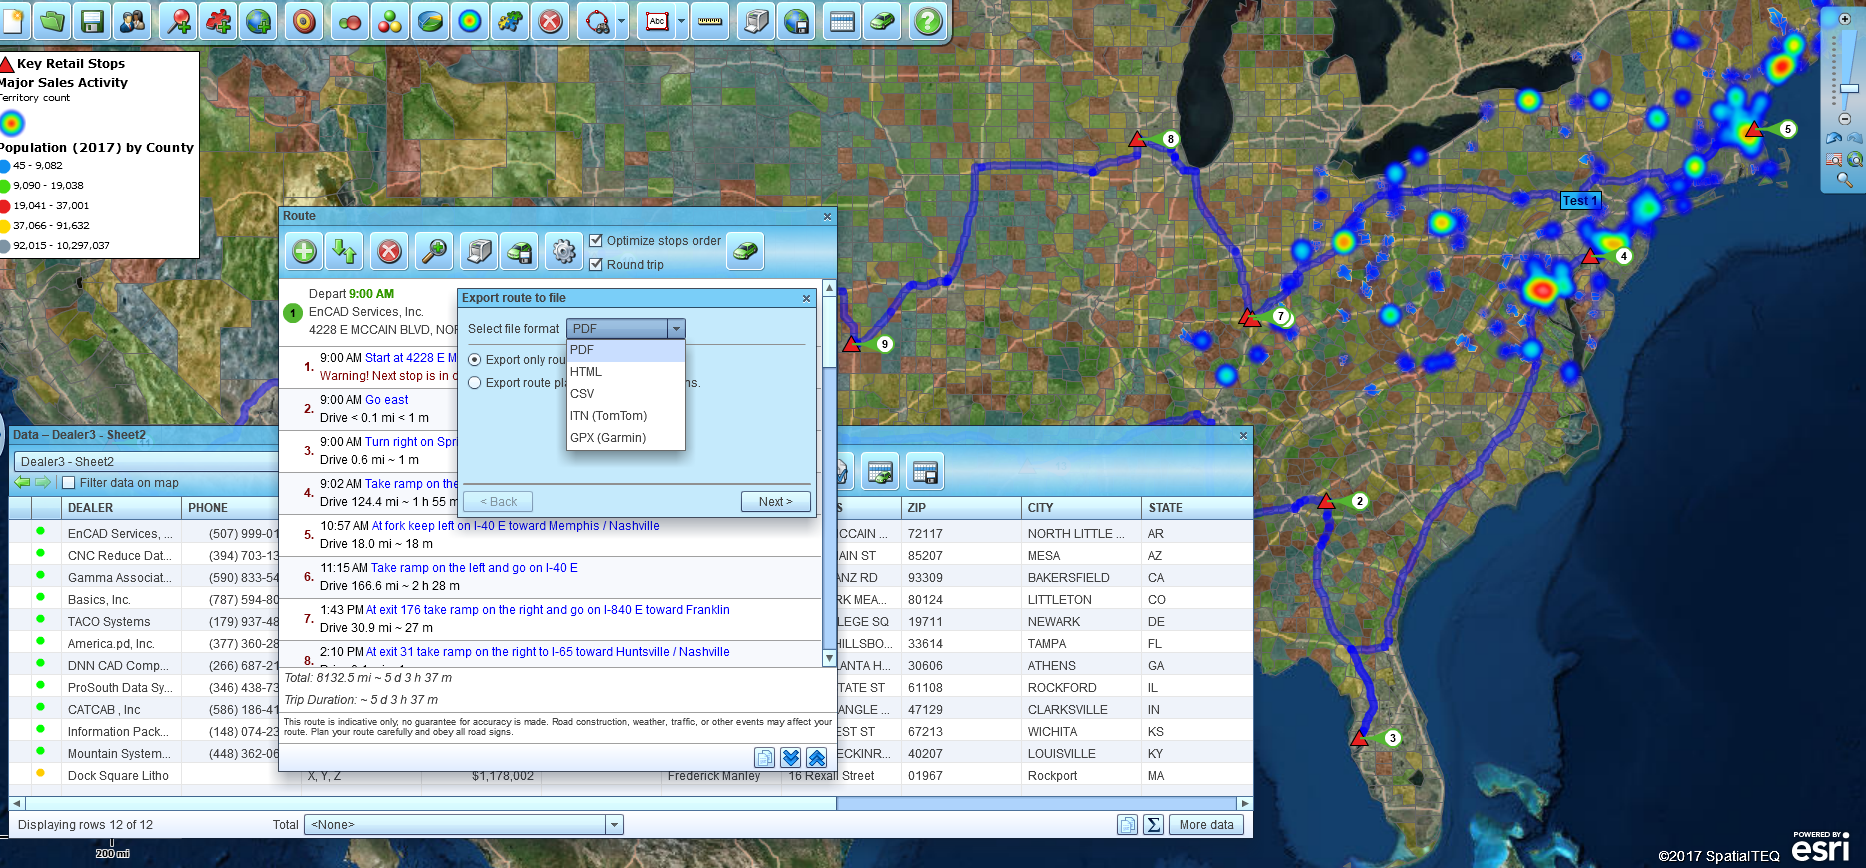
Unfortunately, no. So, use your cell phone map application to get that data. That said, MapBusinessOnline routes can be exported to PND’s and other devices by choosing the file format options that match your device – ITN, GPX, PDF, SCV and HTML.
Does MapBusinessOnline support time windows?
Yes. In the route window you will notice that stop durations are user defined. Any imported data with a column for time durations can be used to establish stop times. The routing window also supports adding a route stop’s time of day. Read more.
What does “Optimized Route” really mean?
MapBusinessOnline routing allows the user to choose an optimized route instead of a standard route based on the data sheet stop order. An optimized route takes into consideration the road network details to provide the fastest or most direct route from start to finish. The application considers turn restrictions, speed limits and road classifications, and historical traffic information, in its calculation.
Does MapBusinessOnline provide time estimates for each route?
After the stops source has been determined and the route button is pressed, MapBusinessOnline returns a set of turn-by-turn directions. At the bottom of the turn-by-turn directions is a route time and distance estimation.
How many addresses can I import into MapBusinessOnline and how many stops are allowed per route?
A MapBusinessOnline Standard subscription ($500.00 per user first year) and team subscriptions allow up to 100,000 records per map. Both subscriptions enable up to 150 stops per route. MapBusinessOnline Pro ($900.00 per user first year) allows up to 250,000 records per map.
Is it true the Map Business Online shared interactive web maps include routing capabilities?
Oh yeah. MapBusinessOnline subscribers are able to share interactive web maps with constituents at really low cost – free for the most part. And your constituents are able to edit shared routes or create their own route. Shared view only maps with routing are accessed using the Map App.
The Wrap Up
MapBusinessOnline is not a fleet tracking software or a GPS navigation tool. But it is a business route management tool. MapBusinessOnline pulls your team’s field routing activities into an overall business or territory map making it possible to connect business system’s address data (like a CRM) to day-to-day planning.
After installing the Map App, the MapBusinessOnline launch button will be in the Windows’ Start Menu or Mac Application folder. Find the MapBusinessOnline folder in the Start Menu scrollbar. Click the folder’s dropdown arrow and choose the MapBusinessOnline option.
The Map App includes the Map Viewer app for free non-subscriber map sharing.
Please read customer reviews or review us at Capterra, or g2crowd
Contact: Geoffrey Ives geoffives@spatialteq.com or Jason Henderson jhenderson@spatialteq.com
Sales goals are achieved through the hard work and expertise of your sales team. Results are driven by the managers who set the goals, and the sales people on the road or on the phone who contact customers, answer questions, and overcome obstacles until the sale is made. So how can business mapping software add value to this process? How can a tool like Map Business Online help a sales team be more efficient at achieving sales objectives?
Online business mapping tools can organize a sales team’s rules, goals, and people geographically. Map visualizations help to define the sales structure, the customer network, and tie the milestones required to achieve goals to areas of accountability. Maps helps sales people understand objectives through the visual presentation of boundaries, reference information, and customer locations.
Cleary Define Sales Accountability
A successful sale department is made up of a team of associates who clearly understand their roles and their responsibilities. Specific customer accounts are typically assigned to sales people and specific geographic areas are often defined as sales territories. Sales goals and objectives for individuals, for each sales territory, and for the overall group, are tied to the overall sales goals. It is after all, in everyone’s best interest that everyone performs well.
Sales territories, as defined by a business mapping tool, anchors the interrelated sales structure in geographic reality. This territory structure serves to tie everyone together as a team focused on clear goals. Clearly defined geographic areas of responsibility and shared monetary goals and results keep a dedicated sales team focused, informed and engaged in growing sales on behalf of the organization.
A business mapping tool easily defines geographic areas of responsibility. ZIP code or country territories become visual reminders of where account responsibilities lie. Sales goals by dollar value are easily aggregated into territory market analysis. Other relevant optimizing elements can be used to define the territory assignments tying the sales structure to industry types, consumer populations, or expendable income levels by area. Demographic data and location-based business analysis will help identify lucrative areas of potential sales growth.
Customer and prospect address lists are imported from active CRM software, on top of sales territories for quick sales rep reference and tactical planning. Regular use of these critical databases in a mapping application serves to underscore the value of a CRM, increasing utilization of that critical sales investment.
Clearly defined areas of account responsibility drive an efficient sales force:
Sales overlap is kept to a minimum if not completely avoided
Sales people easily visualize what their next activity should be
A sales team needs to understand their place in the big company picture. Understanding their company’s sales strategy, product plan, and even a five to ten-year business plan, means the sales team feels both motivated and secure, allowing them to focus on the business at hand.
Business mapping software can provide a beautiful and informative platform for developing and communicating long-term business strategies.
Strategic presentations could begin with product plans and business maps that define the potential market for future product releases. Specific geographic areas targeted for growth, show vision and growth potential motivating your sales team. An informed sales person, aware of long-term product plans and possible business infrastructure enhancements, has a better business story to share with her customer.
Customers crave stories that include long-term plans. Business mapping has a great example of this. Most of my customers are still sore from the loss of Microsoft MapPoint and want to know that their MapPoint replacement will be around in five or even ten years.
Shared Maps Improve Communication
By sharing regular sales result through business maps a sales team works together to analyze both successful and failed strategies; honing their overall sales approach while keeping their focus on annual goals. Business maps are a natural platform for a monthly or quarterly sales review meeting. Maps encourage discussion.
Territory results keep the sales associates aware of their standing. A little competition is healthy. Sales managers must work to keep that competition fair and balanced as products, customers and sales reps come and go. The sales meeting serves as a key element of the sales process where the experience and inexperienced sales people come together, compare notes and discover what works.
Some business mapping includes the ability to set up collaborative team mapping, focusing your best minds on shared and editable maps with a goal towards solving problems and improving metrics. Think, accounting and sales departments working together to lower accounts receivables average collection days.
Shared sales map discussions include:
What new approaches and new markets are working in any territory
The identification and resolution of sales overlap and legacy account distribution
Story telling that builds collaboration and inculcate proper sales behavior
Fewer distractions from the sales process
Day-to-Day Tactics
The business map also serves as the platform for travel and call planning for inside and outside sales reps. Each sales person has access to a map with their territory displayed and their customer and prospect lists available at a click.
Tactics may be up to the individual representative or directed by a manager. Either way, travel and route plans derived from a business map allow reps to substitute new call stops in the event of a cancellation. Travel expenses tend to drop for companies that share sales territory maps. CRM utilization is clearly enhanced as sales reps learn to manage their shifting route appointments. CRM customer databases are easily uploaded to a business map for local storage and regular review.
Shared territory map views prevent duplication of effort due to sales area overlap. Legacy accounts always require decision-making to balance sales workloads, customer preference, and compensation. Business maps enable territory overlap alerts like a ZIP code shaded black to denote overlap. Remember, awareness is halfway to solving a problem.
And inside sales people may not be driving around the countryside but they can still benefit from geographic views of their account lists. Focusing on certain areas helps bring into focus local issues and could help identify new areas of opportunity. Imagine being the lighting company that figures out that new LED lighting systems are being installed in five cannabis grow facilities in Montgomery Country following marijuana legalization referendums. A whole new industry that could replace a fading major legacy account. This kind of thing happens everyday in sales. Here in Maine, biotech and brewery businesses have replaced the once dominant paper industry. Keep those eyes wide open and ears to the railroad track.
By leveraging a reasonable investment in business mapping software businesses of all types will encourage sales growth and improve profitability through increased sales, lowered expenses, fewer distractions, and a happier wide-awake sales force. If your company has a sales organization, your business stands to significantly benefit from shared business maps.
Share your business plans, define areas of responsibility, and encourage a collaborative environment. These are the steps along the path of sales growth.
Find out why over 25,000 business users log into www.MapBusinessOnline.com for their business mapping software and advanced sales territory mapping solution.
Contact: Geoffrey Ives geoffives@spatialteq.com or Jason Henderson jhenderson@spatialteq.com (800) 425-9035
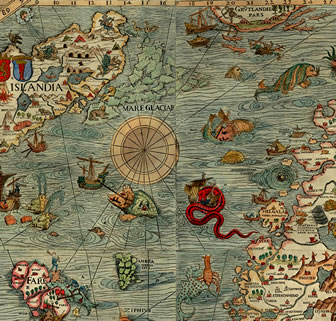
Back in the middle ages navigation maps were hand drawn or painted to represent places on Earth. These maps often included drawings along the edges which depicted frightful imaginary creatures that lurked in lands unknown. Back then the unexplored areas of the Earth were assumed to be filled with terrible things. Scarier even, I suppose, than the Spanish Inquisition, Attila the Hun, or being married to Henry the VIII. To name just a few known and man-made terrifying aspects of the time.
Today’s maps tend to be all business, although one can find more frivolous maps used for craft fairs and local businesses. Still, digital maps can be a work of art in that they are beautiful, interesting and colorful. And that beautiful aspect of your business mapping could serve you well in your endeavors.
Any business map maker is an artist telling a story against a canvas of states and ZIP codes. Our artistic map palate is a set of digital colors which we control. We add layers of boundaries and data points that we can color adjust and symbolize to help our viewers ascertain information more easily.
Realize that your constituents, viewing your sales territory maps or your demographic map analysis, will be more impacted by a well thought out and beautiful color and boundary scheme then a basic boring map with a few
There are few official guidelines for the art of creating a beautiful business map. A map maker can make their map any color they want. They can include all the layers they want and label as they see fit. In my experience some map works of art are better than others. Some fly a little closer to the higher art of map making.
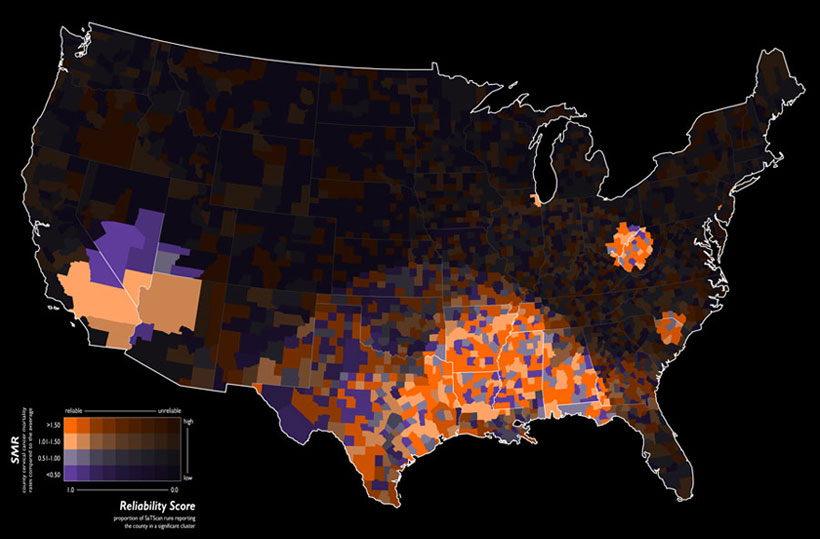
Here’s an example of a beautiful map I found on the GIS Map Exchange website. They explain the map’s beauty; it’s ability to describe cancer related mortality ratios in a simple way. But the map also utilizes a dark background and white state borders that allow the viewer to focus easily on the map’s intent.
Source: Geographic Information Systems Stack Exchange
Map Background Options
We’re so lucky compared to map makers of old. They had no map background to build upon. Until the 19th century map scale and map projection were rudimentary at best. Whereas, today’s map geek pulls up a base map instantly and simply goes to work. Map scale is automated and resets automatically based on zoom level. Digital maps generally use the web Mercator projection, keeping most web maps looking and feeling consistent.
In Map Business Online the user can choose from four different map background options. These options are easily explored. And don’t forget, at times you may find that no map background at all brings a certain sparse clarity to your map’s intent. Don’t be afraid to go all nudy-kazoo (map slang for no map background) because your map may not require a background layer. Ask yourself, does a map focusing on county population really require roads and towns? It may, or it may not. You, the map maker, must decide.
Topography, as a map background can be striking. Using topographic views in your map work can be beneficial or it can also be a distraction. Make sure your topographic use matches your business map intent. Experiment with different map backgrounds.
A Map of a Different Color
Here’s a series of maps designed to express information about poverty in the USA. Notice the way these maps utilize color. Blue and Red are somewhat opposing colors which lend themselves to depicting contrasting trends depicted in online business maps. Also notice that the maps listed apply various map layers depending upon data sources. Some maps focus on counties while others color code at the state level. Some maps are zip code maps, others are just not.
Map Business Online offers a pallet of colors and shade gradations from which to choose. These colors can apply to a variety of map layer or jurisdiction options so the map creator can select what is most appropriate based on the map data structure and purpose.
Any region selected offers a color box for fill color adjustment – simply follow the Edit Gear pathway and click into the color box. Once inside the color box, choose from the color shade options. If you know a specific hex color code for your color preference try typing it in.
Once your area fill colors are selected remember to review your border thickness and border color. Then adjust your area transparency controls to see if a little less color or brightness serves your map better. Transparency controls also allow the background map to show through – or not.
When color shading areas such as ZIP codes, counties or territories think about your map audience. How will your color choices impact your map viewer?
Would 50 shades of gray work?
Soft Map Audience – Are your map viewers already engaged in the maps purpose so that the map is simply more information? For this type of audience, I might choose non-threatening pastel colors for a warmer more relaxed map view.
Examples: A successful donor campaign committee meeting, new employee orientation
Map to Impress – Are you competing for map audience attention or are you trying to sell the audience on a concept? Use bold and bright colors to make your case. Look for high contrast colors for good and bad, high or low concepts.
Examples: Proof of concept product meetings, selling an executive team on a new corporate initiative.
Intelligent Audience – Are you presenting your map to a skeptical group of well-read scientists and thought leaders. Present clean maps with minimal clutter. Use rich darker colors with sparse background. Consider a detailed topographic layer if at all appropriate.
Examples: Presenting new health related findings to a medical community, explaining a decline in Opera Company revenues to the board of directors.
Maps tend to be used for business, but maps are really just an amalgamation of colors, shapes, and lines. Seek to understand the power your map medium has over your map audience. Learn to include a dash of beauty in your business map. It could make the difference between OK and Wow!
Find out why over 25,000 business users log into www.MapBusinessOnline.com for their business mapping software and advanced sales territory mapping solution.
Contact: Geoffrey Ives geoffives@spatialteq.com or Jason Henderson jhenderson@spatialteq.com (800) 425-9035
“We can pickle that.” Says Fred Armisen in one of his many Portlandia skits. Likewise, Map Business Online users can label practically any aspect of their business map.
Labels are an important aspect of business mapping. Labels identify places, and data points on the map while providing the map viewer with geographic orientation and references to associated data – like demography.
Map Business Online provides a variety of options for label placement. Labels can be assigned to imported point locations, to individual sectors of map layers like ZIP codes or Census tracts, and to the map itself. Map labels can be assigned to territories, drawn map objects, and even random map notes can be placed anywhere on the map.
Business mapping software makes it possible to append labels with additional data. This data could be imported business data, demographic data, or some other metric related to your map subject, like sales information or delivery data.
Adding data to label fields is a delicate process, in one way. It’s easy enough, but we want to be smart about adding data to labels on maps.
Always remember a map is a communication tool. Sometimes too much information detracts from a map’s ability to communicate. Only add additional data to your map when that data has relevance to the subject you are communicating.
What’s a Label?
Map Business Online provides multiple opportunities to customize the labeling of your imported business data points when mapping multiple locations. Included in these location point label features are Map Business Online’s latest capabilities associated with adjusting the Callout Tag. In general we divide location labeling into three types:
Label – These are labeling tags associated with zip code, county or state districts. For example, each state shows a state label within the state.
Callout – Callouts are label tags that popup when you mouse over an object, point, or a district
Territory Labels – Territory labels act the same as regular labels do but are associated specifically with the territories you’ve created while sales territory mapping.
All naming tags and labels in Map Business Online can be turned off and on. With regard to map layers like zip codes and states, you have the power to determine when those labels appear based on zoom level. Hover your mouse over the layer in question and click the Edit Gear. Choose the Label tag along the right side, and use the bottom function to control whether or not labels show, their size and font, and at which zoom level they appear. At each zoom level, the application will automatically decide which labels show and when labels don’t display, to control map clutter and label overlap.
Avoiding Redundant Labeling
Most business mapping software tools include a background map. The background map includes a variety of labels. These background map labels could be vector based (adjustable and query-able), but often those background maps are a static tapestry and are not labels the map maker can control. This is the case in Map Business Online – we offer static map background options.
I mention this because a map maker should be aware of all labeling options on their map project. The background map may identify towns. Your map project may take advantage of those town labels on the background map and this may be good enough to orient your map viewers. However, if you are importing additional town or city labels into your map project, either from a premium Map Business Online layer or on your own, that background map may be adding unnecessary clutter. Consider turning off the map background or adjusting map layer transparencies to tone down the background impact.
The attached video reviews the most obvious labeling options in Map Business Online. Here’s a list of where you can adjust and append labels:
Map Layer Labels – State, 3 & 5-digit ZIP codes, county, Census tract, MSA, City Limit and school district. Access from Manage Map & Data edit gear
Imported Data Labels – Call out tags. Adjust in the import data wizard or after import through the Manage Map & Data edit gear. Users can edit Call Tag labels by formatting the Call Out or by Customizing the Dataset
Territory, Region and Division Labels – Adjust in the Data Window under Manage Territories and Marketing Lists; or on the map itself select the Territory name and choose the edit gear; or in Manage Map & Data select the layer edit gear
Map Title – Open Manage Map & Data. Click the top menu Edit Gear. Toward the bottom check the Show Map Title check box and edit the resulting map title that now shows on the map
Add Text to Map – Map Business Online draw layer options include a Text Box you can add to the map. Click the ABC box listed in the Draw Layer drop down in the middle of the master toolbar to select the label, then click on the map where you’d like the label to be. You can easily move the placement, edit the font and color options as required
Drawn Polygons & Circle – Draw layers can be labeled too. Simply click the Edit Gear associate with the map object and check the Show Text box
Color Code by Circle – Users who choose to color code imported data by this method, see the Red and Green circle button on the master toolbar, can choose to include their numeric data within the circle as a label.
A cluttered map example. Too many Callout tags
Map Business Online Label Tips & Tricks
Callout Tags – Any points the user imports as a dataset or manually places on the map, one at a time, is a map Callout tag. Any callout label orientation can be adjusted by clicking into the label itself and choosing the tiny Edit Gear there. A callout label can be further adjusted by clicking the Dataset layer edit gear in Manage Map & Data and choosing the Callout tab. This is where you can:
Open and turn off all callouts – flood the map with labels if you want
Apply Compact Callouts to save space
Adjust flexible callout fields
Append Demographic & Imported Data to map layer (ZIP codes, State, etc.) labels by choosing the layer in Map & Data and clicking its Edit Gear. Choose Format Labels and the Auto Label options. Now simply go through your field options 1 through 5, adding the data you’d like to add by using the drop down navigation.
The Map Legend – The legend acts as a label too. And in Map Business Online it’s entirely editable. In the legend itself the Edit Gear in the upper right corner lets the user access all the legend labels for editing. The legend on off switch is located in Map & Data – click the high level menu Edit Gear and choose the Edit Legend option toward the bottom.
Map and Data Layers – Users will notice that you can edit the name of your data layer (imported, territory, region, division) by clicking the Edit Pencil when you hover over the Map and Data layer name. This is also a label of sorts and can come in handy. Think of the crazy labels we assign our data. Fix it there.
Adding Sales Dollars to Territory Labels
Territories are usually built based on zip codes, counties or state map layers – or other map layers available in the Add Map Layers option. So when you want to add a calculation or numeric update to your territory label, once again, hover over the related map layer and click the Edit Gear. Select the Label option along the right side and then choose Format Labels.
Now choose Territory Labels. From Territory labels you will see below an option to link with your imported data layer. Choose the column that contains your numeric sales data. Feel free to edit the label text – like adding a “$” sign or maybe the words “Q2 Results.” After you’ve finished click Change Labels and see your data now populated in the territory label on the map. This is my favorite feature in Map Business Online, except the ability to import Jpegs as symbols so I can build a map dedicated just to Don Knotts. See video.
Grow Your Own Symbols
Map Business Online let’s you choose your own symbols and add them to the available library of symbol options. Your industry may have its own library of standard symbols to choose from. As long as the symbols are of reasonable size, in Jpeg or bitmap format, you can import them for use on the map as mappoints.
To do this, you should have already selected a jpeg image and saved it to you desktop somewhere. Then in Map Business Online simply click into the Symbol library where ever a symbol is available (color code by point, the Data Window) and scroll to the top of the library. Choose Custom Symbol and import your symbol pic into the library.
Editable Legend
And speaking of labeling, let’s not forget, that the map legend is entirely editable in Map Business Online. Use this tool to make your final map speak to your map audience. The legend pulls together your entire map presentation by allowing you to spin your message using terms your audience understands. Click that little circle in the upper right corner of the Map Legend and edit the points and layer names. You won’t regret it.
Your map viewers will never remember a confused, overwhelming map, but if you use Map Business Online to make your map speak to your audience in terms they understand, they’ll always come to you for maps that help. You’ll be like the mad map maven, or the map-meister – at last known for something.
If I’ve missed any label options, let me know. In closing, remember to use labels to improve the way your map communicates and to avoid distracting your map audience with too many labels. Otherwise we may have a failure to communicate.
Find out why over 25,000 business users log into www.MapBusinessOnline.com for their business mapping software and advanced sales territory mapping solution.
Contact: Geoffrey Ives geoffives@spatialteq.com or Jason Henderson jhenderson@spatialteq.com (800) 425-9035
Creating a basic local map, like a fifty-mile radius around a city, should not be a lot of work for any business mapping user whether you subscribe to Map Business Online or My Freakin Map’s Perfect.
In the real estate business, the usual online mapping programs for realtors don’t always cover every need. There may be a few expensive real estate mapping tools applied by large real estate conglomerates, but most one-off or small group realty firms require business mapping software they can afford and software they can figure out.
At $299.95 per user per year for the USA or Canada, I think Map Business Online has the price figured out. But what about building a wicked quick map of a specific area?
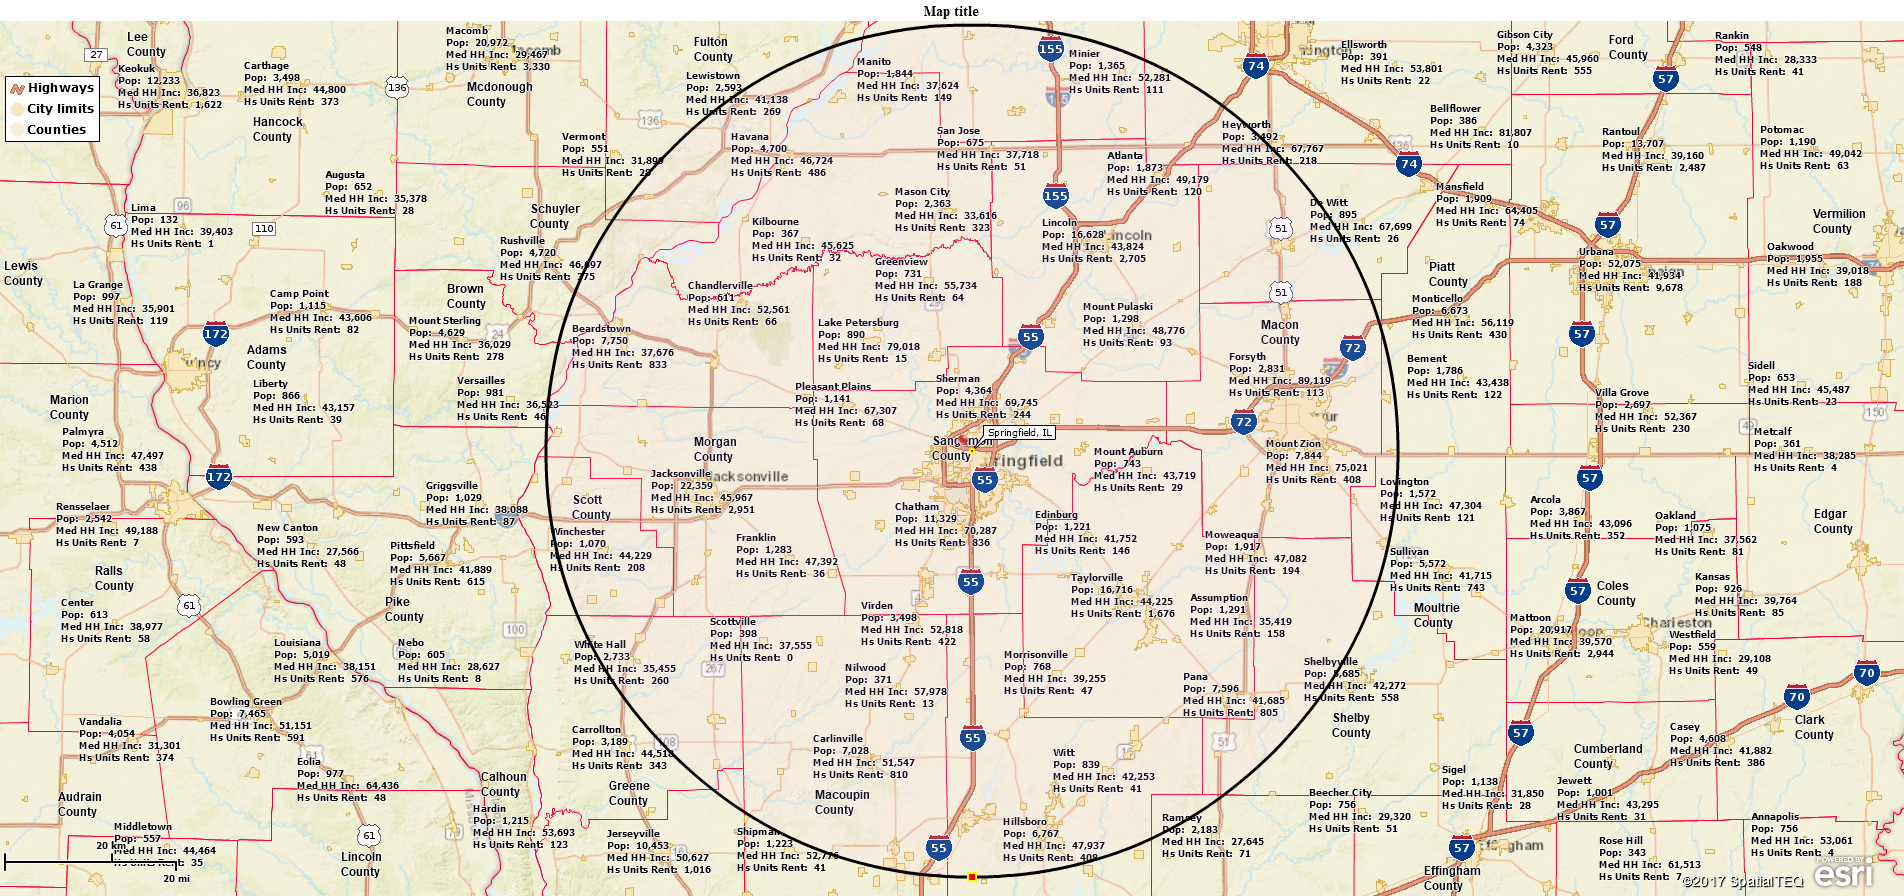
We recently got a call from a client who wanted a fast, real estate map. “Dude I just need a fifty-mile radius around a city with counties and major highways displayed.” Seemed simple enough to me.
To build that map as requested took me all of one minute. It’s a straight forward process from the Map Business Online new map start screen – keeping in mind that you do need an annual subscription to access the city limits and highway overlays, which are premium layers.
So, the first thing I’d did was key in my city of choice into the address bar – “Springfield, IL.” That zooms the map into the middle of Springfield, IL (the area of interest) and places a mini-tool bar on the map near my center point. I clicked the Radius Search button on that mini-toolbar and searched out 50 miles around my center point.
Once my circle was drawn on the map I pulled my Zoom View scroll bar in the upper right corner of the application back to see the entire 50-mile radius. I then turned on the County layer in Manage Map & Data and edited that layer, clicking the Edit Gear and choosing to make the counties 90% transparent and the county boundaries a thin red line (no pun intended.)
Next, I selected both the City Limits and a Highway layer from the Premium Layer or Add Map Layers button on the master toolbar. The highway layer didn’t require tweaking; it lays on top of the map background streets but adds the Interstate Highway Logo. I left the City Limit layer boundaries and fill untouched, but I did adjust City labels making the font larger and adjusting background color on the label.
I figure a real estate business may want some extra information, like the surrounding demographics, visible on the map for quick reference. So, using Map & Data, I clicked the Edit Gear on my City Limit layer and chose Labels and Format Labels. Making sure the Auto Label tab was selected I:
Choose Number 1 of the five flexible label fields to edit
I selected Demographic Data as my data source
I chose Population 2017 for my first additional label field
I added a little explanatory text: “Pop:”
I repeated the above process for two more of the five flexile label fields
I then clicked Change Labels and viewed the results
Once I was done with labels, I viewed my map. This is an important stage in business map development. You’ve taken the time to build a map, now make sure it does what you expected it to. Ask yourself some critical mapping questions:
Is the map too busy? Did I lose the emphasis on my original intent?
Is there additional location information I could bring to bear on this map to make it more informative?
Does the map background enhance or detract from my presentation?
Are the colors I chose for map objects (the circle on this map) clearly displayed or do they blend in too much? Would more transparency help or hurt the map view?
Is my zoom level of detail support the original business reason for the map?
You have many choices for sharing the map. Generate image files in PNG or JPEG formats for presentation graphics. Try a PDF map to print larger format maps or wall maps. Or share the map as an interactive web map. You could even use Map Business Online to present your map view.
Conducting a presentation while using Map Business Online is probably the coolest way to go, because you can emphasize layers and overlays by turning them on and off as you speak. Wowing everyone with your mapping skills as you emphasize your presentation point.
“In closing, shaded in red are the ZIP codes that show the most promise for our summer marketing campaign, based on disposable income and our key age demographics per ZIP code, and the number of two bedroom homes per city limit.” And the crowd goes wild.
Find out why over 25,000 business users log into www.MapBusinessOnline.com for their business mapping software and advanced sales territory mapping solution.
Contact: Geoffrey Ives geoffives@spatialteq.com or Jason Henderson jhenderson@spatialteq.com (800) 425-9035


