I’m Not Going to Pay a Lot for This Muffler

Pricing. In business mapping, as in all business, whether you are a buyer or a seller you have to pay attention to pricing. Most of us over the age of thirty remember that TV commercial where the wary consumer wills his muffler repair bill lower by repeating the phrase, “I’m not going to pay a lot for this muffler.”

Many customers contact Map Business Online preparing themselves for a similar price battle or maybe they’re just a little nervous about how to justify this mapping expense to their boss. Especially now that Microsoft obsoleted MapPoint and Streets & Trips – two extremely affordable mapping solutions.

Relax. Here at Map Business Online we’ve worked very hard from both the development standpoint and the price assignment perspective to keep advanced business mapping tools affordable for you and other business users.

It’s important to understand the pricing model for any product or service you purchase, as well as any real benefits that might save your company money. Beyond all of that, I’m sure you also look at the overall product value to your particular business processes when you procure or requisition a product.

The Pricing Model

Map Business Online is a web based business mapping software. You access the tool and your maps through standard web browsers.  The tool is priced as a subscription and options are listed here: https://www.mapbusinessonline.com/Subscription.aspx

Basic Map Business Online subscription options include coverage areas for the USA, Canada, the UK or a combination of those areas. You can also choose between a 90-day subscription ($99.95 – USA) or a full year. The full year subscription ($299.95 – USA) provides additional functionality:

  • Import up to 100,000 location records per map (90-day is 5,000)
  • Build up to 1,000 territories (90-day is 10)
  • Save 200 maps (90-day is 100)
  • Premium layers – Cities, city limits, Census tracts, MSAs, 3 Digit zips, and school districts
  • Market Analysis for comparing disparate datasets; searching and summarizing multi-points

For a standard USA subscription for one year the user should expect to pay $299.95 per user per year, with a ten percent discount available if the user buys from the free trial before it expires. That’s bring the price down to $269.95 per user per year. Compare that number to other services offering similar features.

Included Benefits That Lower Your Overall Investment

For companies using Streets & Trips, Cloud based business mapping services like Map Business Online might feel at first like an increase in price. But when viewed carefully you’ll find the subscription price includes features that actually lower costs.

For instance, if you applied Streets and Trips across a user network or as bulk installations you were paying a per seat price for each map user. With Map Business Online each subscription includes the ability to share interactive web maps with your constituents – up to one hundred MapShare sessions per month at No Charge.

A session is an interactive web map shared by the map creator, who sends a link to non-subscribers for map viewing. Users can view that free map for a week if they want – closing the browser window ends the first session. More sessions can be purchased for a modest fee.

These FREE map views include optimized routing capabilities, up to 100 stops. Radius and polygon search results of shared data can be exported and used outside of Map Business Online. And best of all, when compared to Streets and Trips, the map data is regularly updated as part of the subscription. All of these features increase value.

Retail Biz Map

A retail business map

Location Awareness Value

Your business is changing. You know this to be true. To adequately face change and make the best decisions possible your business requires information. Often that information is location related. Business mapping enables the location-based analysis necessary for your business to successfully move forward.

  • Where will your sales revenue come from in the future?
  • Where has sales revenue come from in the past?
  • What is your company’s optimum demographic profile and how can it be replicated?

Investing in an affordable business mapping software that addresses these questions and other location related queries, provides significant value. That’s because there is tremendous value in better decision making.

And with Map Business Online, you’re still not going to pay a lot for that muffler.

Find out why over 25,000 business users log into www.MapBusinessOnline.com

Contact: Geoffrey Ives geoffives@spatialteq.com (800) 425-9035, (207) 939-6866

MapPoint users – please consider www.MapBusinessOnline.com as your MapPoint Replacement.

Please read customer reviews or review us at Capterra, or at the Salesforce.com AppExchange.

Posted in Uncategorized | Tagged , , , | Leave a comment

The Power of Business Mapping Software

What does an organization miss by not using business mapping software? That’s a valid question. All software applications cost money to acquire and require investments in people and time to implement. While it is true that the required investments for most business mapping software is modest, why bother introducing yet another software into a busy business?

The Power of Visualization

The human brain processes information in a variety of ways. Visualization is a very efficient way for the brain to understand a situation. That’s why our eyes evolved into our most critical sensory receptor.

Our brains work quicker than we know, processing information in chunks and leading to deductions that are than reviewed,  rejected or confirmed by looking at more information. Sometimes this analysis takes place in a few blinks of an eye.

Spreadsheets with business data do not lend themselves to fast processing.  Raw business data requires examination, thought, queries and re-examination.  But maps offer visualizations of business analysis based on raw data. When maps are shared the people viewing the maps are giving an opportunity to draw conclusions visually. Visualizations support clear and fast decision-making.

Business maps share visual information by defining location points and areas of interest on a digital map of the world. Points and map areas can be color shaded to define specific areas and points by category or coverage area.  A map legend quickly informs the viewer what these color shaded areas or points refer to in the real world.

In business mapping color can define demography by county, business coverage areas by zip code, sales territories by state, clinician requirements by Census tract, franchise opportunities by zip code, insect infestation by county – practically any phenomenon that can be defined by area.

The true power of map visualization is achieved when the viewer recognizes patterns and trends not discerned in the raw data. Such visual results can shift decision-making and strategies in ways that may encourage growth or suggest caution and restraint, depending on the situation.

The Power of Organization

Spreadsheets are usually pretty organized. Many business systems like CRM or ERP systems, are simply ways of organizing business data for the benefit of data accessibility and decision making. Maps extend the organizing process through visualizations and analysis.

By viewing field staff location points against a business map, daily decisions about staff allocations can take place in an organized way. Maps enable faster decision-making because relative proximities between the closest staff to field crisis points become obvious.  Maps direct staff to field work efficiently, minimizing chaos (KAOS).

Work flow efficiencies and reduced operational costs are side benefits to applied map visualizations. Tangible upsides include rapid response times, faster problem resolutions, and reduced crisis management. Overall improved capacity planning through business maps means fewer people achieve more. In most business that means an improved competitive position, lower costs, and faster growth.

The Power of Communication

In business, no one can hear you scream.

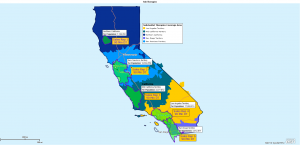
Business Planning Map

Business Planning Map

In business, you can’t always make your people happy by paying them more. Most businesses go through lean periods where economic conditions or growth opportunities may limit employee paycheck growth.  I believe most employees have some patience for such periods.  But there are ways you can make those periods more palatable. One way is to communicate effectively.  Use business maps to define a business situation for your constituents can encourage team building in a crisis.

Because maps are visual tools and help to organize business workflows, business maps are great communication tools. I always use the quarterly sales meeting as a perfect example of using maps to improve communication. Sales forecast and results can be easily displayed through sales territory mapping. Sales people viewing sales results against a map drives accountability and accountability drives sales.

There are many business communication applications companies we know well, regularly apply:

  • Call centers share business web maps so client information is easily available to sales reps
  • Marketing organizations share maps across departments as a way develop marketing campaigns out of visualized prospect data
  • Homecare and hospice agencies share business maps so that staff can view critical field requirements and react effectively
  • Sharing demographic planning map views that point out successful retail store locations and potential store locations
  • Customer service orgs share maps across a CSR network for customer zip code lookups

I’ve seen maps used by prosecuting attorneys to make their case clear to a jury.  Maps have a way of turning a mess of information into a convincing description of where and when a crime was committed.

The case I’m thinking of was cold-blooded murder. There were many people involved in the crime story, lots of driving with a dead body, and a hasty shallow burial in the woods. The company I worked for at the time provided a business map that could be shared with the jury. It showed the specific locations where the defendant was and at what day and time. The map referenced pictures of evidence associated with each location.

Needless to say, that guys in the big house for life. Shared maps promote justice, and justice promotes the big house. There’s power in that too.

Find out why over 25,000 business users log into www.MapBusinessOnline.com

Contact: Geoffrey Ives geoffives@spatialteq.com (800) 425-9035, (207) 939-6866

MapPoint users – please consider www.MapBusinessOnline.com as your MapPoint Replacement.

Please read customer reviews or review us at Capterra, or at the Salesforce.com AppExchange.
Posted in Uncategorized | Tagged , , , , , , | Leave a comment

Sometimes You Just Need a List of Zip Codes

Sometimes with business mapping all people want is a list of zip codes.

Business Mapping Software is funny. At least from my perspective it’s funny. For some people the learning curve for mapping software is extremely easy. When providing web demos, I have to be careful not to talk too much or show these people too many details.  They come to us advanced technology users and they like to figure things out for themselves.

With other clients I may have to slow way down and keep the demo very basic.  I find everyone learns in slightly different ways and at different speeds. Some prefer to learn by watching videos. Others learn by reading or just asking questions. Still others are a combination of the all ways. A service organization must be prepared to help a user learn at their own pace.

Map Business Online offers some advanced features and some simple features. Online business mapping in and of itself should be no more complicated than using an Excel spreadsheet. And for the most part, it is no more complicated than that.

One of the most basic features we offer is ability to create a list of zip codes. People use exported lists of zip codes generated from zip code mapping software for a variety of applications:

  • Establishing a direct mail target address list or a birthday party invitation list
  • Determining areas of responsibility for service people, sales people, or survey takers
  • Displaying color shaded zip codes to define franchise availability
  • Exporting a list of zip codes by sales territory aligment
  • Displaying color shaded areas for food sheds, medical emergencies or disaster areas
  • Defining your kid’s paper route
  • Clarifying school bus pick-up areas
  • Reviewing demographic breakdowns for city planning
  • Determining political polling data collection procedures
  • Clarifying to my wife my geographic limits for errands on Saturday morning

The list is endless. Map Business Online is truly a zip code map for businesses.

In Map Business Online we can gather zip codes within a radius, by random polygon, or by a polygon that roughly outlines the boundaries of a county or a state. We can collect zip codes by radius from a specific point or address. We can collect zip codes by drive time search.  We can also collect lists of zip codes by filtering the zip code data using modifiers – i.e. I want all the zip codes greater than or equal to 90001 up to 91005.

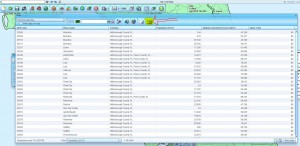
Once your list is established as a subset data list of zips in the Data Window you can export that list out as a .CSV file simply by clicking the far right Export Button on the Data Window toolbar. Open the list from within your database or spreadsheet management tool.

Listofzips

List of zip codes in Map Business Online with export button noted.

I honestly don’t know what else to tell you about lists of zip codes. It’s pretty easy in Map Business Online. And that’s a good thing, because sometimes you just need a list of zip codes.

Find out why over 25,000 business users log into www.MapBusinessOnline.com

Contact: Geoffrey Ives geoffives@spatialteq.com (800) 425-9035, (207) 939-6866

MapPoint users – please consider www.MapBusinessOnline.com as your MapPoint Replacement.

Please read customer reviews or review us at Capterra, or at the Salesforce.com Appexchange.

Posted in Uncategorized | Tagged , , , , , , , , | Leave a comment

How Do I Share Maps for Editing In Map Business Online?

Business map users sometimes desire to share map editing privileges with constituents.  In other words, one subscriber to a business mapping software would like to share their business map with another subscriber to get more editing input – to leverage more than one head towards a solution.  Sometimes two or more map editors are better than one.

Map Business Online encourages users to share maps. We offer two different approaches to map sharing:

  1. Public Sharing (View only)- Sharing your saved map as an interactive web map. We call this public sharing and it does not enable collaborative editing. Public map sharing is provided at no charge for up to one hundred web sessions per month. The user would be sharing interactive web maps for view only access.
  2. Private Sharing (Co-editing) – Sharing your saved map for co-editing.  We call this private sharing and it requires annual subscriptions to Map Business Online for both the initiating map editor and the co-editing map sharer.

Any two annual Map Business Online subscribers can share maps for co-editing. Co-editing allows two or more subscribers to have the privilege of editing a shared map. The key is, both map editors must be annual subscribers.

Shared editing functionality is not possible with publicly shared interactive web maps.  That process allows shared map viewing only. An allocation of publicly shared view-only map sessions are included with every Map Business Online subscription at no additional fee.

To share maps for co-editing between two Map Business Online subscribers, the initiating map editor creates a map and saves it.

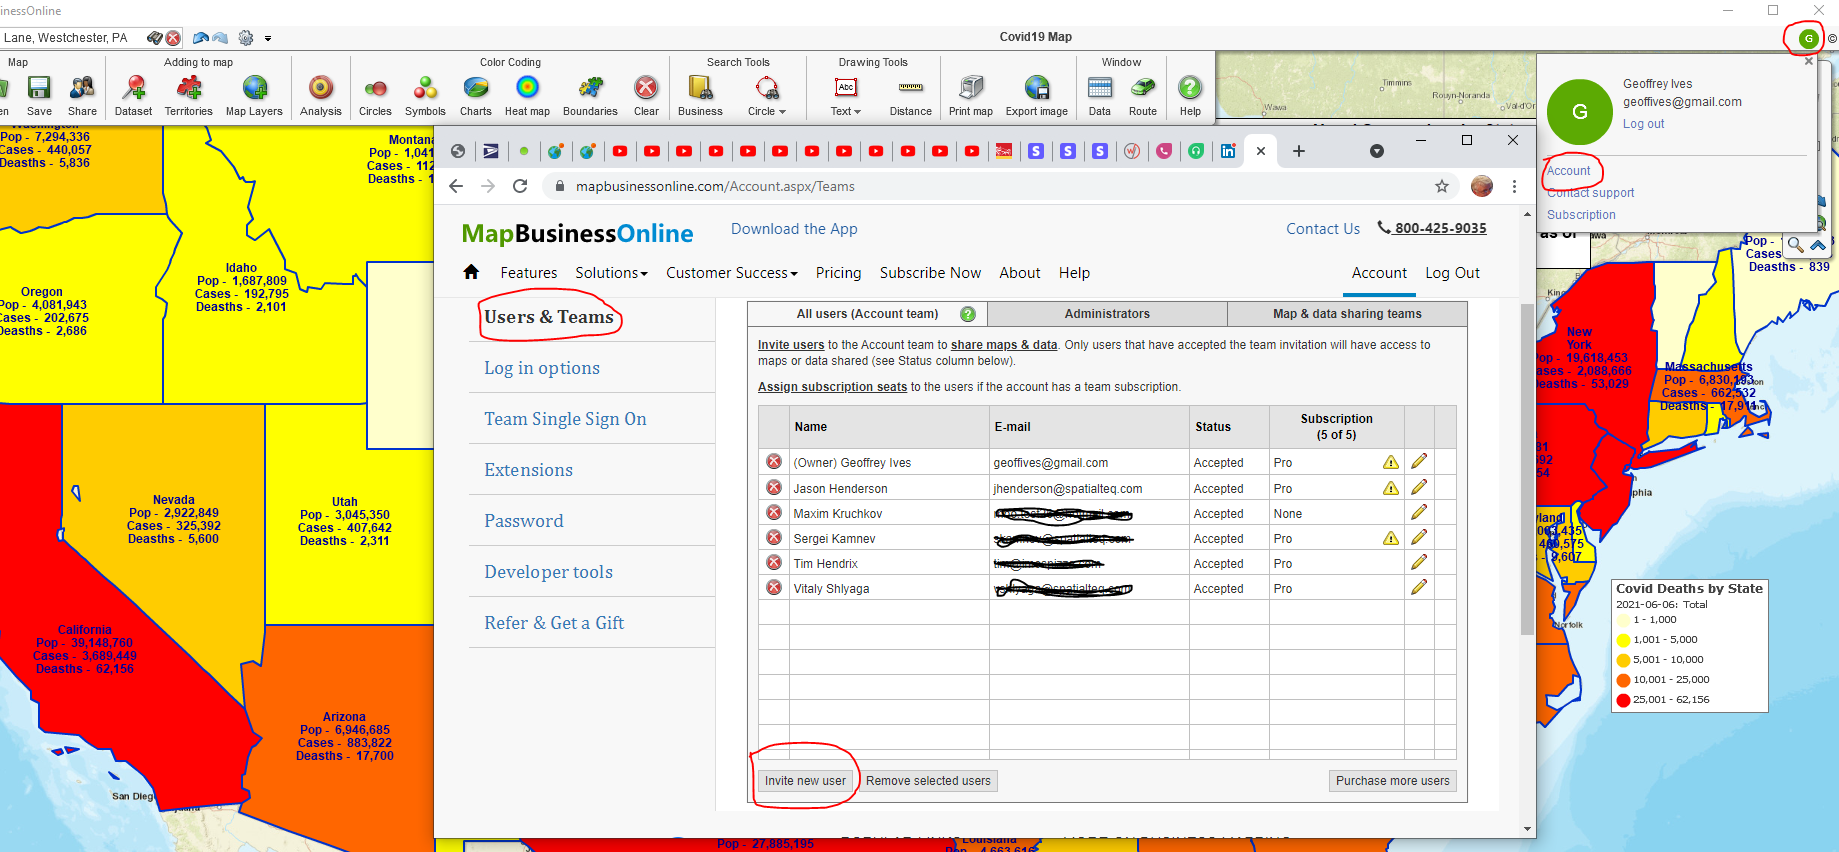
  • To Share a map for editing a map editor must go to Account, now located in the user Initial above the upper right-hand corner of the application. Click your login first initial in the Green circle.
  • In Account select Users and Teams. Under the All Users, at the bottom, click Invite User.  Fill in your shared target user name and email, then click Invite User.  Your shared co-editor will get an email from which they must accept the invitation.

    Account Setup for Private Sharing/Co-editing

  • Once the invitation is accepted. Click the Share Map button on the master tool bar and choose Private Sharing
  • In Private Sharing click the Share with Users button
  • Select the target co-editor’s email address
  • Select the desired role you’d like the shared co-editor user to have – that’s up to you
  • Click Add Selected Users in the lower right
  • Back in the Share Map dialog, choose Share Map in the lower right

Now the process moves to the co-editing target user’s Map Business Online application.

  • The receiving Map Business Online user, targeted to co-edit the shared map, clicks the Open Maps file folder button on the maser toolbar
  • In the drop down choose Map Shared with Me
  • Choose the map shared with you by the initiating map editor
  • Proceed to edit the map – save when changes are complete
Substantial Therapies

Solicit feedback with shared editing

Team Co-Editing

Map Business Online also offers Team Subscriptions starting at quantity five. These subscriptions offer a quantity discount and provide administrative tools for setting up groups of co-editing users.

Team subscriptions require a designated Team Administrator to manage the subscription and the groups of co-editors. Sometimes these are two different people, but usually the same person manages team and the subscription.

Once purchased, the Team Administrator sets up the team protocol for their team’s Map Business Online experience. The administrator must manage the following tasks:

  • Sharing the subscription with the individual members of the team. Tools to do this are located in the Map Business Online Account section of the application. Click Account and follow the menu for Subscription and Users & Teams
  • Once subscriptions have been confirmed the Administrator sets up users and teams for sharing
  • Maintenance of teams and users – deletions, additions, and adjusted controls
  • Subscription renewal notices will be sent to Team Administrators

Co-Editing User Allowances

Team members sharing an Map Business Online subscription have full Map Business Online functionality  to create and manage their own maps. Maps shared for co-editing with team members include access settings which are controlled by Team Administrators and Map Creators. Co-editing users may be allowed to edit maps, edit data, edit both maps and data, or set up as view only.

View Only makes sense for Teams that require private sharing and full subscription features but may need to limit data access. One example would be call center employees that require access to drive time queries.

Suggested Use of Shared Maps

Maps created for informational purposes like call center support, zip code look ups, sales territory sharing, and website location maps should utilize public map sharing, view-only maps. No map editing is allowed for these map viewers.

Maps used for group problem solving, cross-department operational planning, hands-on sales managers, and other strategic applications should consider private map sharing, shared map editing privileges.

Maps are for sharing and communicating, which is why businesses should be aware of how they are sharing maps. Know when your work demands private shared map co-editing, or when public view only maps could be more appropriate.

Maintain Cyber Security at All Times

Your imported data is your data. It is important that you and your users know what data is allowed to be imported and what data is not allowed. Never import private information to a web application. Do not import social security information, bank accounts, credit card information, or patient healthcare information. Your imported data is your responsibility.  If you have questions about your data see your data manager or your boss.

_______________________________________________

Find out why over 25,000 business users log into www.MapBusinessOnline.com for their business mapping software and advanced sales territory mapping solution. The best replacement for Microsoft MapPoint happens to be the most affordable.

To access MapBusinessOnline, please register and then download the Map App from the website – https://www.mapbusinessonline.com/App-Download.aspx.

After installing the Map App, the MapBusinessOnline launch button will be in the Windows’ Start Menu or Mac Application folder. Find the MapBusinessOnline folder in the Start Menu scrollbar. Click the folder’s dropdown arrow and choose the MapBusinessOnline option.

The Map App includes the Map Viewer app for free non-subscriber map sharing.

Please read customer reviews and review us at Capterra, or g2crowd

Contact: Geoffrey Ives geoffives@spatialteq.com or Jason Henderson jhenderson@spatialteq.com

Posted in Uncategorized | Tagged , , , , , , | Leave a comment

Query All Records Outside of a Map Object

Sometimes you want to identify an area on the map and query all of the records that lie outside of that map object. Think about this a second. Business mapping software generally lets you conduct spatial queries, a fancy name for ‘find all the data records in this circle or shape.’  But, if you think things through, you can find records outside of a shape on the map.  It’s another way to apply business intelligence mapping.

Why would one want to know what points lie outside of a map object? Perhaps to protect a specific sales territory or maybe to provide sales planning direction.  Businesses often have core areas of market penetration. By exploring opportunities outside of these core areas businesses grow.

Let’s assume the object is a circle we created using a radius search tool and we want to find all of the records outside of that circle. A list of records derived through any spatial query in MapBusinessOnline is known as a marketing list.

On this map we’ve imported a customer list of 665 location records all placed in the northeast corner of the USA. We can define a radius search or circle on the map by dropping a radius search point anywhere or by inserting an address in the Address bar and choosing the Circle tool from the mini toolbar associated with that point.

Once our circle is defined we can query the circle area and see that the circle contains a marketing list of 136 records. We save that marketing list of data points within the 150-mile radius circle giving the resultant file a name – Within 150.

Next we create another object on the map that encompasses the entire data set. We query the data for that larger area and name it. We name that resultant file or marketing list – Whole List. This marketing list is redundant with the original import and is used to conduct calculations, while leaving the original imported dataset untouched.

Next, on the Data Window Dropdown List, select the dataset or marketing list we named “Within 150” – that’s the records in the circle. Then choose the “Create New or Edit Existing Marketing List”, button. We’re going to edit a marketing list.

Choose the “All Locations in the Data Window option.” Then choose the option to “Remove From” this should lead directly to a list which includes the “Whole List” marketing list – select that list.

That operation removed the data points in the circle from the Whole List. The Whole List is now a partial list. You should rename the marketing list to reflect that it now represents the list outside of the circle.

Essentially what you did is this:

  1. You identified a subset marketing list within a circle on the map – Within 150
  2. You identified an overall list of all records on the map –Whole List
  3. You subtracted the Within 150 list from the Whole List
  4. I recommend renaming Whole List to Partial List for clarity
Business Map Spatial Query

Business Map Spatial Query

Business mapping software is a spatial data visualization tool.  We provide a variety of tools to help users make use of their location based datasets. We never know how users may apply the product.  So thinking outside the box, and experimenting with various approaches to managing your data, can yield interesting results.

Just take it slow. Try various approaches. Build and delete maps for practice. And try to keep things simple. Remember some of Geoff’s General Geographic Guidelines for using Map Business Online:

  • Avoid map clutter to maintain a clear map message for your map viewers
  • Do not import more than a dozen datasets per saved map
  • Consolidate like datasets wherever possible to take advantage of the 100,000 point per map allowance in the full subscription
  • Use your business vernacular in labeling options and in legend edits, to help your map communicate clearly
  • Try the various map backgrounds, including no background, to see what works best
  • Remember, territories or Areas of Interest are really easy-to-use database editing tools
  • Map Business Online is a great MapPoint replacement
  • Use the Help button and the Youtube videos. Hit the Contact button to ask questions

When you shop for business mapping tools make sure you understand:

  • The subscription pricing options
  • The imported data per subscription allowances and per day allowances
  • The technical support availability
  • How easy the tool is to use – use the free trial

_______________________________________________

Find out why over 25,000 business users log into www.MapBusinessOnline.com for their business mapping software and advanced sales territory mapping solution. The best replacement for Microsoft MapPoint happens to be the most affordable.

To access MapBusinessOnline, please register and then download the Map App from the website – https://www.mapbusinessonline.com/App-Download.aspx.

After installing the Map App, the MapBusinessOnline launch button will be in the Windows’ Start Menu or Mac Application folder. Find the MapBusinessOnline folder in the Start Menu scrollbar. Click the folder’s dropdown arrow and choose the MapBusinessOnline option.

The Map App includes the Map Viewer app for free non-subscriber map sharing.

Please read customer reviews or review us at Capterra, or g2crowd

Contact: Geoffrey Ives geoffives@spatialteq.com or Jason Henderson jhenderson@spatialteq.com


Posted in Uncategorized | Tagged , , , | Leave a comment

Communicating with Business Maps

For centuries maps were used for navigation and planning, as opposed to communicating. Early map addicts included explorers like Columbus, Magellan, and Hudson. The planners of history using maps were people like Napoleon, Richard I, and Thomas Jefferson.

Today we have Internet mapping and we can purpose maps for many more business and personal applications like:
• Sales planning
• Market analysis
• Delivery route planning
• Party invites
• House hunting
• Communication

Maps for Communication
I suppose Napoleon might have sent copies of maps off with runners, to better communicate battle orders through his field commanders. But I’m pretty sure Napoleon never tweeted a map. Using maps to communicate is a more recent development.

The Internet has helped enable software platforms for map creation and sharing. It has also created an audience for the maps we share. You can’t spend time on Facebook, Twitter or LinkedIn without running across a map designed to communicate a trend, a bargain or a warning. Maps today are used to communicate all sorts of concepts.

Over the past four days I’ve read online social media maps that described these phenomena:
• State delegate counts by presidential candidate and party
• Projected presidential election results based on current polling
• An analysis of sports economics
• A description of the best states to retire to related to low taxes
• A map projection of Earth after all polar and glacial ice has melted
• A personal reminiscence of travel to Calaveras Big Trees State Park
• Low Income Housing Coalition map describing USA affordable housing

Maps are ubiquitous in our lives because they communicate large concepts quickly and effectively.

Map Are for Sharing
Business mapping software leverages mapping communication capabilities for your business processes. Looking at my notes back two weeks, I see businesses using maps to communicate for call and dispatch centers, for sales reporting across a network, for market analysis reporting, search & rescue status, capacity planning, business expansion planning, shared status maps for almost any field activity, insurance claim management, competitor analysis, non-profit donor analysis, media report generation, and home care clinician staffing.

You have choices in how you communicate using maps. You may deliberately set about building a map to communicate a concept, or you may have created a business map to assist with your business workflow and suddenly realized that by sharing the map you could improve your process tenfold. Either way, you have concluded that a shared map beats a private map; Maps are for sharing.
StaticMap
A Static Map

It’s possible that a static map is all you’ll need to share to get your point across. A simple PDF, Jpeg or PNG file can provide a world of information for your map audience. Maps usually include map legends, as well as area and data labels to help explain critical aspects of your business map. Often these static references provide all the information your map audience needs.

A political map describing projected voting results is a great example of a successful static map. State labels and projected voting results adequately describe your map’s intent. But for some business processes more layers may be required along with several map layer options. Consider an interactive web map to support such cases.

Sharing an Interactive Web Map
A franchise organization that allocated sales territories by zip code may want to show multiple layers:
• A state layer for map orientation – making your audience aware of placement
• A zip code layer shaded by color to denote available or sold territories
• Point layers that show store or distributor locations

A variety of layers could be selectively turned off and on by map viewers, enabling more or less data for decision-making processes as required. Call center phone reps could conduct zip code look ups to view specific coverage areas in detail, perhaps to recommend stocking store locations to consumers who call in.

Interactive maps can alert your traveling constituents, sales people or field technicians, of business priorities through color coded rankings in addition to providing efficient travel routes. By creating effective business maps through data layering your constituents will become more location aware.

These situations are imminently solvable through interactive map sharing:
• What additional account possibilities exists along a sales person’s route?
• Where are all of the bad guys located within ten miles of our crime scene?
• Where is my closest clinician home compared to critical patient locations?
• Show me the largest concentration of older Americans with the highest levels of expendable income?

All of these map sharing examples are achievable by map users who are no more adept at technology than jamokes like me, who manage to create, save and edit Excel spreadsheets on a semi-regular basis.

So remember – Map are for sharing and even you can do that.

Posted in Uncategorized | Tagged , , , , , | Leave a comment

Import Your Address Spreadsheets into MapBusinessOnline

If you already regularly import your business data into MapBusinessOnline, please move on. This blog post is for people just beginning to import their customer address spreadsheets or prospect lists into a business map.

Possibly, the most popular use of business mapping software is data visualization. “Data visualization” is nothing more than viewing an address database against an accurate map. The ease with which you can do this in MapBusinessOnline is why many users claim we offer the best business mapping software available. You can import your business data into MapBusinessOnline using a paid subscription or the free trial. The free trial limits the user to 1000 locations. With the full-year subscription, you can import up to 50,000 records per map for MapBusinessOnline Standard and up to 250,000 records in MapBusinessOnline Pro.

Importing for Optimized Routing

Many organizations import location spreadsheets into MapBusinessOnline to set up optimized routing options.  With the data imported, a user can select up to 150 addresses as stops in an optimized or as-presented route. A quick action button on the Data Window toolbar, labeled Add to Route, lets you instantly create a route to all stops or addresses in the Data Window view.

MapBusinessOnline only allows one Route on the map desktop at a time. However, a savvy user can create marketing lists out of imported datasets to make it easy to generate fast routes for optimization. Create and label those subset lists (up to 150 location records), select one, and click the Add to Route button.

Another tip: save a map with a new name once a route is in place on the map.  Now, that route is saved under that map view.  Go back to the parent map to quickly create and save a few more.

Mapping distribution centers within a logistics map.

Map Visualizations

To achieve data visualizations, you need no more technical capability than the ability to create, edit, and save an Excel spreadsheet. Make sure your address, city, zip code, and state data are allocated to separate columns in your spreadsheet. Each column should have a simple heading like “Address,” “City,” “State,” and “Zip Code.”

Include any other pertinent data columns you’d like to add. Business users might include sales data, product data, type of accounts, or any other information that relates to their business. Ensure the spreadsheet does not include descriptive sentences or paragraphs above the data heading sections. Those descriptive sections tend to interrupt the import process.
Sample Address Spreadsheet Ready for Import
Sample address spreadsheet – ready for import

Unique ID Column
Some of you may export your data from a customer service tool, a CRM, or an ERP system with customer numbers or a record ID. MapBusinessOnline does not require these fields but can be used to semi-automate the data update process. So, if you’ve got unique ID numbers, go ahead and use them. The Unique Identifier field to match is in the second import dialogue page.

Plot Your Data
When you are ready, click the Dataset button under the Adding to Map section of the Master Toolbar. Navigate to your data and select it. As you click the next buttons, choose which sheet you want to import from your spreadsheet.

At the first dialogue page, confirm that the address function in MapBusinessOnline is accepting the address information in your spreadsheet. This page shows a twenty-line preview of your spreadsheet. I typically glance at this page to ensure the location placements all fit into place. I confirm that the State goes into the state bucket, the Zip Code into the zip code bucket, and so forth. Latitude and Longitude are shown here as well, in case you imported by lat/Lon.

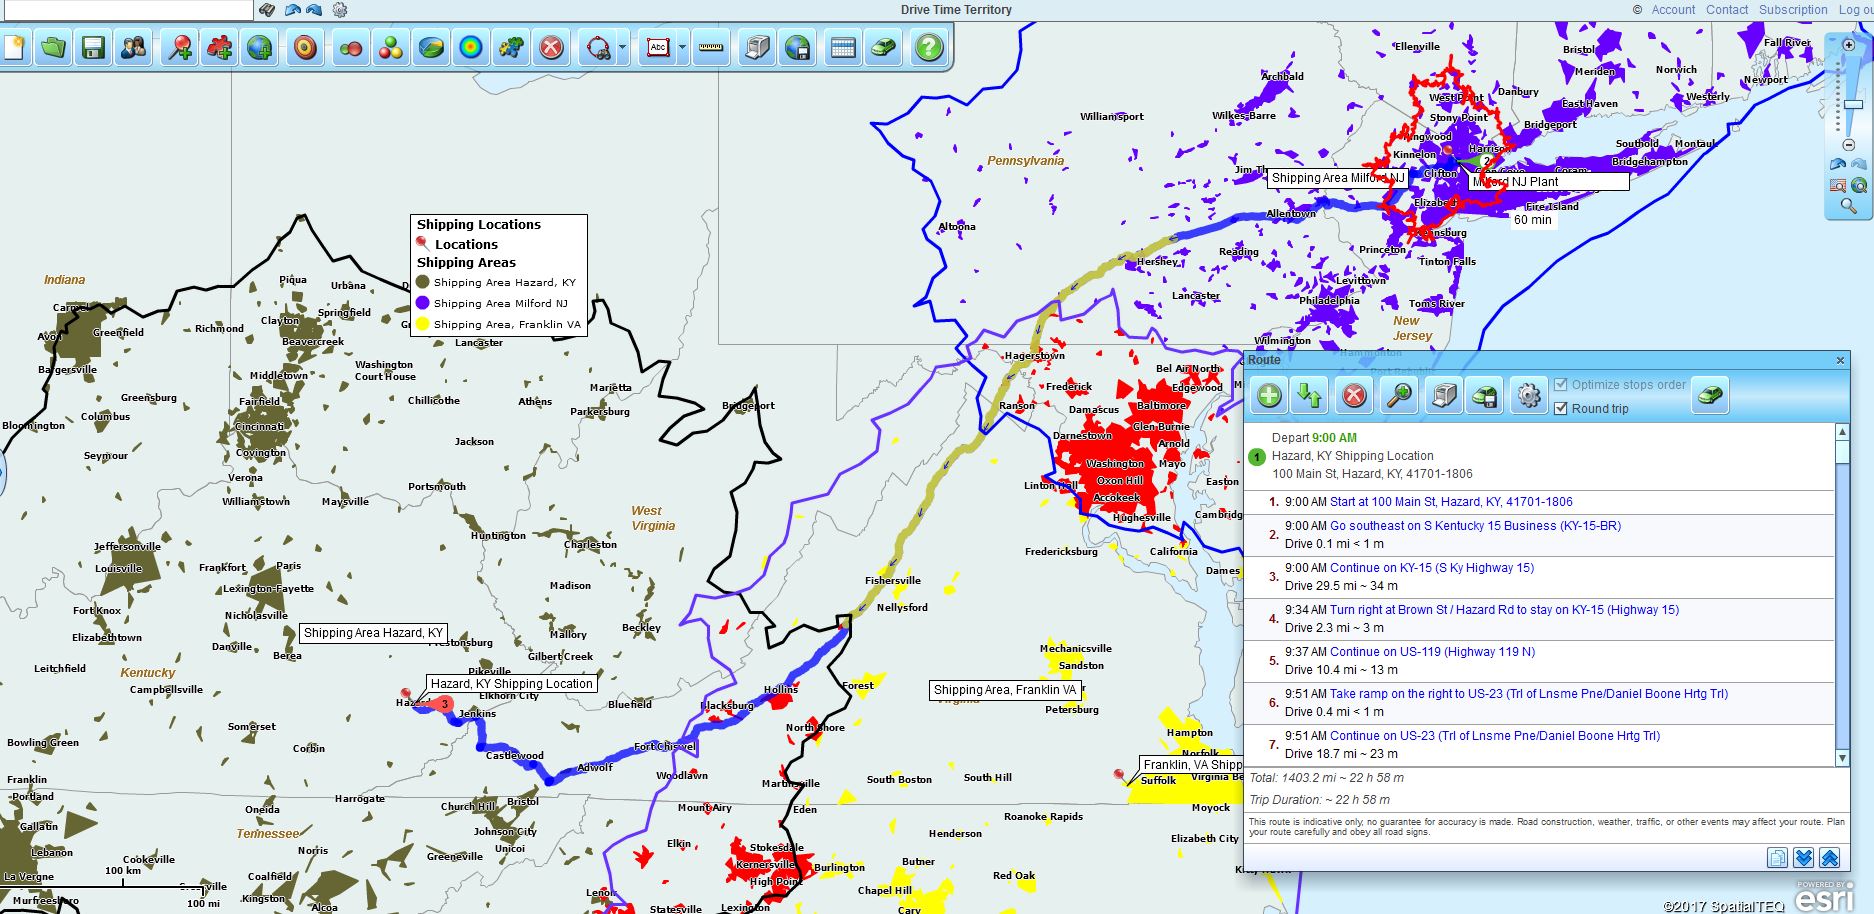
Using Drive Time Map Visualizations to Analyze Shipping Patterns

The Five Flex Fields
The next and final dialog page in the importing process lets the user choose which column of your data will be in the Left-Hand column of the Data Window. You’ll see the Unique Identifier field here. Finally, the user can also choose which columns of your data will be represented in the five flexible fields of your pop-up label. Once the data is placed on the map these flex fields will be displayed when you hover your cursor over an imported data point or when you click on a point and the label displays.

Now import your data and view the data on the map background. You’ll see colored dots on the map, and the Data Window will pop open, showing your data layer in full spreadsheet tabular view in MapBusinessOnline. MapBusinessOnline will ask if you want to color-code – don’t feel obliged to do so. You can always color-code from the master toolbar later. You’ll see the symbol feature on the Data Window toolbar if you want to change the assigned symbol immediately.

Try It Again
If you don’t like how your import went, delete the layer in Map and Data and start again. It just takes a couple of seconds. Or import the layer a second time; no one will arrest you.

Callouts are Labels
Once you see your data points on the map as colored balls, you can start thinking about color-coding the data or turning on the data callouts or labels.

Each point of your data will display a label when you touch or click the point with your cursor. To turn all Callouts or labels on, move your cursor to Map and Data and hover over your imported layer. Click the Edit Dataset Properties Gear and choose the Callout Tab on the right. Here, you can manipulate the Callout options like Compact Callouts and Open all Callouts.

Edit, Add and Delete
Finally, the user can add records to their imported data or edit and delete records in their data layer. Use their cursor to select one of their imported points. Choose the Edit Location Properties button or Delete selection options in the mini-toolbar that pops up. Delete is a pretty straightforward yes or no decision.

Editing a point is more complex. It opens a dialogue that includes the basic data fields associated with your map point. You can edit those fields.

To add a data point to your imported map layer, you can either:
1. Type the address into the address bar in the top upper left corner of the application and then click the Binocular button or
2. Choose the Add Location button from the Draw Layer tools located next to the Ruler along the master toolbar. Drop a point on the map where you want to add a record.

Once your point is established on the map, click the Copy Location to Dataset button, follow the dialog for adding a record to your dataset of choice, and add that location to the map. This is a multistep process. First, choose the Dataset to append, then choose to copy or add the location.

You are now an official MapBusinessOnline Data Import Wizard. Walk the Earth with your head held high.

_______________________________________________

Find out why over 25,000 business users log into www.MapBusinessOnline.com for their business mapping software and advanced sales territory mapping solution. The best replacement for Microsoft MapPoint happens to be the most affordable.

To access MapBusinessOnline, please register and then download the Map App from the website – https://www.mapbusinessonline.com/App-Download.aspx.

After installing the Map App, the MapBusinessOnline launch button will be in the Windows’ Start Menu or Mac Application folder. Find the MapBusinessOnline folder in the Start Menu scrollbar. Click the folder’s dropdown arrow and choose the MapBusinessOnline option.

The Map App includes the Map Viewer app for free non-subscriber map sharing.

Please read customer reviews or review us at Capterra, or g2crowd

Contact: Geoffrey Ives geoffives@spatialteq.com or Jason Henderson jhenderson@spatialteq.com

Posted in Business Mapping Software blog post, How to instruction, Sales and marketing | Tagged , , , , , | Leave a comment

Creating a Demographic Profile by Zip Code

Once again, a business mapping customer inquiry led me to a new application for MapBusinessOnline. Coincidentally I’d been dancing around this particular solution with a couple of retail chain customers. Let’s imagine you’ve launched a new fast food restaurant in a city where you live and the whole concept has legs.

Your fast food restaurant sells affordable organic sandwiches and light meals in a drive through setting. You’re going to franchise the concept and call it OnGo Organics.  To market your franchise concept, you need to develop a ZIP code based demographic profile that points to the areas around the USA that are most likely to successfully support a new OnGo Organics restaurant location. This process is retail demographic mapping or more simply, demographic analysis. You could think of it as a target market map — developing a map that identifies market targets.

Here at home, with the help of a survey, you’ve realized there are certain factors that  make your premier store a success.  You feel you’ve done well with customers whose household incomes are $95,000 per year or more. And your pretty sure a zip code with a population of 20,000 people is a minimum level sweet spot for optimum customer activity.

In MapBusinessOnline we can establish baseline data to support your map-based market analysis by importing demographic data layers for population and household income into your map view. In the Map Business Online Data Window we choose the Zip Code layer. We click the Choose Columns button in the lower left and create our demographic market analysis view from our All Columns Data options, Demographic Data – Population (2013), Medium Income (2013), and a calculated sum of incomes over $99,000 – the closest Census category to $95,000.  You could conduct the same analysis using Census Tracts, States or County map layers.

Filter Your Data

Still in the Data Window and on the overall ZIP code layer, I click the Filter Button. I added two criteria for a total of three filter criteria with arithmetic modifiers applied. Remember, the analysis is being conducted at the Zip Code level.  I set the filter modifiers like this:

Criteria 1 – General, Zip Codes, Modifier > 0

Criteria 2 – Demographic Data, Population (2013), Modifier  > 20,000

Criteria 3 – Demographic Data, Median Income (2013) Mod > $99,000

The filter result is a report showing the 358 ZIP codes around the nation that are a best fit for OnGo Organics franchises. I then clicked the Create a New Territory button on the Data Window tool bar, and created a business territory map of best ZIP codes across the county. I selected the OnGo Franchise Targets territory (so named) and colored the ZIP codes Red for easy viewing.

I also exported the OnGo Territory data out of MapBusinessOnline as a CSV file for reimport as a city listing. I imported that list and made city target points on the map. One reason I did this was to turn on the city labels, which make it easier to quickly see which cities we’ve set as premium franchise targets. This city view with labels turned on can become cluttered in places like Manhattan. Always consider map clutter before turning on all labels. The user can always associate critical data with each ZIP code label or point label.  In the labels I included extra data like, Commuters Traveling more than 35 minutes, and high % Hispanic population. Two positive factors driving customers based on our study.

In the end I opted for turning off the imported City labels and simply turned on the City layer from MapBusinessOnline’s Add Layer button. Hovering over a city point will reveal the key information a map viewer requires.

I now have a first pass Franchise development plan as a zip code map for business based on the demographic ZIP code profile of one very successful store location. This map can be shared as an interactive web map to solicit feedback from constituents.  Have your non-subscribing map viewers download the Map App which includes a Viewer App. Simply send these constituents an email with a Map Share link and when they click the link MapBusinessOnline launches for them as a view only map.

You can also export a CSV file report of demographic data by jurisdiction and include static images of regional or street level map views. MapBusinessOnline, a geo mapping software designed to make your business quickly and affordably location-aware.

We recommend users access MapBusinessOnline via the downloadable Map App.

The Map App install is fast and easy. The Map App is a cloud-based service, once you’ve logged in you’ll have access to all of your previously saved maps and data. The Map App is a better user experience and provides access to more features than the Web App. The Flash-based Web App link will remain available until December 15, 2020.

The Map App includes the new Map Viewer app for free non-subscriber map sharing.

Find out why over 25,000 business users log into www.MapBusinessOnline.com

Contact: Geoffrey Ives geoffives@spatialteq.com (800) 425-9035, (207) 939-6866

MapPoint users – please consider www.MapBusinessOnline.com as your MapPoint Replacement.

Please read customer reviews or review us at Capterra, or at Crowd Reviews.

Posted in Uncategorized | Tagged , , , , , , | Leave a comment

Display a Ratio Calculation On a Business Map


One of the things I love about my job is the way that customers constantly find new and interesting applications for our business mapping software. We receive constant inquiries from all types of businesses. Last Thursday was no exception and in fact included several new ways for me to apply Map Business Online. One of them was to display the ratio of 0 to 9-year old population (Census data) with available school capacities by Census tract.

Achieving this result on a business map required several steps. The easy steps included adding Census tracts to the Map from our premium map layers which are available on the full year USA subscription. I then added the customer provided data, created the formula in Map Business Online and color coded the map based on the results. Pretty exciting for a non-technical user like me.

Because the data the customer provided is private I can’t show you that map. But I will build another map using a ratio formula from Census demographic data available in Map Business Online and apply that to the zip code map layer. I will compare by division the total number of elder Americans to the total number of younger Americans. Map Business Online calculations enable either multiply or divide functions. The resultant ratio will be used to create a nationwide color coded zip code map.

Step 1 – Build the Calculation
Go to Map & Data and click the edit gear for the Zip Code layer – because our end result will be applied to zip codes. Choose Manage Calculated Data Columns.

Click the Add Data Column because you are adding a calculated data column. I selected the top five age brackets for Population 2013 Census data and moved them into the Numerator position in the formula using the right arrow. I then moved the bottom five youngest age brackets to the Divisor position. I made sure my format was set to number and that decimals was held at two places. I named the resultant Quotient-file Ratio “Buddards*/Rugrats” because I am slightly evil and grew up in a small town on the coast of Mass. Then I clicked Change Data Column.

That’s it. The formula is built. A whole new level of market analysis using Map Business Online.

Step 2 – Color code the Zip Code Layer
On the main toolbar I chose the Three Puzzle Piece button to color code the map. I chose the Zip Code layer. For data to color code by I dropped down and picked Calculated Data Column and then my saved ratio file – Buddards/Rugrats. I created my color range to show:

– Purple for zips with a ratio < 1/1 – Areas where Rugrats outnumber the Buddards
– Orange for zips with ratio higher than 1/1 up to 2 – Areas where Buddards beat Rugrats 2 to 1
– Blue for zips with a ratio from 2.1/1 to 10 – Higher number of older Americans vs. Rugrats
– Bright Red for zips with a ratio from 10.1 to 150 – Break out the shuffle board and Metamucil

I hid geographies that showed no results. I also imported a data set of health care centers to have that data on hand for the Buddards. I summarized that health data to show total licensed beds by zip code. And I appended calculated demographic totals for both Rugrats and Buddards and appended them to the zip code labels for reference when zoomed in.

Step 3 – Edit Your Legend
You’ve heard me say this before. Use the map legend to make sure your audience understands your map. Tweak that legend to remove superfluous and distracting text. Use your business jargon so your people understand.

Step 4 – Check Out Your Map Results
Here’s the map link.
You’ve created a map, now fly around, zoom in and out. See what your map tells you. The first thing I noticed was that in most parts of the country, the Rugrats are winning. That’s all the purple. However, if you fly into the Orlando, FL area you’ll find some nice bright red predominantly buddard zip codes to consider.

You can use Map Business Online to describe ratios or basic numeric relationships in your data too.
Footnotes:
*Buddards – A slang term meaning older people. Perhaps a reference to “Old Mother Hubbard eating her buttered corn”? Where ‘buttered corn’ was made to rhyme with Hubbard and eventually, in certain backward rural New England villages, was applied to the local vernacular as a substitute for ‘old woman.’ As in “A buttered corn is holding up the doughnut line at Oleana’s.” Also used as slang for a general older person of no specific gender, shortened to an ‘old buddard.’ As in, “That old buddard shouldn’t be driving to the dump alone.” See “The History of Rockport, Massachusetts” Chapter 7, the Buttered Corn.

Find out why over 25,000 business users log into www.MapBusinessOnline.com

Contact: Geoffrey Ives geoffives@spatialteq.com (800) 425-9035, (207) 939-6866

MapPoint users – please consider www.MapBusinessOnline.com as your MapPoint Replacement.

Please read customer reviews or review us at Capterra, or at Crowd Reviews.

Posted in Uncategorized | Tagged , , , , , | Leave a comment

Aggregate and Summarize Data in Your Business Map

The best business mapping software provides business data visualizations for businesses, usable by non-technical business people. You do not have to be a GIS expert, a map geek, or an IT pro to use business mapping or to create relevant and informative business maps. Business map users are business managers, business owners, non-profit professionals, or medical managers. The business mapping users I speak with are admins, new employees, or lone business people in sales or consulting. Virtually anyone can access and apply Map Business Online.

Business mapping tools are used for market analysis, sales planning, franchise management, territory management, field staff management and resource planning. In short, business maps supplement core business processes for the purpose of gaining and sharing location intelligence.

Business mapping is not as technical as you might think. It requires no programming experience. If you use Excel spread sheets you can build a business map. And, best of all, business maps are fun.

Summarize Your Data
By summarizing your imported data layers on the map you can create big picture visualizations of your business. The human mind viewing a map sometimes wants to see things in summary, as opposed to detail.

Once your data is imported into a tool like Map Business Online you can summarize columns of your data in various ways on the map. Your data is imported, stored, and displayed in business map tabular views, very much like a spreadsheet. All of your extra columns, in addition to addressing data, are accessible within the application. You can access your imported business data columns for:

• Color coding by symbols
• Color shading by geographies like zip code or county
• Summerizing totals by zip code, county or state
• Aggregating data totals into territory or district labels
• Summarizing by an object – a circle, polygon or drive time area

Using Symbols to Display Data
Business maps provide a library of symbols that the user can apply after they map sales data. Users can choose to display a static point or data value variations through colored symbols of varying size. An associated map legend will describe your preferred number schemes for the map viewer’s edification. In some cases, the symbols will allow numeric values to display. Alternatively, map viewers can view data values for any given point by hovering over that point, which will generate a pop-up info-bubble.

Symbols can be simple MapPoints or imported Jpeg picture files. The user can decide which symbols work the best at describing that particular data set. By adjusting the sizes of the symbols the map creator can show relative value to the map viewer. Map experimentation is encouraged in business mapping. Tweak your maps to make your business messages communicate effectively.
County Summarization

Color Coded Geographies
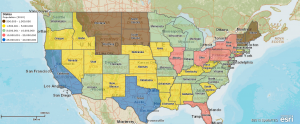
In this example, geographies are administrative district areas like zip codes, counties, or states. Business mapping software enables color coding by district based on a user’s imported data layers. Thus, you can import a layer of your business data, turn it off on the map, and then color code the districts based on the values aggregated within a group of zip codes.

For example, you could plot locations on a map for all sales accounts across the USA and color code the states based on the value of sales within each state. A legend can describe the value break down – Green for states with sales between $100,000 and $250,000. And you could hover over any state to see an info-balloon summarizing dollars for that state.

Further, you could actually edit the State label to include the aggregated dollar total for that state. This label aggregation display is very convenient. Think how helpful it is to have a critical business figure by state, county or zip code right there – available on the map for reference by you or your viewers. For instance, each zip code label could be appended with Census demographic data for that zip, like population or median house hold income.

More Summarizing Options
The option to summarize data aggregation is available in most business mapping software. So instead of displaying all the individual points you imported to the map, you could summarize those points by zip code or county. Here, each zip code (or county) would get one centroid point and all of the sales numbers would be totaled for that specific zip code.

Appending data values to your zip code, county or state labels still applies here. Consider what your audience needs to see on the map. What matters most to your map viewers?

Summarization of Data by Map Object
In mapping lingo, we often use the term geographic object or map object. What we mean is a geometric shape on the map. Map users create shapes on the map in order to spatially query your target data based on that map object or shape. So, in business mapping we offer tools like a radius search tool to create a circle X miles-wide, or a drive time tool to create a rugged, multi-edged polygon that represents driving in all directions for a given period of time. We then search these map objects to collect the data included within that map object.

Map Business Online presents a mini tool bar with each map object. That tool bar includes a summary button. The summary button (looks like a sideways M) will launch a summary tool that totals up your targeted data points for just that circle or drive time polygon. It works the same for plain polygons or free form shapes. And you’ll notice as you summarize how easy it is to add other data layer to this analysis, like Census demographic layer data. Once you’re done there’s an export button to share the data as a spreadsheet outside of the application.

In Summary
There are many options for summarizing your business data using a business mapping program. To summarize, maps are fun and they help describe the big picture of your business.

Find out why over 25,000 business users log into www.MapBusinessOnline.com

Contact: Geoffrey Ives geoffives@spatialteq.com (800) 425-9035, (207) 939-6866

MapPoint users – please consider www.MapBusinessOnline.com as your MapPoint Replacement.

Please read customer reviews or review us at Capterra, or at Crowd Reviews.

Posted in Uncategorized | Tagged , , , | Leave a comment