Map Visualization Tools in MapBusinessOnline.com

Map creators and viewers can visualize any location dataset imported into MapBusinessOnline in multiple ways. Let’s explore the possibilities for map visualization using MapBusinessOnline business mapping software.

User data could be imported or created using several data formats and subjects. Formats might include:

  • Address spreadsheets – Columns for Address | City | State |ZIP code
  • Latitude and Longitude coordinates – Lattitude 09899, Longitude 71.7714
  • Text files as long as the addressing has separate component columns.

Map creators could also create location-based datasets using these map business online features:

  • Business Listings search and download tools. Read more on Business Listings here.
  • Incremental ‘add a location with a callout’ placement using the address bar or draw tool point placements.
  • Calculated Data Columns, a feature that builds data columns by combining data through formulas. Read more here.

Once data has been imported or created, the dataset will display as location points on the map. The dataset will also appear in two other vital MapBusinessOnline functions:

  • Map and Data – Notice datasets listed in this floating checkbox. Turn datasets on and off with the click of a mouse. Read more about Map and Data.
  • The Data Window – Here, imported and created datasets display in tabular formats, like an Excel sheet within MapBusinessOnline. Filter, symbolize, export, and copy your data from the Data Window. The data window also provides the powerful Choose Columns function in the lower right of the user’s screen for database management and access to Demographic Data.
Map Visualizations Come in Many Shapes, Colors, and Sizes.

Map Visualizations of Your Data

Maps present data to map viewers. Map data is symbolized – represented on the map by a point or another symbol from the MapBusinessOnline symbol library.

Note: You can import your symbols using the Color Code by Symbols tool.

By ‘visualization,’ we mean creating symbolized, color-coded, and geographically organized views of your map data. MapBusinessOnline provides an array of tools to highlight your datasets to complement and support your map’s purpose.

Note: Always seek to create color-shaded and highlighted visualizations that are easy on the eyes and not obnoxious or distracting to the map viewer. Overdoing visualization through bright colors or too prominent symbols can detract from your map’s purpose.

MapBusinessOnline visualization tools include:

Color-code Point Layers – Great for plot density maps and defining types and numeric ranges by color or symbol size.

Color-code by Boundaries or Map Layers – Color-code City Limits,  5 and 3-digit ZIP codes, Counties, and Census tracts by imported data columns or demographic data. Read more about color-coding by Boundaries.

Heat Map – Sometimes, numeric values of imported data reflect monetary transactions. Sales activities will show up more frequently in more urban areas or areas with more retail outlets. Heat maps covert point location data into hot and cold spots on the map. Heats show the intensity of sales activity.

Symbolize with Charts and Graphs – Use charts and graphs to display year-over-year comparisons or similar subjects with variable data.

Color-code Using Circles – Circle color-coding enables numeric display on each point. Color-code by Circle provides a more nuanced, targeted data message to map viewers.

Use Draw Tools to Highlight Areas

In addition to color-coding dataset symbols on the map, a map creator can also use MapBusinessOnline draw tools to highlight specific areas or sections of the map—for example, a dataset of convenience stores plots to show points along a highway. A polygon shape with color could further highlight those retail stores chased fill.

Color-shaded polygons, circles, or drive-time areas emphasize imported map layers and areas of interest.

Map Layer Enhancements

For further map enhancement, consider adding a map layer. City limits boundaries define urban areas and town jurisdictions. Use other additional map layers that might be relevant to your map’s purpose:

  • ZIP codes – Demographic visualizations related to real estate, zoning, or politics. ZIP code maps can also be based on imported data – another kind of heat map.
  • Counties and Congressional Districts – Apply these for election results, law enforcement, or political statements.
  • States – Use for broad, general map reporting. We used states to show COVID spread during the pandemic.

Like map layer objects such as ZIP codes are easily combined in MapBusinessOnline to show territories or areas of interest. The most popular map layer for such an approach is ZIP5 codes, ZIP3 codes, counties, and city limits.

In MapBusinessOnline, territories, and areas of interest connect the map object view with database analysis, the core power of business mapping software. With territories comes the ability to analyze imported data against demographic and geographic data. Suddenly your area of interest becomes very interesting.

Note: C-suite Executives love business analysis.

Use your map objects and map layers wisely. Follow these general map creation rules, and your map may become more than just a customer map or route suggestion:

  • Stay focused on your map’s business purpose.
  • Do not clutter your map with superfluous map objects and data.
  • Avoid bright and oversized map symbols.
  • Don’t try to solve all business problems with one map.
  • Save important map work as a My Template map to protect it from overwriting.
  • Show your map to a colleague for feedback before you take it to a meeting.
  • Spell-check your map text and relabel imported layers to connect them to your map’s purpose.

Follow these words of map wisdom, and you’ll know when it’s time to get that Map Geek tattoo on your arm, leg, or back. Just don’t clutter the tat.

_______________________________________________

Discover why over 25,000 business users log into www.MapBusinessOnline.com for their business mapping software and advanced sales territory mapping solution. The best replacement for Microsoft MapPoint happens to be the most affordable.

To access MapBusinessOnline, please register and download the Map App from the website – https://www.mapbusinessonline.com/App-Download.aspx.

After installing the Map App, the MapBusinessOnline launch button will be in the Windows Start Menu or Mac Application folder. Find the MapBusinessOnline folder in the Start Menu scrollbar. Click the folder’s dropdown arrow and choose the MapBusinessOnline option.

The Map App includes the Map Viewer app for free non-subscriber map sharing.

Please read customer reviews or review us at Capterra or g2crowd.

Contact: Geoffrey Ives at geoffives@spatialteq.com or Jason Henderson at jhenderson@spatialteq.com

Posted in Business Mapping Software blog post, How to instruction | Tagged , , , , | Leave a comment

Add Value to Your Business Map Using the Search & Draw Tools

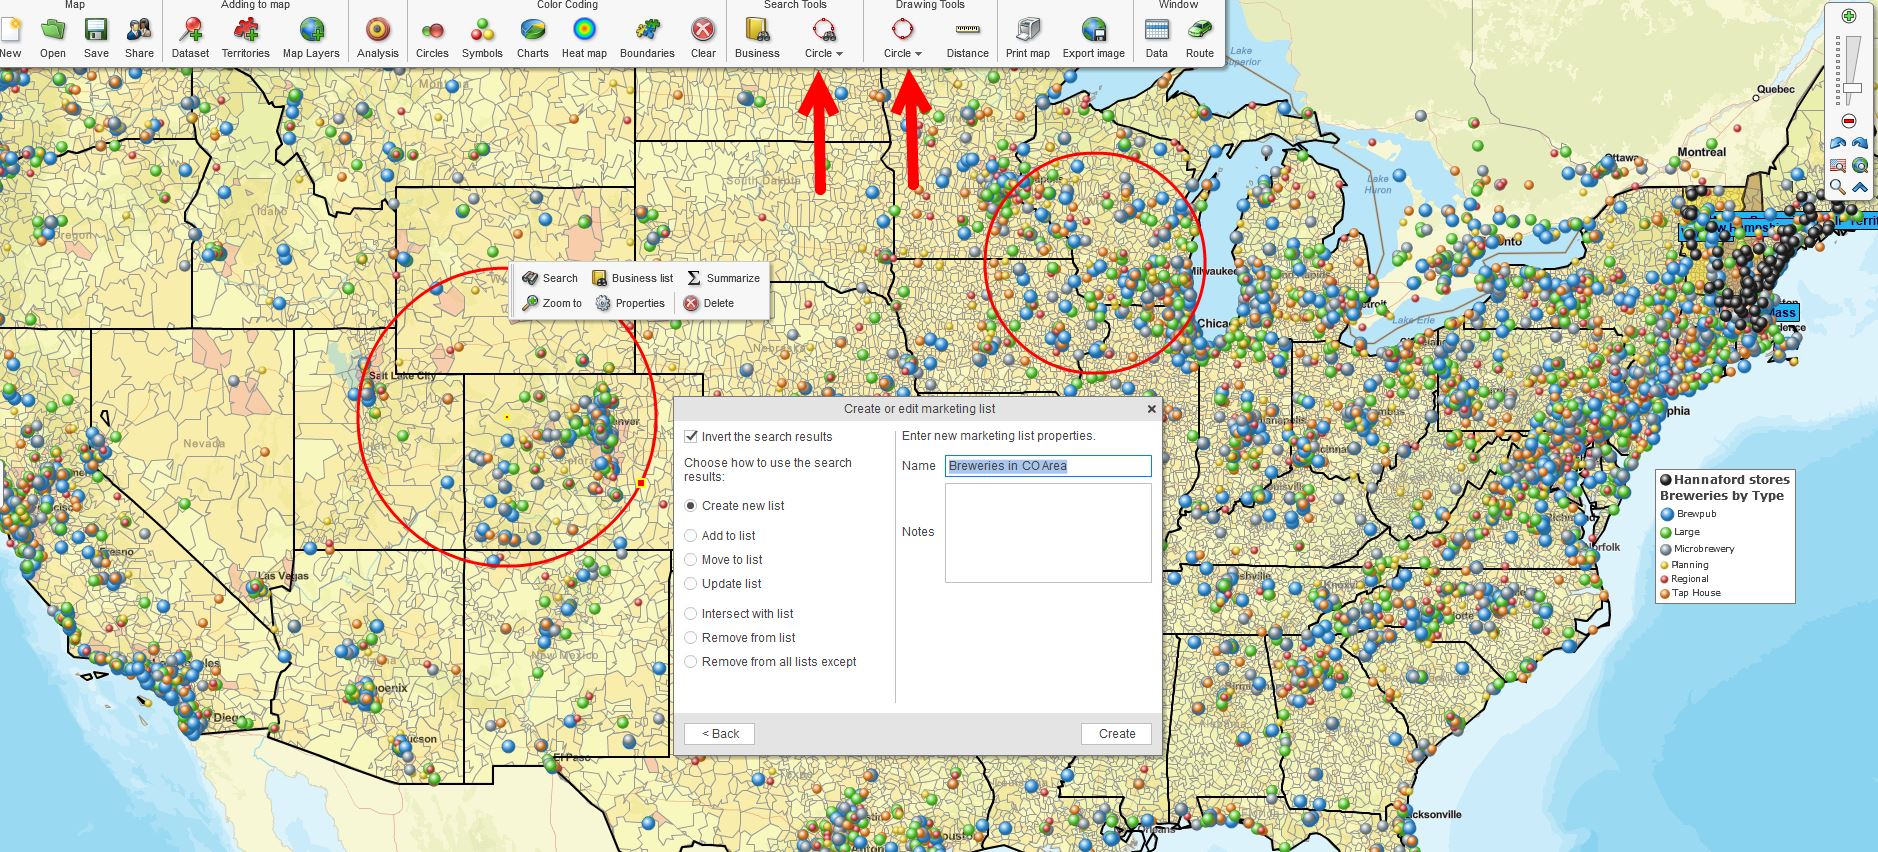
MapBusinessOnline presents two drawing tools along the Master Toolbar of our business mapping software:

  1. Under Search Tools, the user will find a Circle Icon and a dropdown arrow displaying the circle tool and, if you drop down, all the other Search Tools – polygon, drive time, and free form.
  2. Just to the right of the Search Tools are the Drawing Tools, which also show the Circle tool (or the most recent tool used) and a dropdown for all the drawing tools.

Draw Tools and Search Tools in MapBusinessOnline

The difference between the two tools is that the Search Tools offer a quick popup menu that searches all MapBusinessOnline map layers, such as ZIP codes or Counties, and imported data layers.

The Drawing Tools also provide line drawing tools and access to a Text Box feature for placing text anywhere on the map. We call these drawn circles, lines, and polygons Map Objects.

Be Sure Your Map Object Adds Value

Use the Draw/Search tools to add value to your map project. Adding value to a map means you are adding relavant information to the map that enhances your map’s purpose. Don’t add map objects just to be clever. Do not create distracting map clutter. Keep your map focused on the problem at hand.

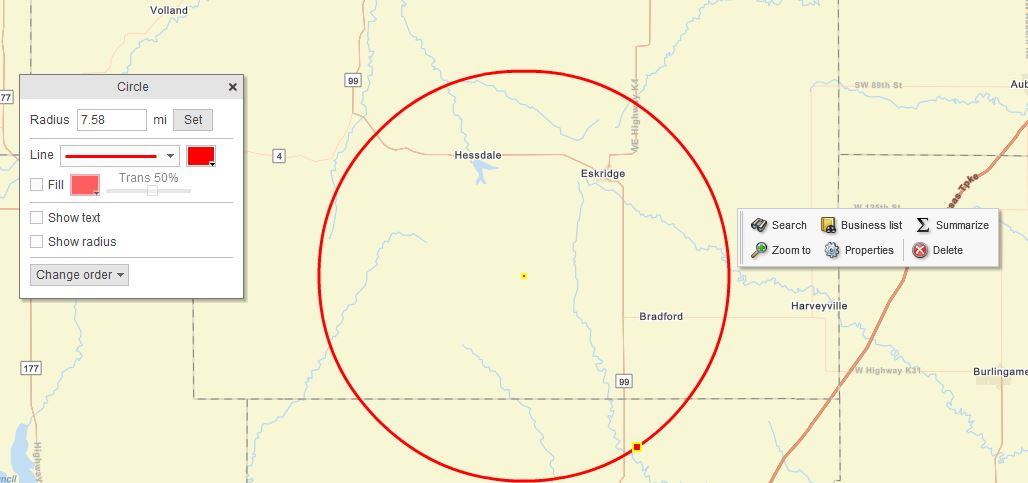
Both the Search Tools and the Draw Tools provide a menu of map operation options that looks like this:

Search & Draw Tools Operations Menu

Map Operations Available from Drawn Map Objects

When an object is drawn on the map, a menu of operations appears. The drawn object could be a circle, line, or polygon, but the options will all be the same:

Search – A pair of Binoculars icon represents a search option. In Draw, this option functions the same as the immediate Search offering using the Search tool. It allows the user to search map layers (like ZIP codes) or imported data layers like a list of customers. Such a search will return all records within the drawn object as a list in the Data Window. For returned imported data searches, we refer to those results as a Marketing List. You could say the Search is a Spatial Search resulting in a Marketing List.

Please note that for any such spatial search, there is a check box at the top of the dialogue that lets the user choose between Search within the drawn object or for all records outside the drawn object. We call that an Inverted Search.

Zoom To – Click the Zoom-to button, and the map extent view will shift, in or out, to include the entire map object.

Business List – You can search for, purchase, and download business listings from within MapBusinessOnline. This button enables the business listings tool to search for listings you select from within your drawn polygon or circle. Read more about business listings here.

Properties – This button opens a separate dialogue which lets the user adjust the look and feel of the drawn object itself. The user can change color, line thickness, object fill color, and transparency. Circle radii are adjustable by the map creator, and text additions are optional. In the picture above, Properties is the box on the left.

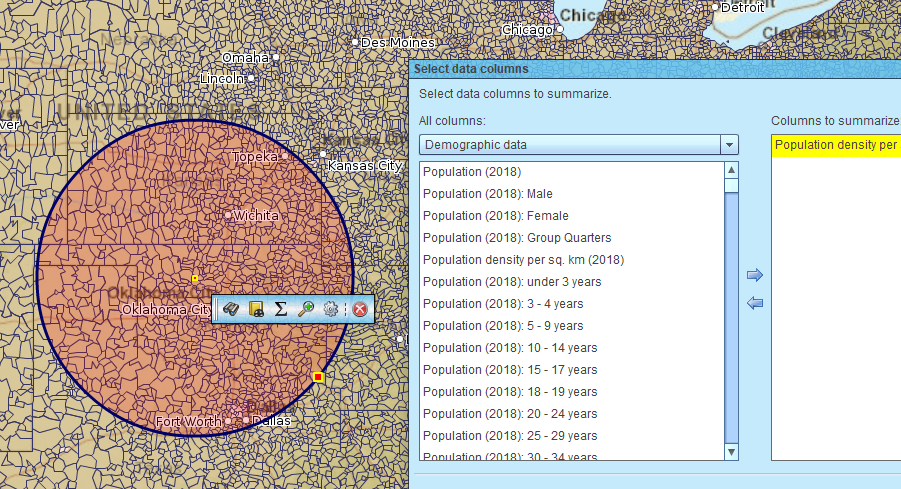
Summarize (Sigma Sign) – This powerful tool provides direct access to Demographic Data, Imported Data, and Calculated Data Columns. The map creator can access these datasets and quickly move columns into a basic spreadsheet for export or placement on the map. The Summary option is a fast way to collect data for a specific area. It adds value to your map.

Delete – You guessed it. You can also delete the drawn map object, no questions asked.

So, in general, Search Tools are spatial searches that offer a quick way to grab data for a specified shape or area of interest on the map. Draw tools can provide the same with another click or two. Draw tools focus more on drawing business maps’ areas of interest, which add value to the overall map project.

Searching for Customers in Colorado

I use Search Tools to gather customers or prospects in an area. I use draw tools to highlight an area of interest, like a bird nesting area or a hiking path. Use these tools to add value to your business map.

_______________________________________________

Discover why over 25,000 business users log into www.MapBusinessOnline.com for their business mapping software and advanced sales territory mapping solution. The best replacement for Microsoft MapPoint happens to be the most affordable.

To access MapBusinessOnline, please register and download the Map App from the website – https://www.mapbusinessonline.com/App-Download.aspx.

After installing the Map App, the MapBusinessOnline launch button will be in the Windows Start Menu or Mac Application folder. Find the MapBusinessOnline folder in the Start Menu scrollbar. Click the folder’s dropdown arrow and choose the MapBusinessOnline option.

The Map App includes the Map Viewer app for free non-subscriber map sharing.

Please read customer reviews or review us at Capterra or g2crowd.

Contact: Geoffrey Ives at geoffives@spatialteq.com or Jason Henderson at jhenderson@spatialteq.com
Posted in Business Mapping Software blog post, How to instruction | Tagged , , , , , , | Leave a comment

Segment Your Imported Location Data by Demographically Defined Areas

An exciting application for MapBusinessOnline Pro came up this week. The customer was unwilling to share their name as a case study. Consequently, I will describe this business mapping software process generically.

Our client had a significant nationwide list of job sites she wanted to segment by county population totals.

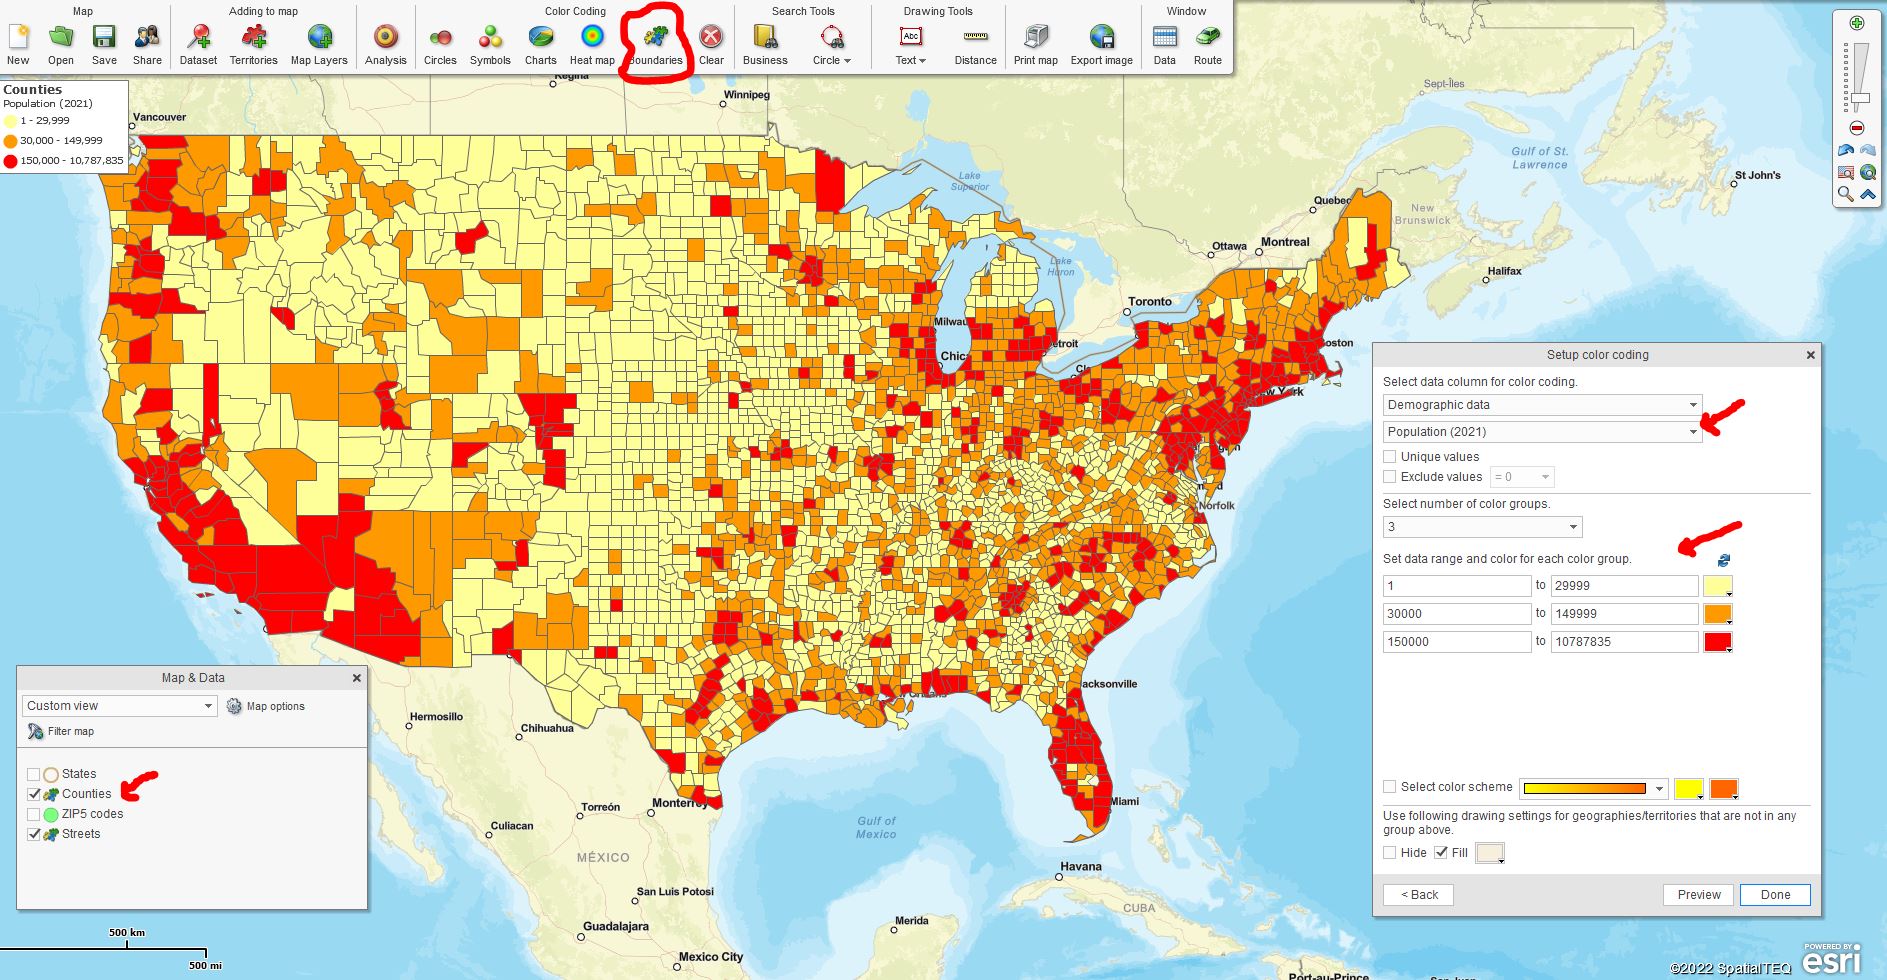
The customer began her business map analysis by creating a color-coded, county-based demographic map of the USA. She divided the counties into three color shades:

  • Yellow – for counties with 2021 Populations under 29,999 people.
  • Orange – for counties with 2021 Populations from 30,000 to 149,999.
  • Red – for counties with 2021 Populations of more than 150,000

The above color-shading is easily achieved in MapBusinessOnline using the Color-Code by Boundaries option on the master toolbar. Read more about color-coding by boundaries here. Demographic mapping is one of the many benefits MapBusinessOnline provides for its loyal subscribers.

The customer used the above map as an informational map view of the USA Population by County. She can share the FREE map interactively through Public map sharing, requiring the map viewer to register and download the Map App. But there is no charge for the map sharing service.

Color-code Counties by Population Using MapBusinessOnline

The customer had also imported a significant location dataset of several thousand nationwide job sites. It was the customer’s goal to be able to export that same list of job sites and segment them by the population scheme we’ve described above. In this way, her goal was to export a dataset of the job sites segmented by population. This requirement was a little trickier than the color-code requirement.

Create Territories by Population

To segment imported location data points based on population, we first needed to create three territories based on population. Sales territory mapping is another popular solution available through MapBusinessOnline. We accomplished this in the Data Window view. The instructions are as follows:

  1. With the Data Window up, select the County layer.
  2. Select the Choose Columns button in the lower left.
  3. In the dropdown on the left side, select Demographic Data and then Pop 2021. Use the Right Blue Arrow to move the Pop 21 into the analysis.
  4. Click the Choose Columns button closed.
  5. Next – Choose the Filter button on the Data Window toolbar. We are going to create territories by population. You should, at this point, clear the previously arranged Color Coding (Clear White X button on the Master Toolbar) from the County layer to enable territories by the county to display. To set up the first territory, in the dropdown, select Demographic Data and then Population 2021.
    1. In the Modifier section on the right, choose <= (greater than and equal to) and input 29,999. Click Filter. This action has filtered the counties to show only counties with 30,000 people or less.
    2. Click the New Territory button on the Data Window toolbar.
    3. Name the Territory and Save it. I would name it descriptively – ‘Counties w/Pop up to 29,999.’
  6. Repeat the filtering process. Return to the filter button view.
    1. On the existing filter, change the modifier to be > 30,001.
    2. Click the Add filter button, and again select the Demographic Population 2021.
    3. This time in the modifier, select <= (less than or equal to) and input 149,999.
    4. Run the filter.
    5. Create the new territory and name it.
  7. Finally, repeat the filtering process.
    1. Remove the second filter.
    2. In the remaining filter, change the modifier to > and input 150,000.
    3. Run the filter, save, and name the third territory.
  8. With Territories created, we can now export our data and segment by territory.
    1. In the Data Window view, select the data layer to be exported – Job Sites in this case – and click the Export button on the far right of the Data Window toolbar.
    2. Select Segment Data Records by Territory.
    3. Click Next.

The exported report (CSV File) will list all construction site locations segmented by territory. The territories, in this case, represent demographic segments. Be sure the territory names reflect the demographic population segment as filtered.

For some reason, this construction company required a list of job sites arranged by population. Your business might require segmentation by some other demographic category or location dataset. You will note the attached video is based on age ranges. The above-noted approach could be valuable in such cases.

_______________________________________________

Discover why over 25,000 business users log into www.MapBusinessOnline.com for their business mapping software and advanced sales territory mapping solution. The best replacement for Microsoft MapPoint happens to be the most affordable.

To access MapBusinessOnline, please register and download the Map App from the website – https://www.mapbusinessonline.com/App-Download.aspx.

After installing the Map App, the MapBusinessOnline launch button will be in the Windows Start Menu or Mac Application folder. Find the MapBusinessOnline folder in the Start Menu scrollbar. Click the folder’s dropdown arrow and choose the MapBusinessOnline option.

The Map App includes the Map Viewer app for free non-subscriber map sharing.

Please read customer reviews or review us at Capterra or g2crowd.

Contact: Geoffrey Ives at geoffives@spatialteq.com or Jason Henderson at jhenderson@spatialteq.com


Posted in Business Mapping Software blog post, How to instruction | Tagged , , , | Leave a comment

Why ZIP Code Territory Maps are Preferred

MapBusinessOnline enables the creation of digital sales territory maps through an affordable cloud-based digital mapping service. Sales territories define areas of account responsibility for salespeople. Sales territories are also a platform for calculating anticipated or projected sales revenues for a specific area of interest.

Map users create sales territories using business mapping software in various ways. Here are most of the territory creation schemes that we run across:

  • Create territories by state, county, or ZIP code map alignment layer. In MapBusinessOnline city limits and ZIP 3’s are sometimes used as well.
  • Generate ZIP code-based territories by a range of ZIP code numbers.
  • Create hand-drawn polygons of territory areas unrelated to map alignment layers.
  • Generate drive time or driving distance polygons and use those boundaries for territory creation.
  • Generate specified radii around a set of points – circle territories.

While MapBusinessOnline does provide the ability to create hand-drawn map objects – a circle or polygon – this is not our recommended method for territory creation. Hand-drawn map objects are inaccurate and difficult to attribute to relevant sales territory data – such as revenues, demographic makeup, and other numeric criteria. To generate sales territories with supporting numeric data use a map alignment layer for your territory boundaries.

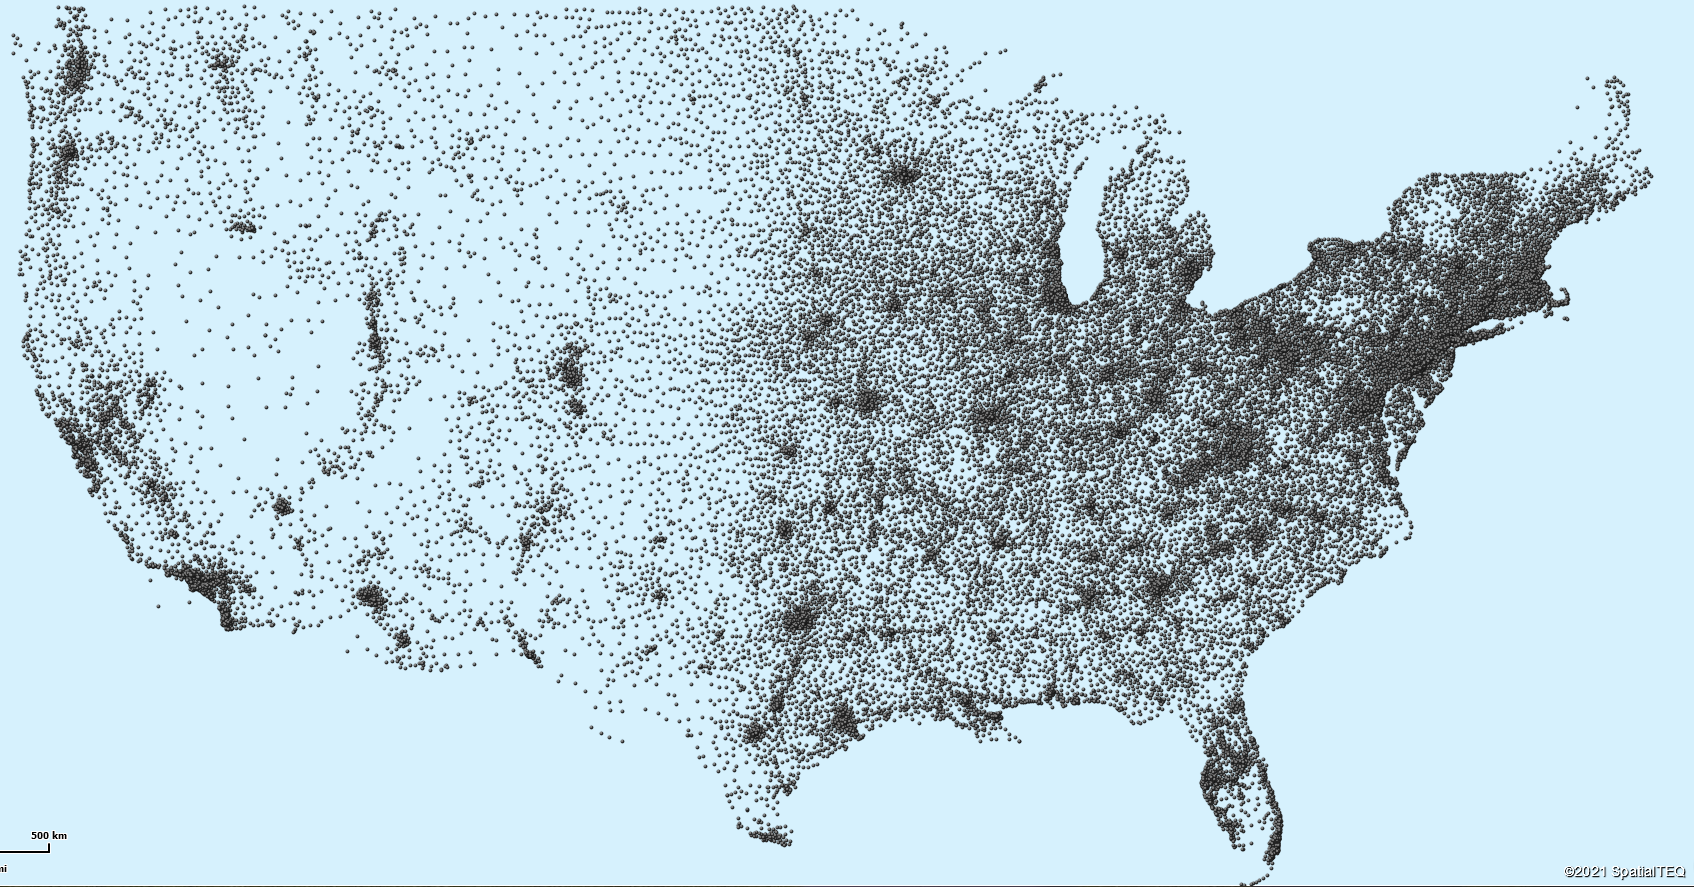
A ZIP Code Points Only Map Using MapBusinessOnline

ZIP Code-Based Sales Territory Maps

MapBusinessOnline applies map layers’ beautiful and elegant power to the practice of sales territory map creation. The ZIP code map alignment layer is far and away the most popular sales territory basis.

Let’s examine how a ZIP code map layer enhances the power of sales territory maps.

The United States has a complete and stable collection of 33,353 ZIP codes with boundaries. There are an additional 7,635 point ZIP codes for a total of 40,991 ZIPs as of this writing. Point ZIP codes represent large mail stop deliveries like skyscrapers or assisted living centers.

Don’t bother memorizing the number of ZIP code totals because they change yearly as the Post Office realigns delivery options.

MapBusinessOnline provides the ZIP code boundary map layer in part for creating sales territories. ZIP codes are a compact and familiar geographic jurisdiction. ZIP code population counts are supported by the Census Bureau and lend themselves nicely to territory creation. ZIP codes are great for territory creation because:

  • ZIP codes are generally small, offering manageable building blocks for larger territory schemes.
  • ZIP codes are known areas familiar to locals. They provide sales knowledge and travel familiarity.
  • Demographic category estimates from the Census Bureau accommodate ZIP codes, counties, and states in an orderly, cumulative fashion.
  • ZIP codes provide more territory balancing opportunities because there are many more of them than counties or states. Counties and states are often too large an area for fair and balanced territory assignment.
  • ZIP codes offer more reasonable drive times than counties or states.
  • ZIP codes are unique numerically vs. counties that repeat names across state lines. There’s only one 01966, but there are multiple Essex Counties across the USA.

Because ZIP codes are relatively compact mail delivery zones, they tend to offer more manageable areas for sales account responsibility. Counties can be too vast for traveling salespeople to traverse in a day. Here in Maine, the largest, most northern county named Aroostook is commonly referred to as ‘The County.’ It’s just not an efficient trip up there, no matter how you look at it. Other states have similar county challenges.

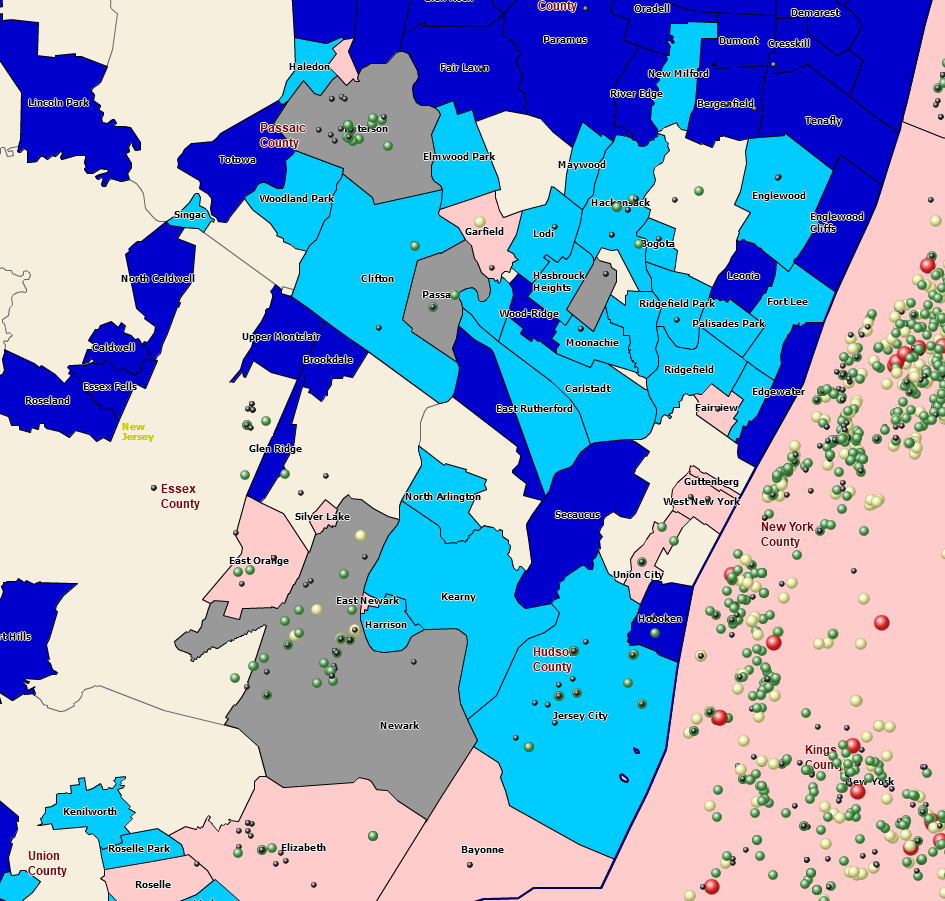
Create ZIP code Territory Map near Essex County, MA

MapBusinessOnline sales territories based on ZIP codes or other map layers automatically include a Data Window tabular view. This view presents a data sheet view of each territory and includes:

  • Map layer information – ZIP code, County, FIPPs codes, etc.
  • Relevant demographic data as selected by the map creator.
  • Imported appropriate sales data columns.

Read more about setting up and optimizing your sales territory Data Window view.

An Alternative to Radius-Based Territory Maps

Some companies come to us with a requirement for radius-based or circle territories. You can undoubtedly draw multiple radii on a MapBusinessOnline map. You can associate a text label with each circle too. But using drawn map objects for territory assignment offers limited territory functionality.

A better way to approach the challenge of radii-based territory maps is to allow the radius of each object to query the ZIP codes associated with that area. Allow the ZIP code query result to represent the territory for each radius.

Drawn circles will provide rough demographic estimates at best, while selected ZIP codes will offer more accurate demographic totals by territory.

Zip codes will tend to be more driver-friendly as they follow town and enclave boundaries. That said, many areas where rivers and mountains disrupt territory maps, making it challenging to justify assignments.

The process for creating one radii-based ZIP code territory in MapBusinessOnline is:

  1. Use the Radius Search tool to create a circle object on the map.
  2. Click Search in the menu of action options.
  3. Select the ZIP code map layer for a search target. Click Next.
  4. Name the Territory. Click Create.

Please note to temper the ZIP code assignment and avoid grabbing ZIP codes that are not intersecting the circle with most of its area. To adjust the Map Options Search criteria:

  1. Go to Map and Data Map Options
  2. Click Edit Search Options
  3. Choose whether or not you desire your target ZIP codes to Intersect, Interest at 50%, or are Fully Inside the territory circle.

Additionally, you can import a list of multiple radii and create multiple circle territories at once using the first option, Search and Segment Data from Multiple Centers, in the Analysis button. Please note you can include a column in your territory data import Excel sheet for radii.

Read more about multiple territories from multiple radii here.

Overall, we recommend that users create sales territory maps using the available map layers in MapBusinessOnline. You be happier, and your family will be happier. Well, your family will still be there, anyway.

_______________________________________________

Discover why over 25,000 business users log into www.MapBusinessOnline.com for their business mapping software and advanced sales territory mapping solution. The best replacement for Microsoft MapPoint happens to be the most affordable.

To access MapBusinessOnline, please register and download the Map App from the website – https://www.mapbusinessonline.com/App-Download.aspx.

After installing the Map App, the MapBusinessOnline launch button will be in the Windows Start Menu or Mac Application folder. Find the MapBusinessOnline folder in the Start Menu scrollbar. Click the folder’s dropdown arrow and choose the MapBusinessOnline option.

The Map App includes the Map Viewer app for free non-subscriber map sharing.

Please read customer reviews or review us at Capterra or g2crowd.

Contact: Geoffrey Ives at geoffives@spatialteq.com or Jason Henderson at jhenderson@spatialteq.com
Posted in Business Mapping Software blog post, How to instruction | Tagged , , | Leave a comment

MapBusinessOnline – Business Mapping Software for Any North American Business

Blogging weekly about location data, business mapping software, and territory mapping has its challenges. Fortunately, I have a great source of topics to write about – MapBusinessOnline.com.

MapBusinessOnline Standard, Team, and Pro versions have secured a place in the business mapping software market. We provide your average business person with the ability to apply various advanced mapping functions to their business processes.

While our functionality as business mapping is an affordable step below a complete geographic information system, the software enables access to sales and marketing-focused mapping technologies, perfect for a LinkedIn professional. There is no need to pursue a degree in mapping or even extensive experience using mapping software for you to derive profound location-based benefits from the tools we provide.

I think it is essential to list the features and benefits available to MapBusinessOnline subscribers occasionally.

As a suite of products and services, MapBusinessOnline provides businesses with access to these general mapping capabilities:

Sales Territory Mapping, including support for regions and divisions.

  • Define territories by ZIP code, county, city limits, and more.
  • Balance workloads and compensation programs by revenue or customer demography.
  • Visualize areas of accountability, customers, and prospects against USA & Canada maps.

Import and Color-Code Location-based Data.

  • Color-code and symbolize location datasets. (Up to 250,000 points.)
  • Import your own symbol sets.
  • Filter, segment, and export location-based datasets.

Create Informative Map Visualizations

  • Build customer maps, ZIP code maps, Radius maps, and more.
  • Print capabilities, including the ability to print large format prints from PDF files.
  • Share map files as Jpeg, PDF, or PNG image files.

Access to downloadable Business Listings

  • Great for competitor maps.
  • Includes firmographic data.
  • Sourced from one of the USA’s largest database suppliers.

Access to Demographic Data from the USA and Canada

  • Pull demographic data categories into demographic analysis maps.
  • Create ZIP code demographic profiles for market analysis.
  • Create quick and exportable demographic spreadsheets through the Summary button.

Radius Search Summary Button for Demographic Data

Conduct Driving Time and Distance Analysis – one-off calculations or multiple-point dataset analysis

  • Drive time and distance polygon creation.
  • Drive time-based market analysis tools. (Pro)
  • Drive time and distance marketing analysis. (Pro)

Optimized Vehicle Routing Tools

  • Optimized vehicle routing for one car at a time, up to 150 stops.
  • Share route files – CSV, GPX, HTML, ITN, PDF.
  • Print and share turn-by-turn directions.

Team/Enterprise Subscriptions

  • Set up collaborative team map editing.
  • Access volume purchase discounts.
  • Includes administrative access.

Conduct Proximity Searches

  • Search and segment data between two location datasets. (Pro)
  • Search for the nearest 1 to 20 locations across two datasets. (Pro)
  • Export drive time and distance results via CSV files.

Enrich Imported Location Datasets

  • Access various geographic categories – ZIP codes, counties, city limits, states, and FIPPs data.
  • Location data enrichment, filtering, and creation tools. (Pro )
  • Add demographic data to imported location datasets.

The above-noted systems and functionality allow the MapBusinessOnline subscriber to create an assortment of business maps, including these popular map types:

Still, because we don’t always know what you require, business mapping software is a flexible tool. Almost anyone in your organization can apply it. It requires only a location component like an address list for it to work. Import your address Excel sheet, a list of ZIP codes, or a set of latitude longitude points and start mapping today. That’s the ticket – connect your business’s location data with MapBusinessOnline, and you too will have something to blog about.

_______________________________________________

Discover why over 25,000 business users log into www.MapBusinessOnline.com for their business mapping software and advanced sales territory mapping solution. The best replacement for Microsoft MapPoint happens to be the most affordable.

To access MapBusinessOnline, please register and download the Map App from the website – https://www.mapbusinessonline.com/App-Download.aspx.

After installing the Map App, the MapBusinessOnline launch button will be in the Windows Start Menu or Mac Application folder. Find the MapBusinessOnline folder in the Start Menu scrollbar. Click the folder’s dropdown arrow and choose the MapBusinessOnline option.

The Map App includes the Map Viewer app for free non-subscriber map sharing.

Please read customer reviews or review us at Capterra or g2crowd.

Contact: Geoffrey Ives at geoffives@spatialteq.com or Jason Henderson at jhenderson@spatialteq.com
Posted in Business Mapping Software blog post, Sales and marketing | Tagged , , , , , | Leave a comment

Location Dataset Enrichment Using MapBusinessOnline Pro

You may be wondering why anyone would use business mapping software to enrich their location data. That all depends on how location-based your data and your business may be.

Startup businesses focused almost exclusively on products and services may initially not realize the nature of their location data. When potential customers start requesting price quotes or services from over the mountain, that location suddenly has real meaning for a business.

An organic, natural fast-food restaurant in downtown Gotham focuses on its list of core clients from the surrounding area – roughly a 20-minute drive time from Organic Beast’s drive-through window. But when they realize their success is on fire and they begin to consider selling franchise locations across California, well then suddenly, location means everything to them.

New locations will need to be explored for a business such as Organic Beast. And to do that, franchise location criteria will need to the developed. ‘What are franchise location criteria?’ You ask.

The below location-based assets are beneficial for justification of the purchase of a franchise restaurant business, or any other franchise business type for that matter:

  • An actual customer address list.
  • A prospective customer address list.
  • A typical customer demographic profile, possibly including:
    • Most common ethnicities.
    • Predominant marital status.
    • Median Income levels.
    • Drive-time tolerance.
  • Other customer characteristics that are specific to your business type. A restaurant might target families, and a hardware store might target contractors.
  • A sense of a sales territory size – a geographic area, ZIP codes, or population limit.
  • Related industry resources.

Another franchise sales consideration is targeting a specific area of interest with multiple territories designed and tied to the franchise location criteria. Maps are an excellent tool for enticing franchisees to buy. Color-coded critical population areas can show market potential. Be sure to mark and map nearby anchor stores or related tourist attractions. Make your map sing to the business need.

In short, don’t even try to sell a franchise without developing relevant map-related images and graphics. Maps sell franchises – that’s an online mapping software fact.

Enriching Your Business Datasets

MapBusinessOnline Standard enables the import of location-based data, which places color-coded symbols on the map with a linked datasheet view of the data. Those location datasets are usually customer addresses in our business mapping software world. They include sales information, client home locations with clinician data, or other data related to a particular industry. It all adds up to franchise location criteria.

MapBusinessOnline Pro provides the ability to enhance those imported spreadsheets by pulling over columns from other datasets. Your data is imported into MapBusinessOnline and then appended with columns from related location-based data.

Imported location data columns are accessible for other data layers using drive time analysis tools. Let’s search for imported records within 50 minutes of a set of stores. The data query results can then be merged with the store location dataset.

Data Enrichment is a set of features in the Analysis Button. Scroll down the list to the Summarize or Enrich section. Choose between:

  • Aggregate Customer Data – use this tool to pull sales data or other columns of numeric data from an imported dataset.
  • Summarize Demographics – Pull in three columns of relevant demographic data from the MapBusinessOnline demographic data library. Repeat as necessary for more columns.
  • Enrich a Dataset – Append data with demographic or geographic data as required. Geographic information includes ZIP codes, counties, city limits, and other map layers.

Data enrichment is helpful in enticing franchise clients. Take some time to explore your location data and investigate other data sources that can be merged with existing datasets to show additional value.

Try to include statistics relevant to your franchise business. Maybe house sales are brisk in the area where your business focuses its marketing messages. Perhaps include average sell prices or the pace of housing sales. Or possibly, labor markets in the surrounding regions are in dire need of new employers.

MapBusinessOnline Pro also provides the ability to append demographic and geographic data to your imported datasets. Add columns for population, median income, consumer expenditures, and any other column of Demographic data from our library of options. While you’re at it, add a few columns referencing ZIP codes and counties. Or upload a set of business listings to display competitor locations.

All of these imported and appended datasets are exportable as CSV files. A nice set of data to include with the franchise sales agreement.

Consider MapBusinessOnline Pro for location data enrichment in your business.

Why Would a Business Invest in MapBusinessOnline Pro?

Retailers

Connect the drive time tolerance of your critical customers with your marketing campaigns. Manage marketing efforts based on customer proximity to store locations.

Transportation Managers

Manage and measure vehicle route metrics. Calculate miles between all points in two large datasets. Compare anticipated expenses to actual costs.

Medical Systems Expansion

Locate all the major medical businesses within 30 miles of a central medical facility. Create coverage area maps for various medical insurance providers based on proximity to services and customer classifications. Analyze demographic realities by ZIP code to confirm area growth will support robust medical system growth.

Construction

Manage and measure a set of construction site locations – monitor supply requirements, delivery on-timeliness, inspection, certification schedules, and contracted employee project progress.

Finance

Analyze demographic and economic realities for specific urban neighborhoods. Manage and measure loan blocks, real estate values, or employment opportunities.

Insurance

Create map visualizations supporting risk calculations for disaster-prone areas—Including vehicle routing for disaster planning—track claims across regions and cities. Share maps publically for constituent buy-in or privately for collaborative editing.

_______________________________________________

Discover why over 25,000 business users log into www.MapBusinessOnline.com for their business mapping software and advanced sales territory mapping solution. The best replacement for Microsoft MapPoint happens to be the most affordable.

To access MapBusinessOnline, please register and download the Map App from the website – https://www.mapbusinessonline.com/App-Download.aspx.

After installing the Map App, the MapBusinessOnline launch button will be in the Windows Start Menu or Mac Application folder. Find the MapBusinessOnline folder in the Start Menu scrollbar. Click the folder’s dropdown arrow and choose the MapBusinessOnline option.

The Map App includes the Map Viewer app for free non-subscriber map sharing.

Please read customer reviews or review us at Capterra or g2crowd.

Contact: Geoffrey Ives at geoffives@spatialteq.com or Jason Henderson at jhenderson@spatialteq.com

Posted in Business Mapping Software blog post, Sales and marketing | Tagged , , , , , , , | Leave a comment

How Do I Generate a Proximity Search Using MapBusinessOnline Pro?

It is easy to generate a Proximity Search with MapBusinessOnline Pro. We call this tool, Find the Nearest.

The price is more than right. Alternative driving time and distance software products are much more expensive. MapBusinessOnline Pro provides advanced business mapping users with driving time and distance analysis tools. Two of the six driving time analysis tools are proximity searches.

A proximity search lets the map user search an area surrounding a point or set of points for location data. Think World War II submarine movies with sonar searching for depth charges, except it’s usually not that stressful a situation. (‘Kping! Kping!’) Usually, MapBusinessOnline users search for potential clients, actual customers, or liquor stores.

At any rate, a proximity search is easy using MapBusinessOnline Pro.

Search and Segment Data from Multiple Center Points

The first method is a broad search of all records within multiple drive time areas, compiled into one dataset. This function is under MapBusinessOnline Pro’s Analysis button. Choose Search and Segment Data from Multiple Center Points.

To set up the broad Proximity search:

  1. Select Search & Segment.
  2. Import or select the desired imported dataset, around which all records will be searched.
  3. Select the Straight line, Drive time, or Driving Distance search function desired.
  4. Fill in the distance miles or minutes to search.
  5. MapBusinessOnline notes your Routing Credit status on the following dialogue. (Users can purchase additional datasets under Subscription in your account.)
  6. Select the dataset to be searched.
  7. View the Report.

Search, and Segment provides an exhaustive list of all search data results covering all data points. Such a list is a great starting point for a location-based project. Think:

  • Show me all the records with 100 minutes of all these stores.
  • Generate a list of all suppliers within 50 minutes of all of our warehouse locations.
  • I need a list of all medical field staff within 20 minutes of all patients.

Use the Data Window filtering tools to fine-tune your list or set up various research projects based on the initial query results.

Search & Segment Data Across Multiple Points by Driving Time

Find the Nearest Proximity Search

Further down the list of Analysis options in MapBusinessOnline Pro, you will find the Find the Nearest Proximity search. This proximity search function allows the map users to compare two location data sets to determine the closest options. Think Store vs. Customer, Hospital vs. Patient, or Veterinarian vs. Pet. In MapBusinessOnline, we reference Store vs. Customer.

The objective is to have the Proximity search look for all customers within X miles or minutes from a store. You can choose to show the nearest one, two, or up to twenty customers.

  1. Select the driving time and distance calculation combination you’d like applied.
  2. Decide in the next two steps which datasets are Stores or Customers. Please test it out a couple of times to ensure you understand which is considered the base location point.
  3. Input a distance or time constraint for the calculation to use.
  4. Adjust column heading text as required
  5. Decide if you want to show 1, 2, or 3 of the nearest objects to each store. Start with one and see how you do.
  6. Run the query.
  7. MapBusinessOnline displays your routing credit status.
  8. View the report.

With the output in the Data Window, use the data window filtering tools to adjust the report to your liking. You can always use the Choose Columns button in the lower right to move data columns out of the analysis and start again.

When running MapBusinessOnline driving time and distance calculations like these proximity searches, keep in mind:

  • You should limit your total records search to 1 million points – the quotient of both datasets. If you have significantly more than 1 million, split the dataset up.
  • You can purchase more routing credits through your account subscription link.

A Find the Nearest Proximity Search supports these markets:

  • Construction site planning – supply, inspection, and progress monitoring.
  • Field staff management – home care, technical support, traveling salespeople.
  • Financial investment planning and analysis – risk assessment, growth planning, demographic analysis.
  • Insurance claims and sales management – field staff monitoring, claims management, sales programs.
  • Marketing and sales analysis – expansion planning, campaign management.
  • Retail chain store management – campaign management, product sales tracking.
  • Psychic & tarot readings – checking to make sure you are still reading.
  • Supply chain management and warehousing – delivery monitoring, shipping efficiencies.
  • Transportation network efficiency analysis – manage and measure vehicle traffic.

So, Why Use MapBusinessOnline Pro?

  • Your company pays attention to driving time and distance calculations for operations.
  • Your business operates multiple retail stores, warehouses, or supply chains.
  • Your business seeks to understand the demographic make-up of where it does business.
  • You generate market analysis in support of growing sales into new markets.
  • You plot more than 50,000 records per map, for whatever reason.
  • Your company conducts ZIP code-to-ZIP code time and distance analysis.
  • Your company manages significant investments in multiple urban areas – banks, insurance, organized crime (Kidding!)
  • You manage regional and national sales and franchise territories.

MapBusinessOnline Pro exposes advantages and problems with processes that incur travel expenses. Driving time and distance queries expose weaknesses and efficiency drag on the system.

_______________________________________________

Over 25,000 business users log into www.MapBusinessOnline.com for their business mapping software and advanced sales territory mapping solution. The best replacement for Microsoft MapPoint happens to be the most affordable.

To access MapBusinessOnline, please register and download the Map App from the website – https://www.mapbusinessonline.com/App-Download.aspx.

After installing the Map App, the MapBusinessOnline launch button will be in the Windows Start Menu or Mac Application folder. Find the MapBusinessOnline folder in the Start Menu scrollbar. Click the folder’s dropdown arrow and choose the MapBusinessOnline option.

The Map App includes the Map Viewer app for free non-subscriber map sharing.

Please read customer reviews or review us at Capterra or g2crowd.

Contact: Geoffrey Ives at geoffives@spatialteq.com or Jason Henderson at jhenderson@spatialteq.com
Posted in Business Mapping Software blog post, How to instruction | Tagged , , , , | Leave a comment

Calculating Distances and Times Between Many Points

“Honey, what do you say we Batch Calculate some drive times and distances tonight?”

“Um. Sure. Wait. What did you say?” Not another night of driving time and distance queries. Next time don’t marry a map geek. Oh well.

What exactly is batch calculating distances and times across one or even two datasets? One might ask.

Well, for one thing, it is a feature in MapBusinessOnline Pro. You’ll find it listed as option two under the Market Button, short for Market Analysis. The list of functions includes multiple takes on driving time and distance analysis. MapBusinessOnline Pro takes business mapping software to a whole new dimension.

Specifically, Batch Calculate, the second function listed, analyzes a list of address points compared to one address or a second list of addresses. That comparison calculation returns a result of the distances or travel times between all those location points. The ‘batch calculate’ computation results show as additional columns to the original address spreadsheet in the Data Window.

A batch-calculated analysis of addresses are valid for any business interested in controlling travel costs, fuel consumption, delivery times, and transportation efficiencies. These businesses might include:

  • Delivery Services – Regional or citywide delivery services via truck, car, or bicycle must monitor service levels, travel costs, and driver locations.
  • Retail Distribution Channels – Retailers are dependent on reliable and efficient Just-in-Time delivery systems to control inventory, monitor turn and earn rations, and maintain customer satisfaction.
  • Supply Chain Management – Similar to warehousing but more global. Multiple distribution destinations with 24/7 incoming product requirements and outbound commitments.
  • Technical, Medical, or Sales Field Staff Monitoring – Mobile field force tracking of expense reporting, travel costs, fuel consumption, miles traveled, or even stop-off times.
  • Warehousing Operations – Multiple warehouses feeding raw materials to a factory or storing finished goods.

With MapBusinessOnline Pro, a systems analyst can import a spreadsheet that includes one section for Origin Addresses and another section for Destination Addresses. Batch calculate takes these two sets of data, analyzes all points, and compares all addresses returning both time and distance results. Think Shipping for Origin and Receiving for Destination.

Example Spreadsheet with Two sets of Addresses.

As an example, a delivery service manager could use the time results to measure or correlate:

  • On-timeliness averages for the delivery force.
  • Fuel consumption – based on miles traveled.
  • Miles traveled vs. expected miles traveled – expense tracking double-checks.
  • Stop-off duration expectations vs. time spent per route stop.
  • Total miles across the network.

From One Point to All Other Points

A map user runs Batch calculation operations in MapBusinessOnline from one point to all points in a data set or from a selected point on the map:

  1. Select an imported or plotted point on the map.
  2. In the associated pop-up menu, choose the option for Distances and Times – a bullseye icon.
  3. In the menu that pops open, select the dataset you’d like to calculate against.
  4. Select the time and distance operations or combination operations you desire.
  5. Type in a textual suffix for the Column Header of the results spreadsheet.
  6. Click Next. Review the status report of routing credits.
  7. Run the Batch Calculate query.

Here’s an example output view from the Data Window after Batch Calculate happens:

Batch Calculate Results Driving Distance and Time


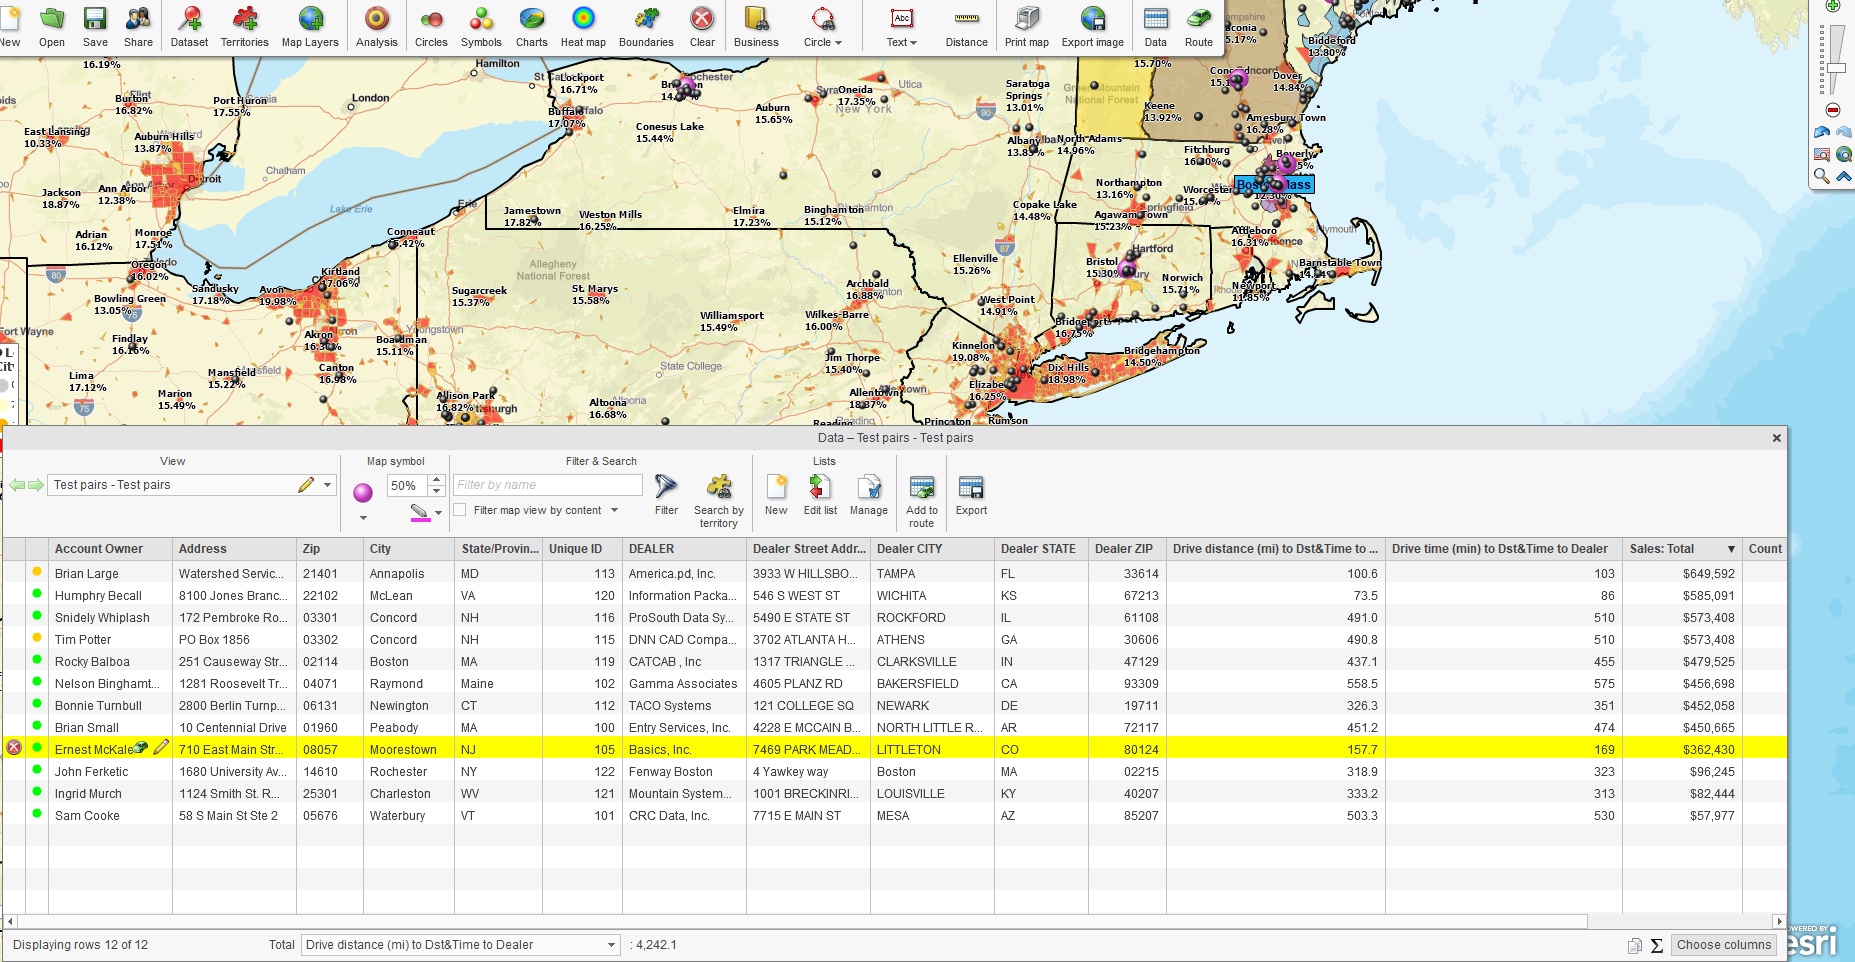
The above example report includes two additional columns because I ran the driving distances and driving times calculation. I’ve selected to sum the column for distance at the bottom. Please note that the spreadsheet reflects the driving distances from one point in Rochester, NY, to all twelve locations in the Dealer list. The total network distance for all twelve destinations is 4,242 miles.

The ‘batch calculate’ operation noted above took less than 30 seconds. Understand the limits of your’ batch calculate’ query by keeping the origin points x destination quotient to 1 million or less. In this case, the quotient of 12 x 1 = 12—no big deal. But for 500 destination points and 200 origin points, the quotient would be 1 million. If you go significantly over one million, split your query into sections.

“Honey, How Would I Know if I Could Use a Batch Calculate Analysis?”

“Darling, I’m glad you asked.” Perhaps consider investing in MapBusinessOnline Pro if:

  • Your business has travel operations that include origin and destination points. These might also be beginning and endpoints, shipping and receiving points, load and delivery points, or even pick-up and drop-off points.
  • Your business tracks the efficiency and expected travel costs across multiple staff in the field.
  • You own or manage a fleet of vehicles.
  • Your business manages multiple locations – warehouses, retail stores, construction sites, etc.
  • You conduct ZIP code-to-ZIP code analysis. Read more about ZIP-to-ZIP here.

MapBusinessOnline Pro, for the business that tracks results and explores opportunities.

_______________________________________________

Over 25,000 business users log into www.MapBusinessOnline.com for their business mapping software and advanced sales territory mapping solution. The best replacement for Microsoft MapPoint happens to be the most affordable.

To access MapBusinessOnline, please register and download the Map App from the website – https://www.mapbusinessonline.com/App-Download.aspx.

After installing the Map App, the MapBusinessOnline launch button will be in the Windows Start Menu or Mac Application folder. Find the MapBusinessOnline folder in the Start Menu scrollbar. Click the folder’s dropdown arrow and choose the MapBusinessOnline option.

The Map App includes the Map Viewer app for free non-subscriber map sharing.

Please read customer reviews or review us at Capterra or g2crowd.

Contact: Geoffrey Ives at geoffives@spatialteq.com or Jason Henderson at jhenderson@spatialteq.com


Posted in Business Mapping Software blog post, How to instruction | Tagged , , , , | Leave a comment

Process a Quick Map-Based Market Analysis Using MapBusinessOnline

Here’s a quick, down and dirty market analysis any of MapBusinessOnline Standard customers can generate using our city limits map layer and demographic data. No complicated calculations are necessary for this business mapping exercise. It does, however, require that your product or service have some relevancy to the US Census Bureau demographic consumer expenditure data we offer. Many of your products or services will be somewhat translatable to that list of expenditures.

We’re going to break this down into three short steps:

  • Add City Limits to the map.
  • Choose several major demographic population segments that make sense for your services.
  • Select one or two consumer expenditures that might represent expenditures related to purchases your customers make.

City Limits Map Layer

Click the Adding to Map Map Layer button on the Master Toolbar. Map Layers is currently in the seven buttons from the left slot. Please scroll down to City Limits and add it to your map. Easy peasy, right? Sure is.

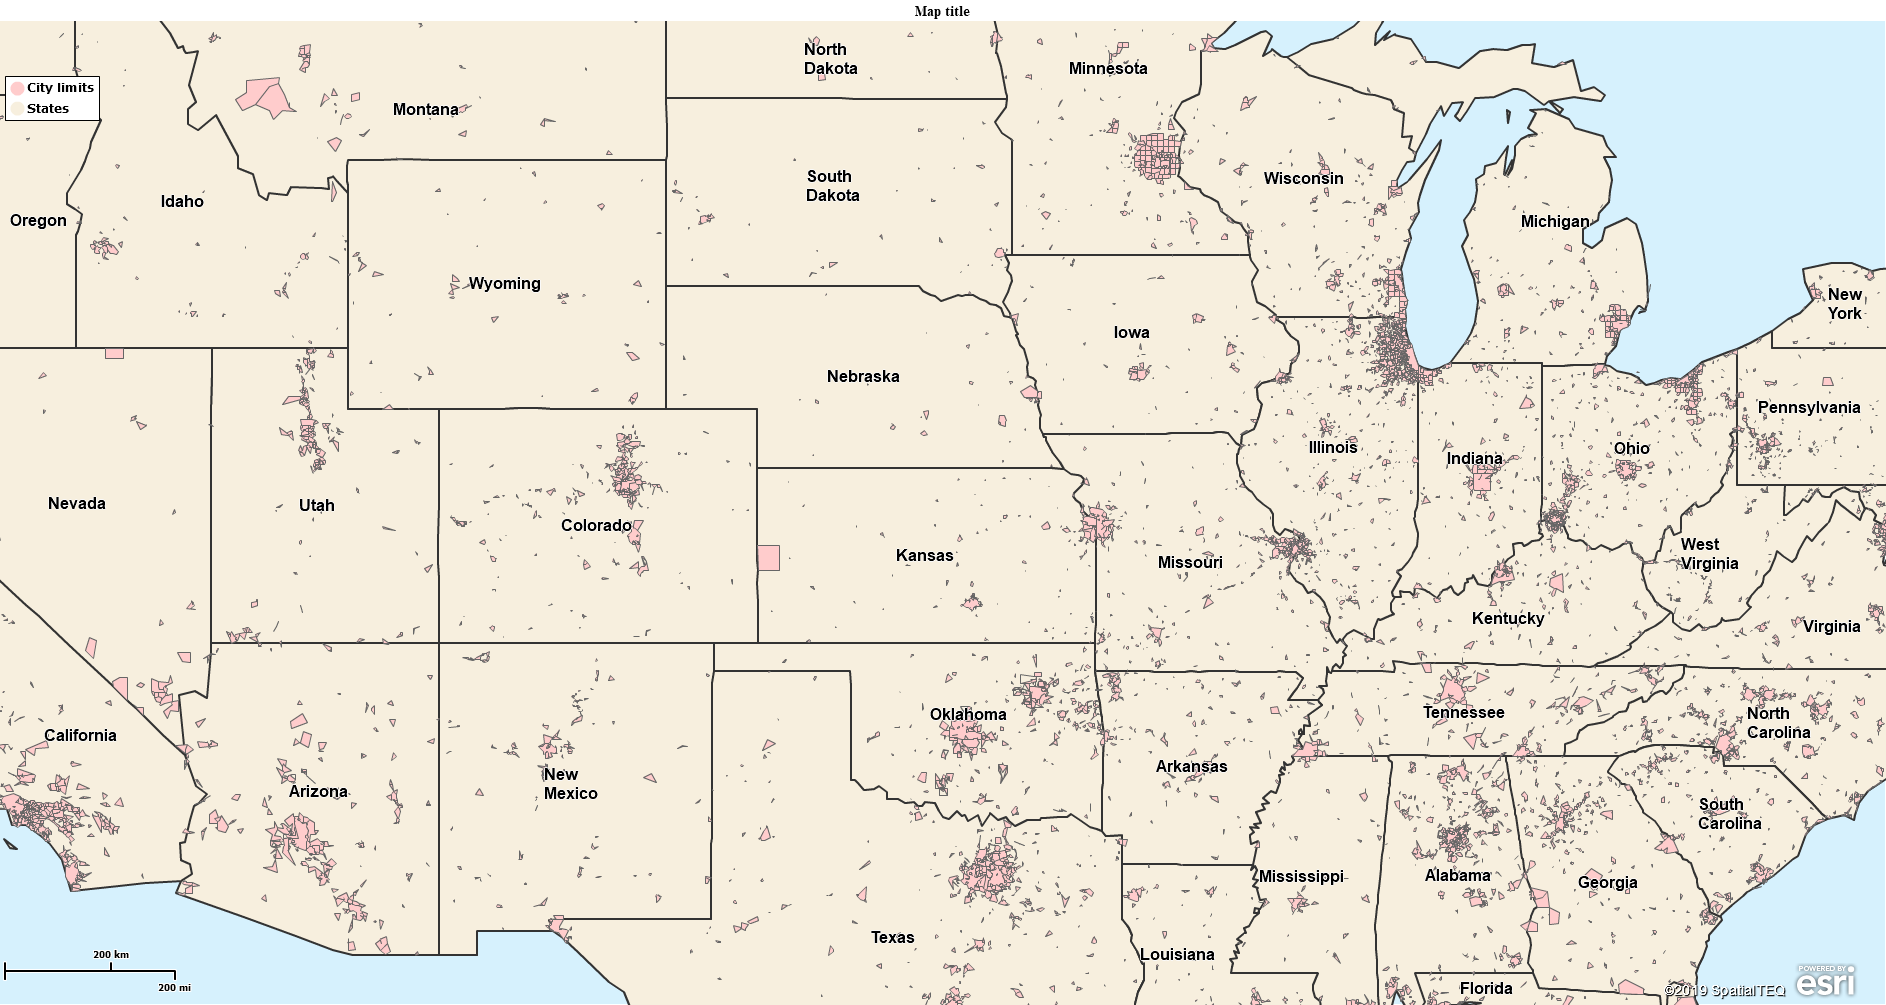
City Limits Layer Against State Layer Background


Alternatively, you could use ZIP codes, but ZIP codes are quite granular for this analysis. My recommendation is to start with cities.  You could also select MSA’s (Census Metropolitan Statistical Areas) as your map layer, representing urban marketing areas.  The same logic outlined below applies. MSA’s are somewhat akin to DMA’s for those of you familiar with DMA’s now owned by Nielsen and priced beyond the reach of most of us lowly worker bees.

City-based market analysis provides that down and dirty market calculus to decide which areas best suit your business’s growth investment strategy. You can dig into details by ZIP code later.

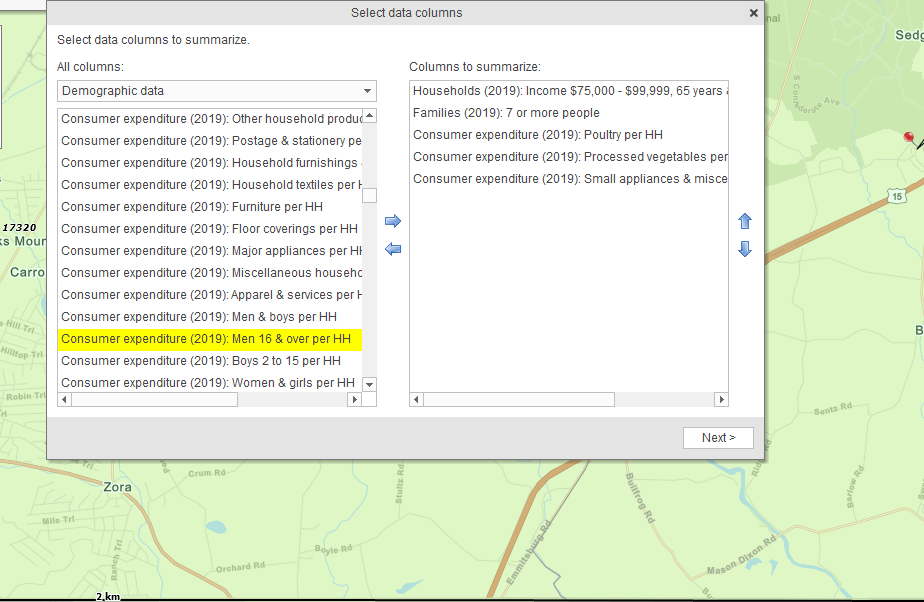
With the City Maps layer now viewed on your MapBusinessOnline platform screen, select one city, perhaps one that you feel familiar with. Notice the mini-menu option that popped up.  Select the Summarize option in that mini-menu.

Notice that demographic data is the first option for summarization.  Scroll through the demographic data and view the selections to familiarize yourself with all the possibilities.

Demographic Data Options

The most recent official US Census data release is the 2019 Census data listed. Remember, the top two years displayed in the demographic data options list are 3rd party (non-Census) projections. That may be fine for your analysis.

Scroll through the list while thinking about your customers, products, and services and which demographic options might work best for your analysis.

Here’s an example. Imagine I had launched a Maine-based soft-drink company. We’d done well here in Maine, and it was time to consider expansion beyond New England. I might conduct my down and dirty market analysis based on the following demographic categories available in MapBusinessOnline:

  • 2019 – Household Income $75,000 – $99,999. That’s a real middle-of-the-road choice for the income sweet spot, but all income levels consume soft drinks. I’m not selling something that only high-income levels can afford. Not am I selling to strictly lower-income folks. Still, income is always helpful as a part of market analysis.
  • 2019 Race – White. I’m selling in Maine. We’re the whitest state in the country. As we move south and west other ethnicities will become more critical.
  • 2019 Black – Black. We did some market studies over the past year, and everywhere we tested, people of color enjoyed our beverages. So, we think we’ve got a good shot at beating our sales goals if we market appropriately in cities with high black populations.
  • 2019 Consumer Expenditures – Nonalcoholic Beverages – Kind of a no-brainer. Softdrink purchases should do well in this category.

Consumer Expenditures

As you scroll through the Census data options available through MapBusinessOnline, you will come to a section on Consumer Expenditures.  These categories describe the dollars per year US consumers might spend on a specific set of services or products per household.

Examples include:

  • Bakery products
  • Footwear
  • Furniture
  • Housing
  • Mortgage interest
  • Processed vegetables
  • Vehicle purchases

Review the list. Perhaps the consumer expenditures listed do not coincide with your business products or services. However, it is also possible that concentrations of certain products or services in specific populations might be telltale indicators for business growth for your unique offerings. A large population of boys ages 9 to 15 might suggest that skateboard sales will be higher in certain areas.

Demographic Selections for Down & Dirty Market Analysis

Now, have at it if you can find a demographic category that directly correlates to your product or service. Short of that, think about expenditures that parallel or supplement your services. Find you’vembination that represents your successful buyou’ll activity in your city.

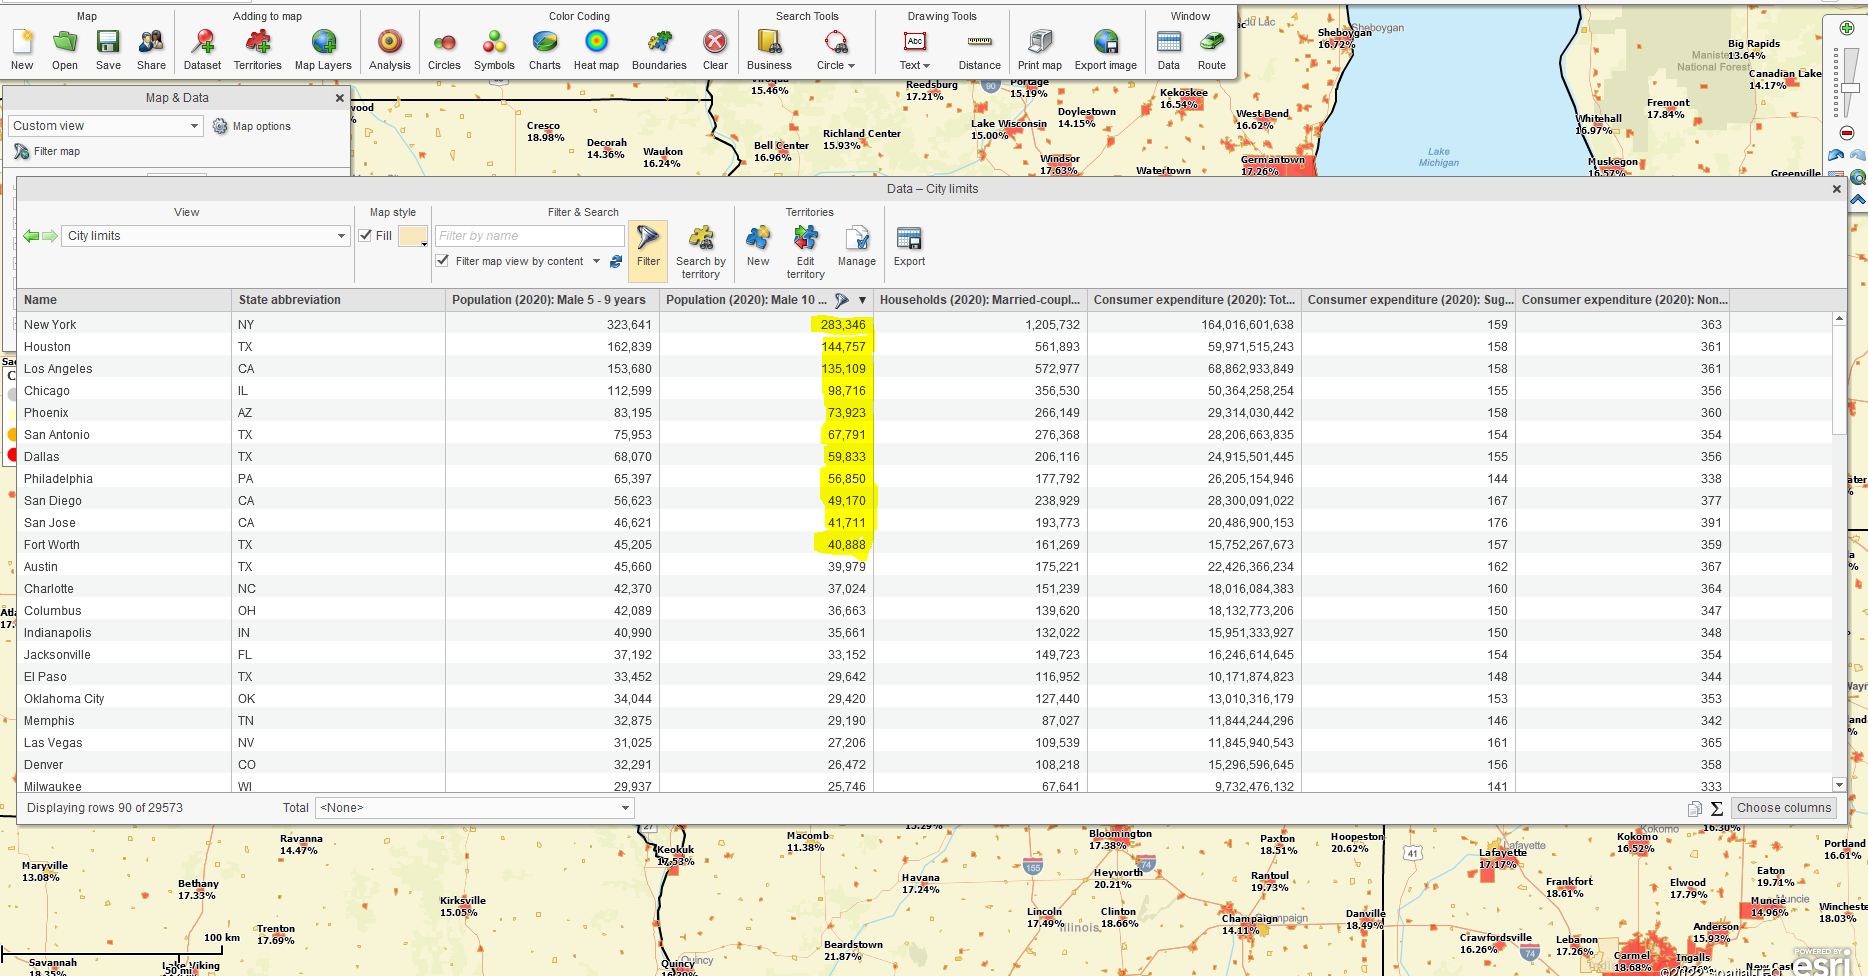
Once  this Summary based analysis is completed, you’ll have some ideas to apply to a more intensive study using the Data Window Choose Column button. Read more about complete market analysis here.  You could, for instance, set up a Data Window view of the City Limits layer with added columns for each of your demographic layers. Then click on the header of each of the columns to find which cities reflect the optimum demographics for your business.

Top 10 Cities for Skateboard Sales?

Hopefully, you can see how this exercise gets the juices flowing and, if nothing else, inspires your team to define better what your business is all about.

_______________________________________________

Over 25,000 business users log into www.MapBusinessOnline.com for their business mapping software and advanced sales territory mapping solution. The best replacement for Microsoft MapPoint happens to be the most affordable.

To accesfolder’sinessOnline, please register and download the Map App from the website – https://www.mapbusinessonline.com/App-Download.aspx.

After installing the Map App, the MapBusinessOnline launch button will be in the Windows Start Menu or Mac Application folder. Find the MapBusinessOnline folder in the Start Menu scrollbar. Click the folder’s dropdown arrow and choose the MapBusinessOnline option.

The Map App includes the Map Viewer app for free non-subscriber map sharing.

Please read customer reviews or review us at Capterra, or g2crowd.

Contact: Geoffrey Ives at geoffives@spatialteq.com or Jason Henderson at jhenderson@spatialteq.com

Posted in Business Mapping Software blog post, How to instruction | Tagged , , , | Leave a comment

Mapping the USA Westward Expansion Using MapBusinessOnline

Why does a business install business mapping software? The short answer is to improve your business performance through location-based analysis and map visualizations.

But your child might need MapBusinessOnline someday. Oh yes, they actually might.

I took some time this week to create a history map using MapBusinessOnline. I tested the process to make sure I could create a ‘good enough’ map to get a grade of B or higher on an American History project assignment.

The assignment was to create a USA map that showed the significant areas of the contiguous USA land acquisition west of the Mississippi from the year 1800 on. I learned a few things about MapBusinessOnline in the process.

For those not ‘in the know,’ Contiguous means sharing a common border or touching. So, we’re not going to worry about Alaska and Hawaii for this map. But MapBusinessOnline does have options for capturing the conterminous USA (including Alaska and Hawaii), if’n you require it someday.

Use the Draw Tools

For most of the map work on my homework assignment, I used the Draw Tools located on the right side of the Master Toolbar.  I selected the Free Form line tool to draw my boundary lines. I had not used the Free Form line tool very often before this exercise.

Here are a few tips on my process:

Drawing the Polygon

  1. It’s easy to delete any line you’ve started and draw again. So, don’t get too frustrated as you get used to the tools. Just restart a new line. As you pull, the line moves quickly and takes some getting used to time. Please give yourself a few tries to get the hang of it.
  2. You’ll be able to go back and make line adjustments, so don’t try to be perfect. (See editing tips below.)
  3. Use state boundaries and rivers, where possible, as a trace line rather than free drawing the whole thing. For instance, when drawing in the Louisiana Purchase, you can tell where some boundaries follow significant rivers. When drawing a curved line representing free-form boundaries, other areas may require a steady hand. Use these map features as a guide for your boundaries.
  4. Complete the drawn line back to the beginning, and the polygon will display as a whole. Uncheck the polygon fill until you’ve established the territory label (see next section.)

Labeling

  1. After completing the polygon, select the option to create a territory from the County layer. Then, in Map and Data, uncheck the territory fill on the territory layer to allow the draw-layer to reflect the historical area of interest, not the territory. We’re going to use territory labels, so remember to uncheck the polygon fill for any editing to territory labels moving forward.
  2. Still editing the territory map layer, hide the internal county boundaries. Adjust territory boundaries to your liking.
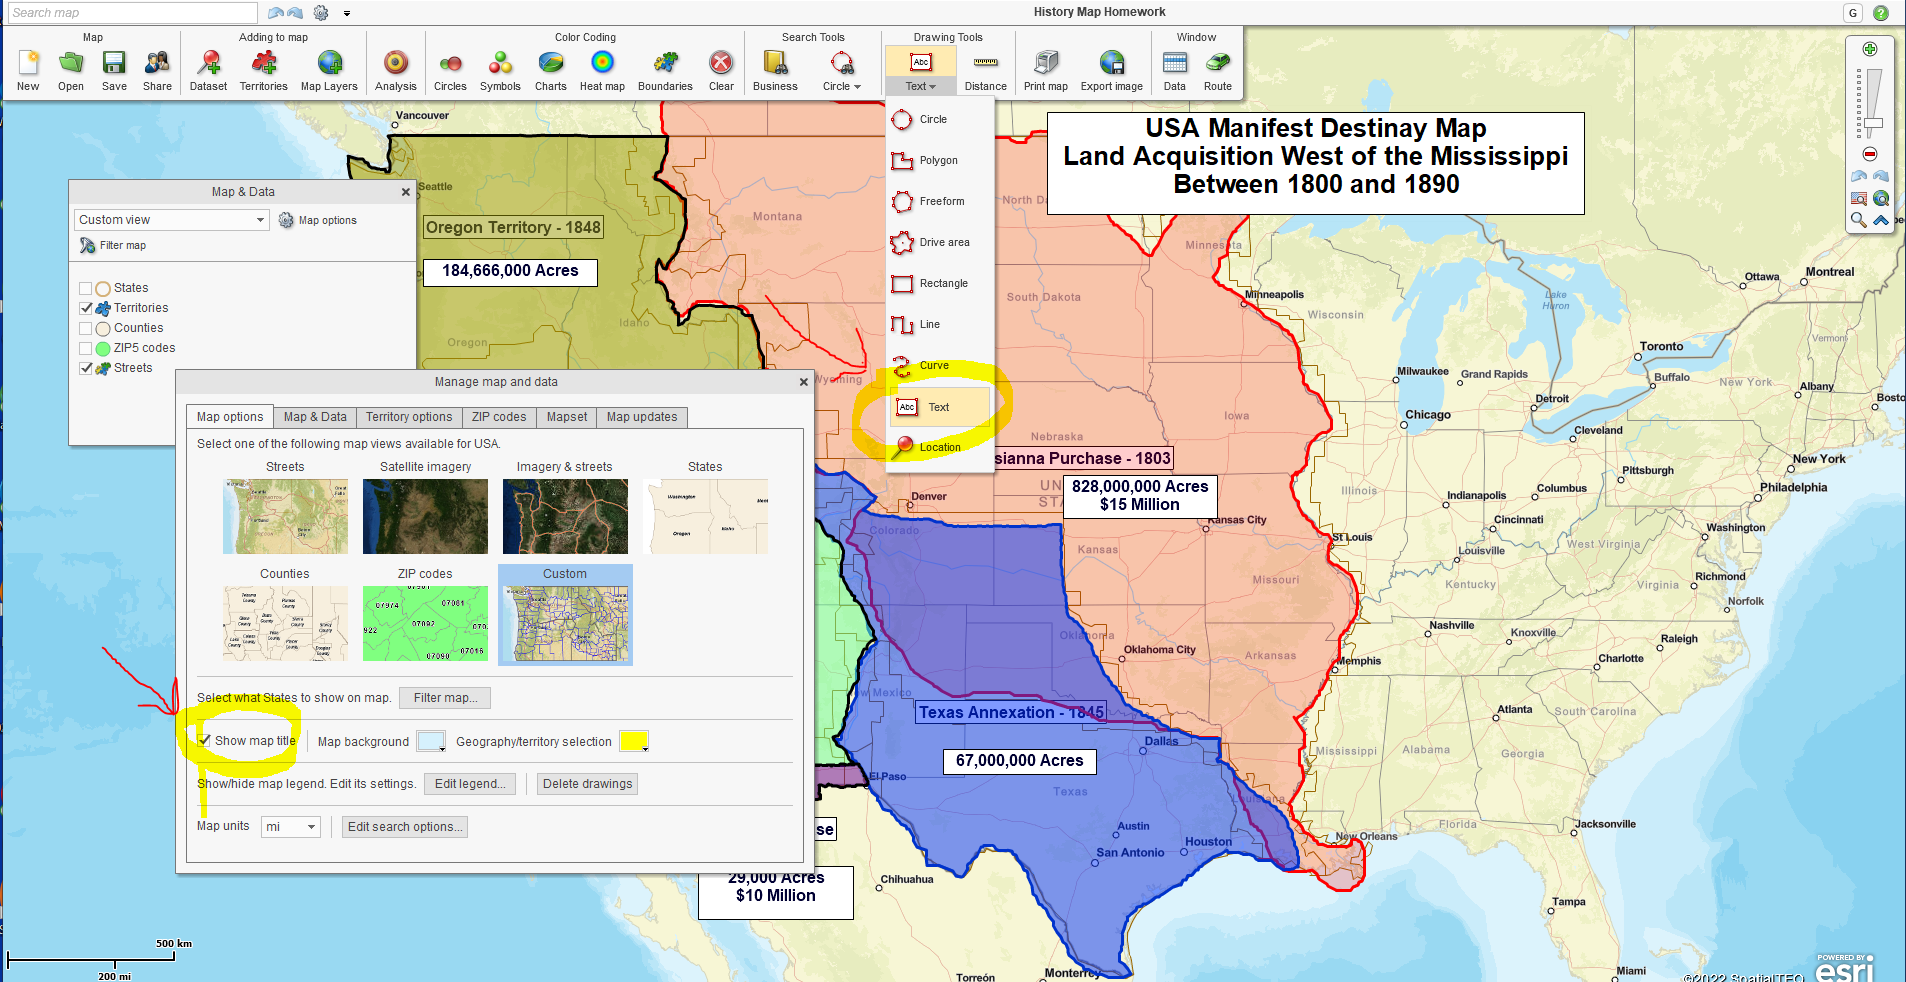
  3. I used the Territory Name label for labeling the various land acquisitions. Adjust the territory label to have a white background because it will show through the polygon fill more prominently.
  4. I also added TextBoxes using the Draw Tool option for Text Box to show land purchase values where I could find them.
  5. Once complete, turn the polygon fill back on and adjust as required.
  6. Lastly, use the Map Title insert for a map like this. You will find Map Title in the main panel of Map and Data options towards the bottom.

Access TextBoxes and Map Title.

Fine Tuning Your Maps Look

  1. Some area borders will show holes and gaps as you add new acquisitions. Zoom into those areas and adjust the lines by pulling the Yellow nodes to appropriate boundary points to line up the boundary lines between sections. As you do this, you will see that it is pretty easy to true up the side-by-side boundaries. It doesn’t need to be perfect. A zoomed-out view will look pretty good.
  2. Use the Zoom tool (the magnifying glass icon) in the navigation scroll bar (upper right corner) to zoom into areas needing a touch-up.  Editing the drawn lines is essential to generating a compelling homework map.
  3. Once you reach an area for editing, select a yellow highlighted node, and move the node to your desired location.  You will see the line shift with the node adjustment. Keep moving nodes until your line is to your liking. I find dragging a selected node to a turning point on the matching borderline makes the process move faster and more accurately.
  4. Notice that you can select a node for way out-of-whack lines and delete it. Just click on the node, and the associated mini toolbar offers you a ‘Delete Selected Point’ option. This process helps correct line placements.
  5. Once your node editing is complete, click away from the drawn line, and it will save.

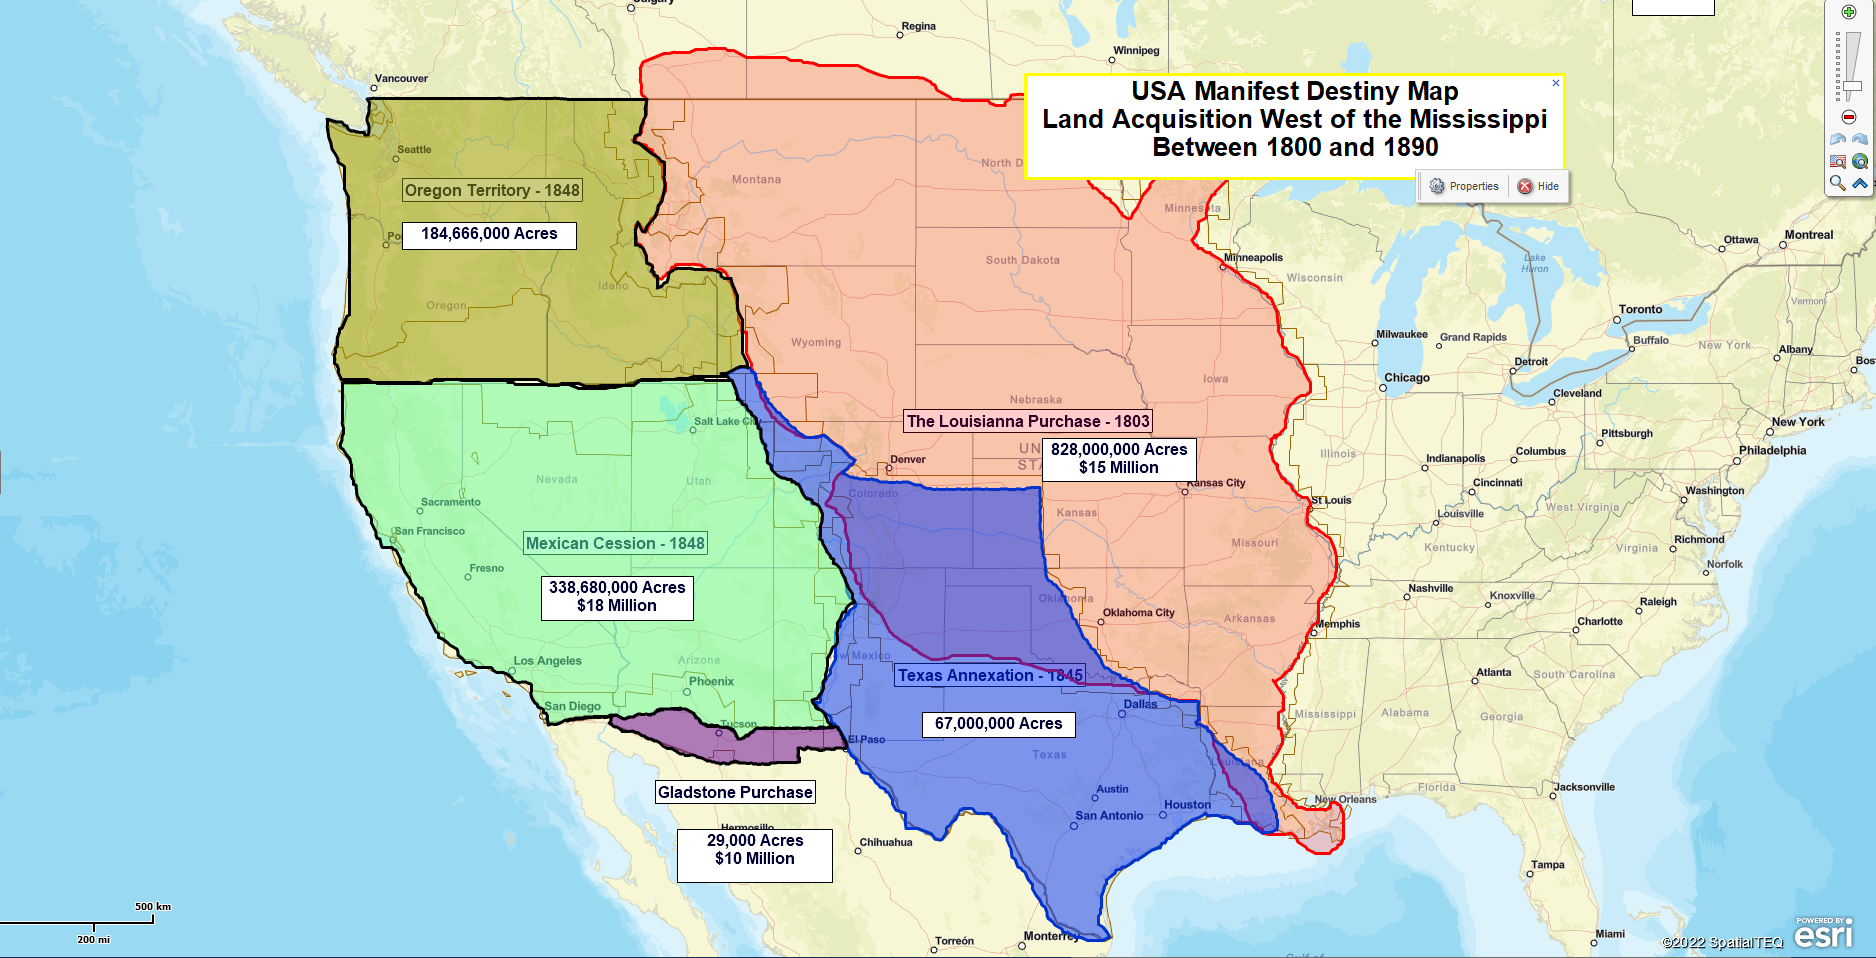
USA Manifest Destiny Map

I traced eye-balled the online maps I could find of:

  • The Lousiana Purchase.
  • The Annexation of Texas.
  • The Mexican Cession.
  • The Oregon Territory.
  • The Gladstone Purchase.

So the next time your kids ask for help with geography, don’t pretend you’ve got a call you have to take. Show them MapBusinessOnline and have some good old-fashioned geographic fun with the little guy or gal. You can do it!  I bet you never thought you’d hear about the Gladstone Purchase ever again.

And while you’ve got their attention, ask them how to get maps on Instagram.

_______________________________________________

Over 25,000 business users log into www.MapBusinessOnline.com for their business mapping software and advanced sales territory mapping solution. The best replacement for Microsoft MapPoint happens to be the most affordable.

To access MapBusinessOnline, please register and download the Map App from the website – https://www.mapbusinessonline.com/App-Download.aspx.

After installing the Map App, the MapBusinessOnline launch button will be in the Windows Start Menu or Mac Application folder. Find the MapBusinessOnline folder in the Start Menu scrollbar. Click the folder’s dropdown arrow and choose the MapBusinessOnline option.

The Map App includes the Map Viewer app for free non-subscriber map sharing.

Please read customer reviews or review us at Capterra or g2crowd.

Contact: Geoffrey Ives at geoffives@spatialteq.com or Jason Henderson at jhenderson@spatialteq.com

Posted in A story, Business Mapping Software blog post, How to instruction | Tagged , , , , | Leave a comment