What’s Your Drive Time Analysis Telling You?

‘Are we there yet?’

No matter how fun or exciting the family destination, that dreaded question is the stuff of every parent’s nightmare. The whiny child in the back, sick of driving, asks the impossible question, “Are we there yet.”

If the kid had invested in business mapping software like MapBusinessOnline, she might find the answer independently, with a few clicks on her laptop. After all, ‘Are we there yet?’ put another way, asks, ‘Please tell me if the remaining driving time is much greater than zero.’

Adults feel the same way as kids. They will not drive very far to get a product or service. How far are most adults willing to drive to get (fill in the blank)?

Driving Time – It’s Complicated

Driving time is the total time required to drive a vehicle over a road network from point A to point B. What makes the idea of driving time and distance calculations more complicated is that these calculations typically represent driving times and distances in all directions at once, over a stated period or specific distance.

Drive time calculations are complex and powerful business mapping features. They incorporate road classifications like one-way or two-way. These calculations know the speed limit on each section. Last, these calculations also can consider traffic patterns.

Driving Time as an Area

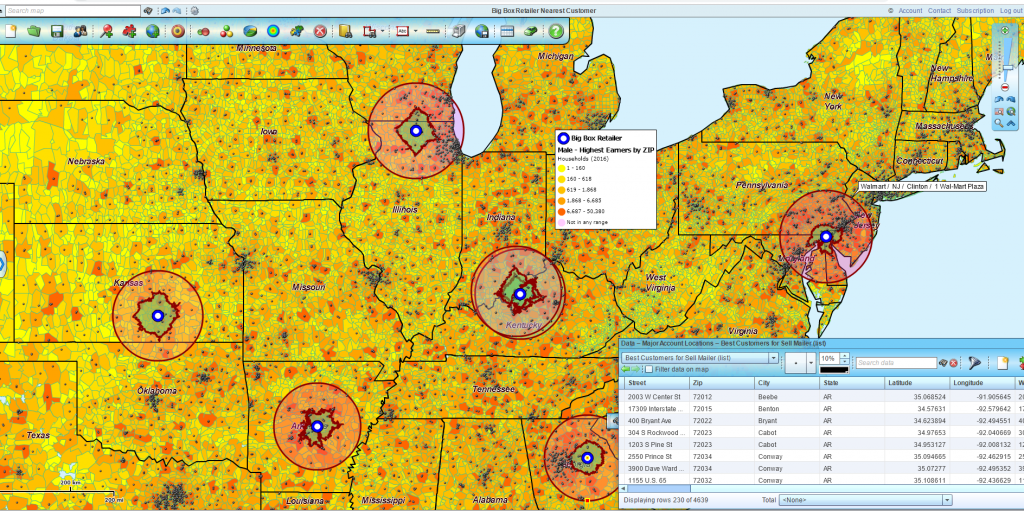
A MapBusinessOnline map user generates a drive time calculation. The calculation result provides all possible destination points following all road configurations, in all directions that a vehicle could travel for 30 minutes. Another way to think of a drive time calculation result is as a polygon or an area. The visual calculation of the operation renders a jagged polygon of points at varying distances from the start.
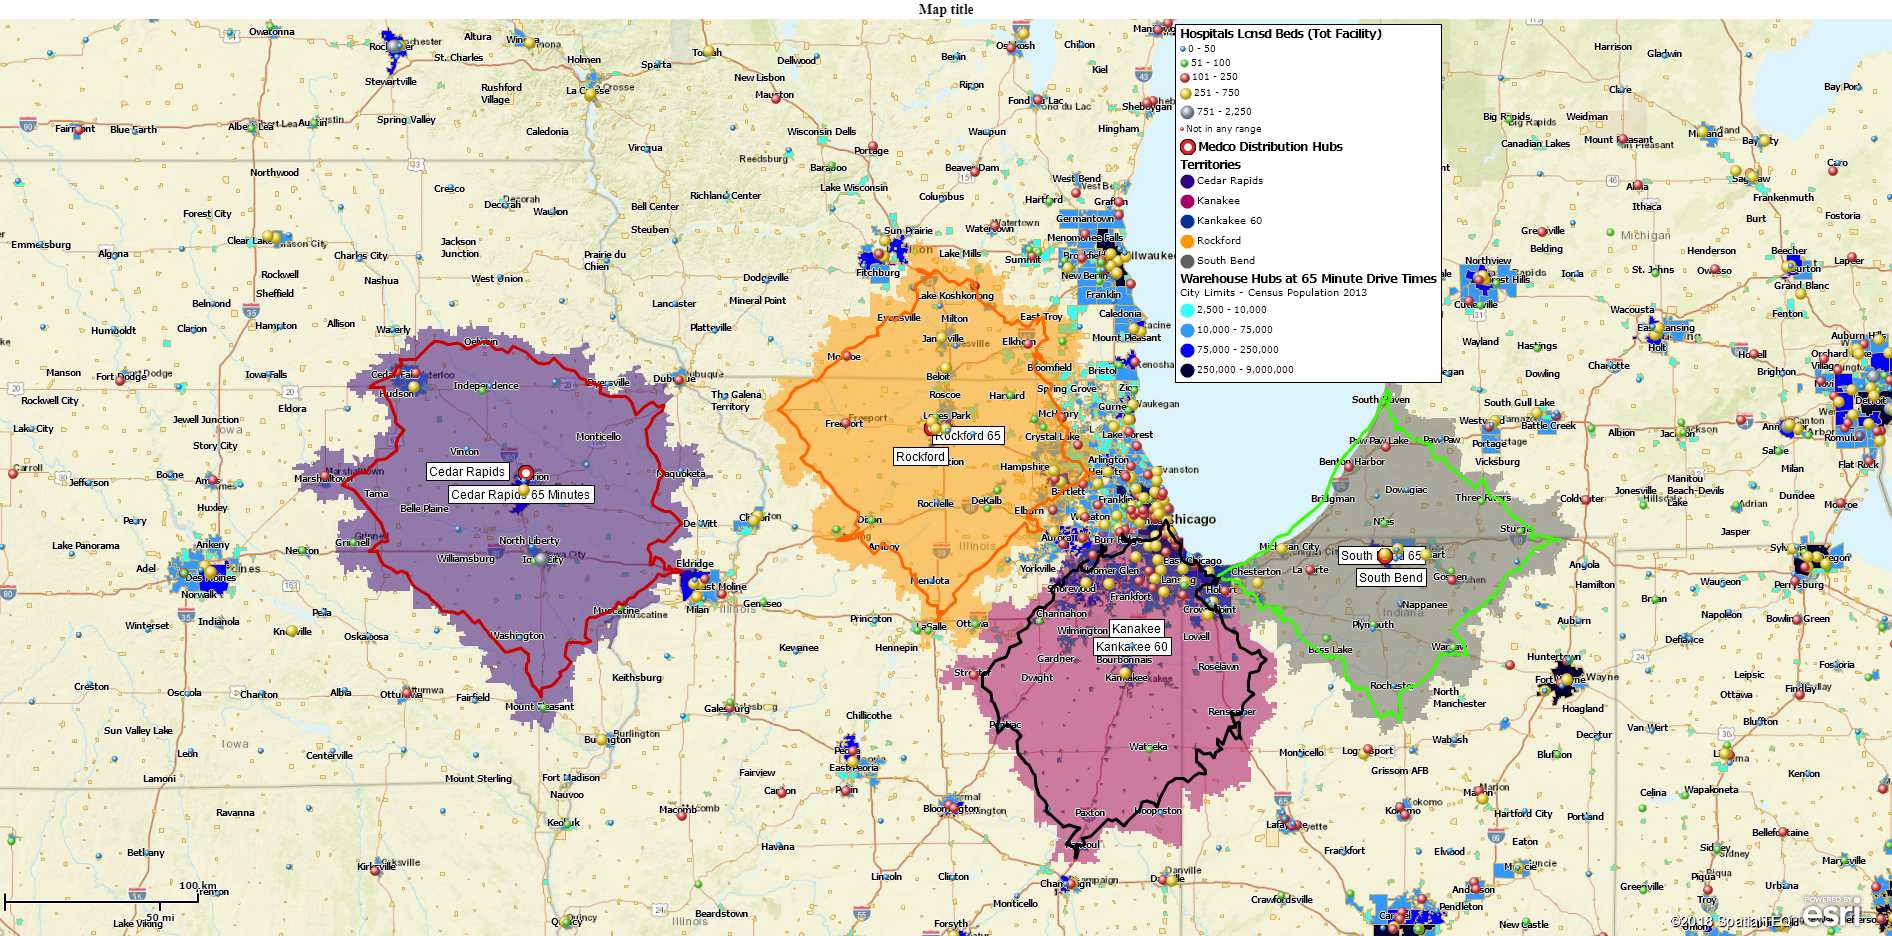
Driving Time Polygons Created Using MapBusinessOnline

As complex as the drive time calculation is, the resultant polygon is very informative. Driving time and distance calculations answer questions about business operations such as growth potential, operating costs, efficiency, and resource availability.

More specifically, driving time and driving distance areas can be used to assess:

  • Travel expense expectations for forecasting and veracity measures.
  • Arrival and departure estimates, including adjustments for traffic delays.
  • Technician and clinician capacity and scheduling requirements.
  • The driving time tolerance of 80% of your customer base.
  • The demographic characteristics of your local market.
  • The proximity of essential services for your business.
  • What cities and urban neighborhoods make the most sense for new facilities?
  • What ZIP code areas represent the riskiest places to do business or to invest?

These are general applications for driving time and distance analysis. Each industry and business will come up with their use of the MapBusinessOnline Standard and Pro drive time tools.

Drive Time Areas as a Rough Guide

Driving time and distance polygons obey the road network. Their jagged shape reflects the classification of roads.  A radical zig or zag in one direction is likely due to a major highway with a higher speed limit.  Vehicles traveling over 50 miles per hour on a major road or highway cover more ground in less time and quickly expand the width of the area of interest.

A 15 to 30-minute drive time is generally well tolerated by the average American consumer who likes to take a spin in their car, maybe get a break from the kids, or smoke a cigarette (heaven forbid.) And that typical consumer is not unique. They represent general classes of consumers from cities all over North America, perhaps similar in income, ethnicity, or age. Those overlapping character traits conflate into telling marketing data and serve to augment our understanding of a voting population, a userbase, a customer list, or a membership.

We use business mapping software with its accurate map background to compare demographic segments interested in products we sell to our existing set of known customers. And therein lies the beauty of business mapping tools. They combine the power of demographics, location, and internal business data. It’s a killer combination, and your business should be adding location data to their market analysis.

Drive time analysis maps are handy when comparing multiple metropolitan areas. Imagine if the question, “Are we there yet?” was asked about twenty possible destination points at once. Talk about Dad freaking out.

Ask the Question – Why?

With MapBusinessOnline Pro, a business can simultaneously analyze its sales histories and customer demographics across multiple drive-time center points.  Multiple point analysis is not difficult to achieve.  Import a spreadsheet with multiple addresses (one for each city of interest) and run the analysis.

This multiple center point analysis lets the marketing geniuses in your organization think through the results. Is it possible what sells in Boston also sells in Los Angeles? If not, why not?  And if both cities garner excellent sales revenues, why?

What demographic characteristics are shared by Boston and Los Angles? It’s probably not weather-related. Questions like this demand more thought:

  • Does a demographic category impact the product?  Is it age, gender, income, ethnicity, or homeownership status?
  • Is the product or service location dependent in some way?  Is it close to an airport, baseball stadium, or television broadcasting tower?
  • Are competitors located in the metro areas under review?

Driving time analysis solves problems alone, but many business issues come into better focus when viewed with demographic mapping, internal business data, and perhaps a competitor list. Problems you may not even realize you have.

Are we buying MapBusinessOnline Pro yet?

Additional articles describing MapBusinessOnline Pro:

_______________________________________________

Find out why over 25,000 business users log into www.MapBusinessOnline.com for their business mapping software and advanced sales territory mapping solution. The best replacement for Microsoft MapPoint happens to be the most affordable.

To access MapBusinessOnline, please register and then download the Map App from the website – https://www.mapbusinessonline.com/App-Download.aspx.

After installing the Map App, the MapBusinessOnline launch button will be in the Windows Start Menu or Mac Application folder. Find the MapBusinessOnline folder in the Start Menu scrollbar. Click the folder’s dropdown arrow and choose the MapBusinessOnline option.

The Map App includes the Map Viewer app for free non-subscriber map sharing.

Please read customer reviews or review us at Capterra or g2crowd.

Contact: Geoffrey Ives at geoffives@spatialteq.com or Jason Henderson at jhenderson@spatialteq.com

Posted in Business Mapping Software blog post, How to instruction, Sales and marketing | Tagged , , , , , | Leave a comment

MapBusinessOnline – Encouraging Growth Through Demographic Analysis

MapBusinessOnline Standard and MapBusinessOnline Pro provide access to the same extensive U.S. Census Bureau demographic data library demographic data by category.

Here’s a link to an article describing creating a demographic map using MapBusinessOnline.

A MapBusinessOnline business map subscribing user can quickly view segments of demographic data and review it for usability for your purposes by selecting a ZIP code in MapBusinessOnline and clicking the presented Summary button. The Summary button is the gateway to a quick and exportable mini spreadsheet of demographic data for your use, even outside the application.

You will note, for example, that a Summary button selection of Population, Population Female, and Population Male shows the total population value and the two-component gender populations.  A quick summation analysis (eyeballing the three figures presented) shows that the number of females plus the number of males estimated by the Census Bureau adds up to the total population. Pretty neat.

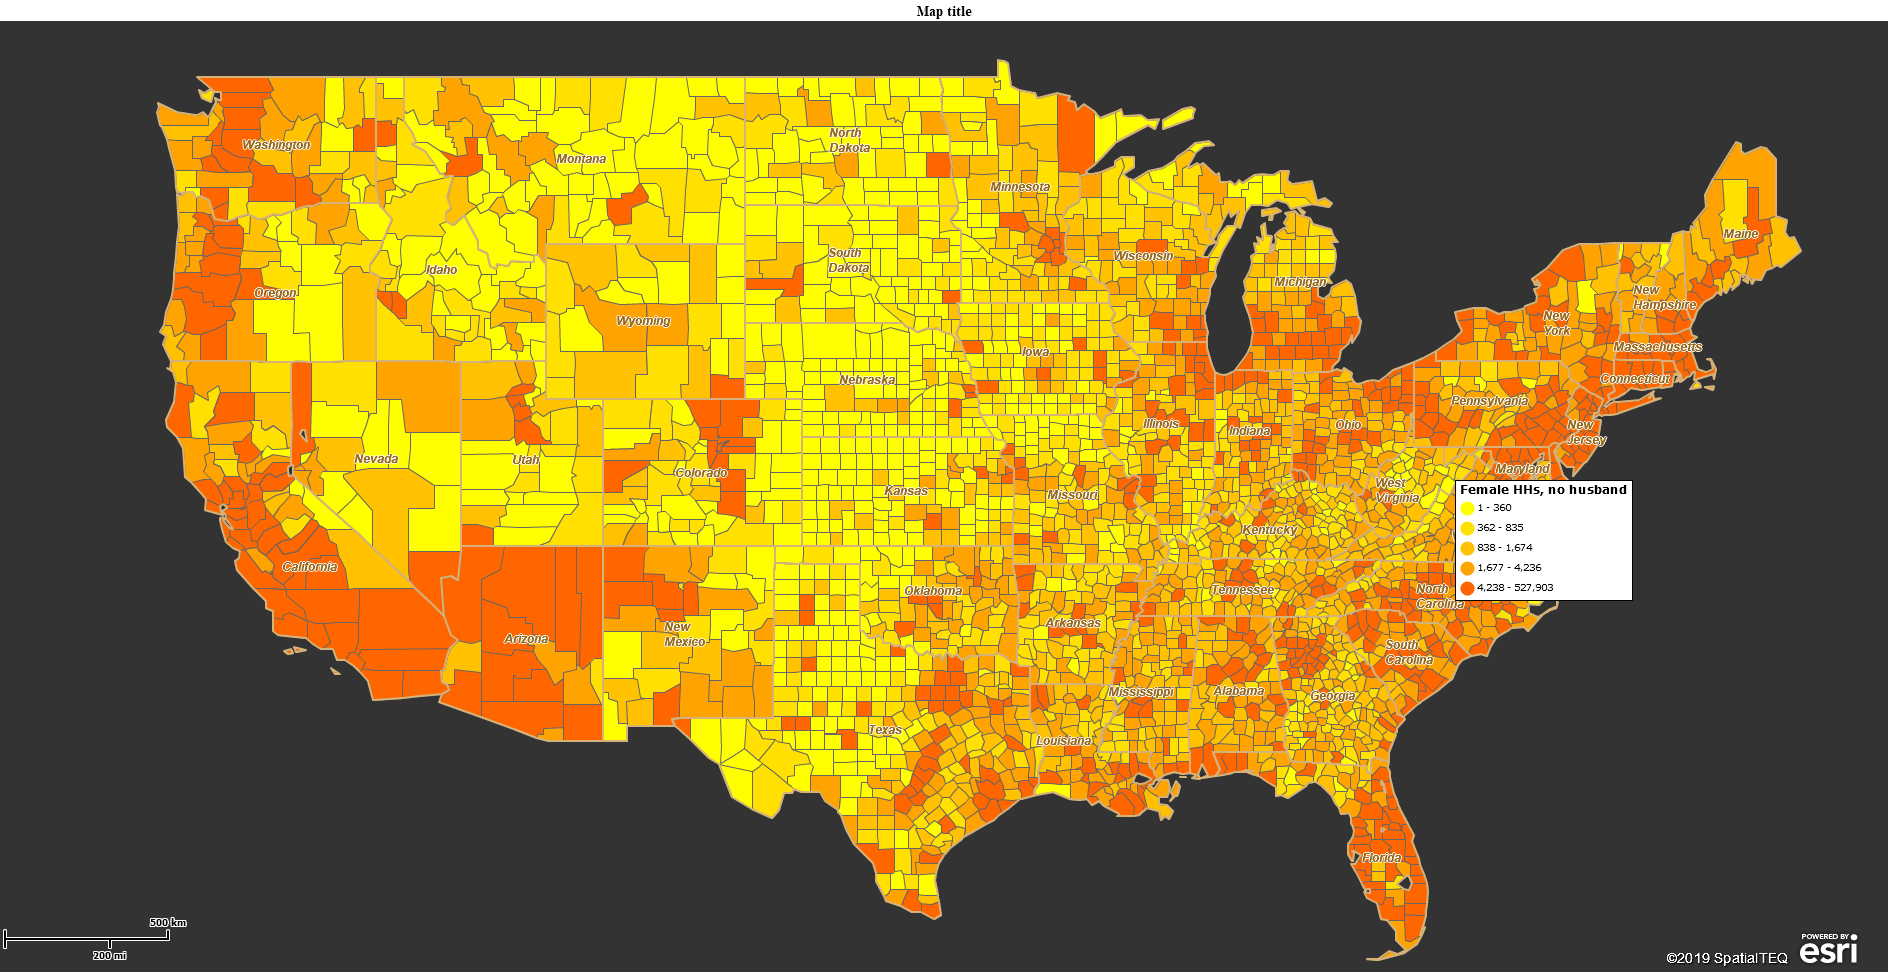
Demographic Data – Female-Headed Households No Husband (Who needs them?)

Similarly, suppose I select a ZIP code-based territory by clicking the territory label and choosing the Summary button again. In that case, I can create a similar mini spreadsheet showing the following:

  • Total Population 3,402,530
  • Not-Hispanic Population 3,324,158
  • Hispanic Population 78,372

Once again, these numbers add up.

The above example territory is a random selection of ZIP codes spanning sections of Missouri and Illinois. So, the ratio of Hispanics to Not-Hispanic makes some sense. It’s not New Mexico.

This summation comparison suggests that a lot of thought and work goes into compiling and presenting the Census Bureau’s demographic data. This data contains hundreds of subject categories generally organized by population and consumer expenditures.

A subscriber accessing MapBusinessOnline demographic data will have multiple-year options. The two most recent years are projections for Census data. The most recent Census release in MapBusinessOnline is listed as 2019 data. This arrangement of Census and projection data moves forward with each data release. The two most recent years are always projections.

Projection data providers estimate the demographic data based on trends, understanding current events, and how they may impact population, income, and other demographic categories.

Demographic Data by Map Layer

MapBusinessOnline provides a set of nine visual geographic map layers or jurisdiction segments that enable the visualization of demographic data by defined areas like ZIP codes and counties.

The ZIP code you grew up in is familiar to you as a place on Earth with rough boundaries. Adding demographic data to your view of that section of the Earth adds exciting information you may not have had before – or perhaps never knew you needed! From a business perspective, demographic data can turn a compelling perspective on your hometown into a pallet of marketing potential.

Taken a step or two further, MapBusinessOnline Pro can provide driving time and distance polygons that could represent on a map. For example:

  • Construction sites by urban area.
  • Franchise delivery services, retailers, or restaurant chains.
  • Financial institution ZIP code areas of interest for investment.
  • Insurance claim locations related to a weather disaster.
  • Healthcare system network analysis by metropolitan area.
  • Marketing campaign analysis results using Census MSA districts.
  • Professional sports team media network analysis by urban area.
  • Restaurant groupings for new market analysis.
  • Retail customer driving time tolerances.
  • Sales territory areas based on traveling rep drive time allowances.

The hits just keep on coming. Any of these business scenario areas could include demographic data. MapBusinessOnline Pro has several specific features enabling adding demographic data to territory analysis and imported business spreadsheets. Read more about MapBusinessOnline Pro here.

  • Summarize demographic data for multiple center-point radius searches.
  • Enrich an imported dataset with demographic data.
  • Create multiple driving time and distance territories with appended demographic data.

Import and View Demographic Data by Area-of-Interest

A little experimentation and playing with demographic data on a map may help your business identify existing and new markets. The first step is to import your sales activity by address or latitude/longitude coordinates into the business mapping software.

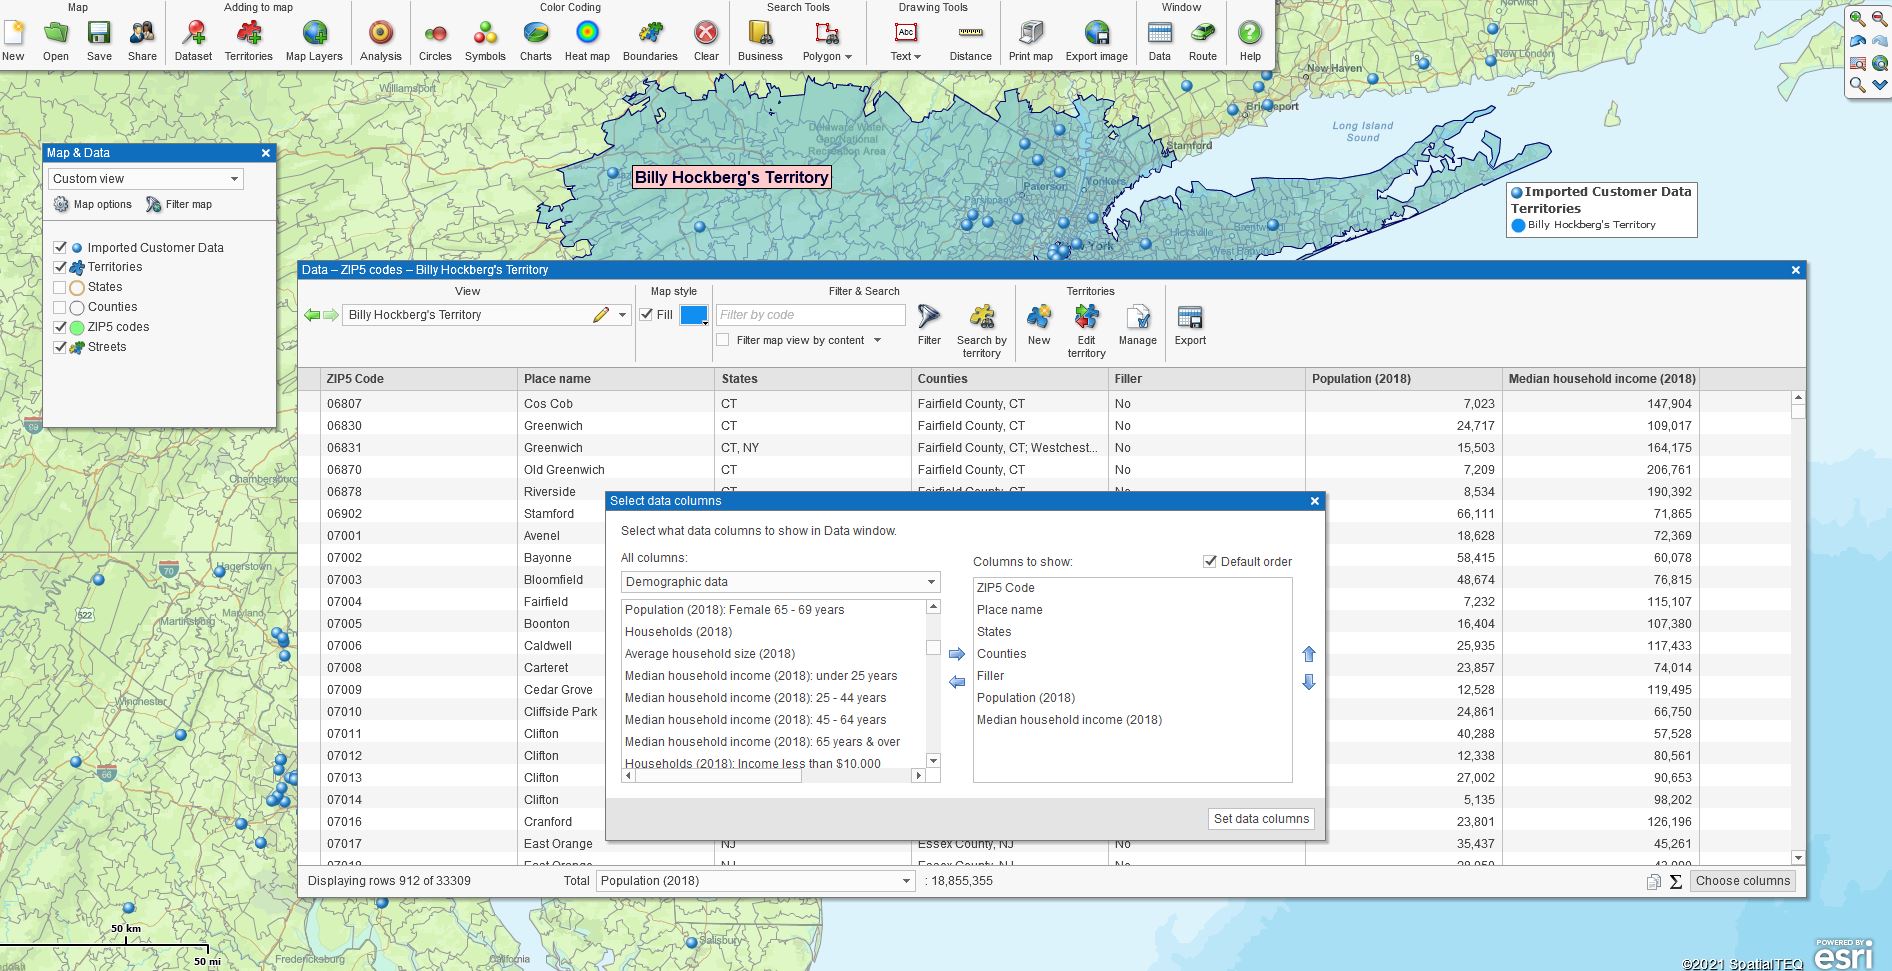
In MapBusinessOnline Standard or Pro, creating a territory or area of interest provides access to an associated database manager. Create a territory around your sales data using the ZIP code alignment layer. In the lower right of the Data Window view of that territory, click on, Choose Columns. Read more about Choose Columns here.

With the Choose Columns function open, you now have a basic database management tool that lets you select data from the left – including demographic data – and move it to the right. You are pulling demographic data from the MapBusinessOnline library and placing it in your specified area-of-interest database view. Each territory created in this saved map will have the same Data Window demographic analysis view. This demographic Data Window view is what we mean by Market Analysis in MapBusinessOnline.

The Choose Columns dialog in the MapBusinessOnline Data Window

If you sell a consumer-focused product, you probably have a pretty good sense of what demographic categories best represent your typical customers:

Product Demographic Categories
Lipstick Female, Female by age, Female by income
Child Car Seats Married couple, Female by age
Cat Accessories Population by age, Single male, Single female
Blood Pressure Meds Population by age

Here’s where the experimentation comes in. The map creator views the map to understand where areas of dense sales activity exist. Set up a Choose Columns Data Window analysis or territory in those areas. Import the most apparent demographic categories that match your known customer base.

For instance, for Lipstick sales, consider Consumer Expenditures related to cosmetics.

Always be open to more marketing categories. Look for additional types of demographic data you may not have considered before.  Think this through, and do not consider the map a finished project.

Market Analysis

With an array of ZIP codes or City Limits listed in the Analysis view, click on the header of any demographic category to change the ranking order of the data. The application adjusts the analysis view to reflect that demographic from most to least or A to Z. In this way, you can see which ZIP codes or Cities sell many products and seem to correspond to high populations of a particular demographic.  Pay attention to the other product and demographic categories. You may find unexpected patterns.

In many cases, these views are not blatantly illuminating but start to reveal a demographic profile after a process of elimination.  In some instances, the process will expose an obvious pattern. Take your time and relax with the analysis. Have fun with it. Invite your marketing and salespeople into the room to view these patterns and participate in the discussion. Each person viewing the map analysis will have a story to contribute. Personal stories can add up to patterns too.

Let It Grow

Some outcomes of this process could be:

  • The development of a demographic profile by product.
  • A decision to hold a series of market studies.
  • The beginnings of new product ideas.
  • Strong suggestions for additional marketing areas.

Use business mapping software to expose new areas of opportunity. Encourage discussion. Share ideas. And what it all adds up to is growth potential. Business mapping software to expose new areas of opportunity. Encourage discussion. Share ideas.

Grow your business.

_______________________________________________

Discover why over 25,000 business users log into www.MapBusinessOnline.com for their business mapping software and advanced sales territory mapping solution. The best replacement for Microsoft MapPoint is the most affordable.

To access MapBusinessOnline, please register and download the Map App from the website – https://www.mapbusinessonline.com/App-Download.aspx.

After installing the Map App, the MapBusinessOnline launch button will be in the Windows Start Menu or Mac Application folder. Find the MapBusinessOnline folder in the Start Menu scrollbar. Click the folder’s dropdown arrow and choose the MapBusinessOnline option.

The Map App includes the Map Viewer app for free non-subscriber map sharing.

Please read customer reviews or review us at Capterra or g2crowd.

Contact: Geoffrey Ives at geoffives@spatialteq.com or Jason Henderson at jhenderson@spatialteq.com.

Posted in Business Mapping Software blog post, How to instruction, Sales and marketing | Tagged , , , , | Leave a comment

How Does MapBusinessOnline Apply Distance Measurements?

Distance Measurements

How far is it from here to there?

Good question.  However, MapBusinessOnline will require a little more information before answering that question.

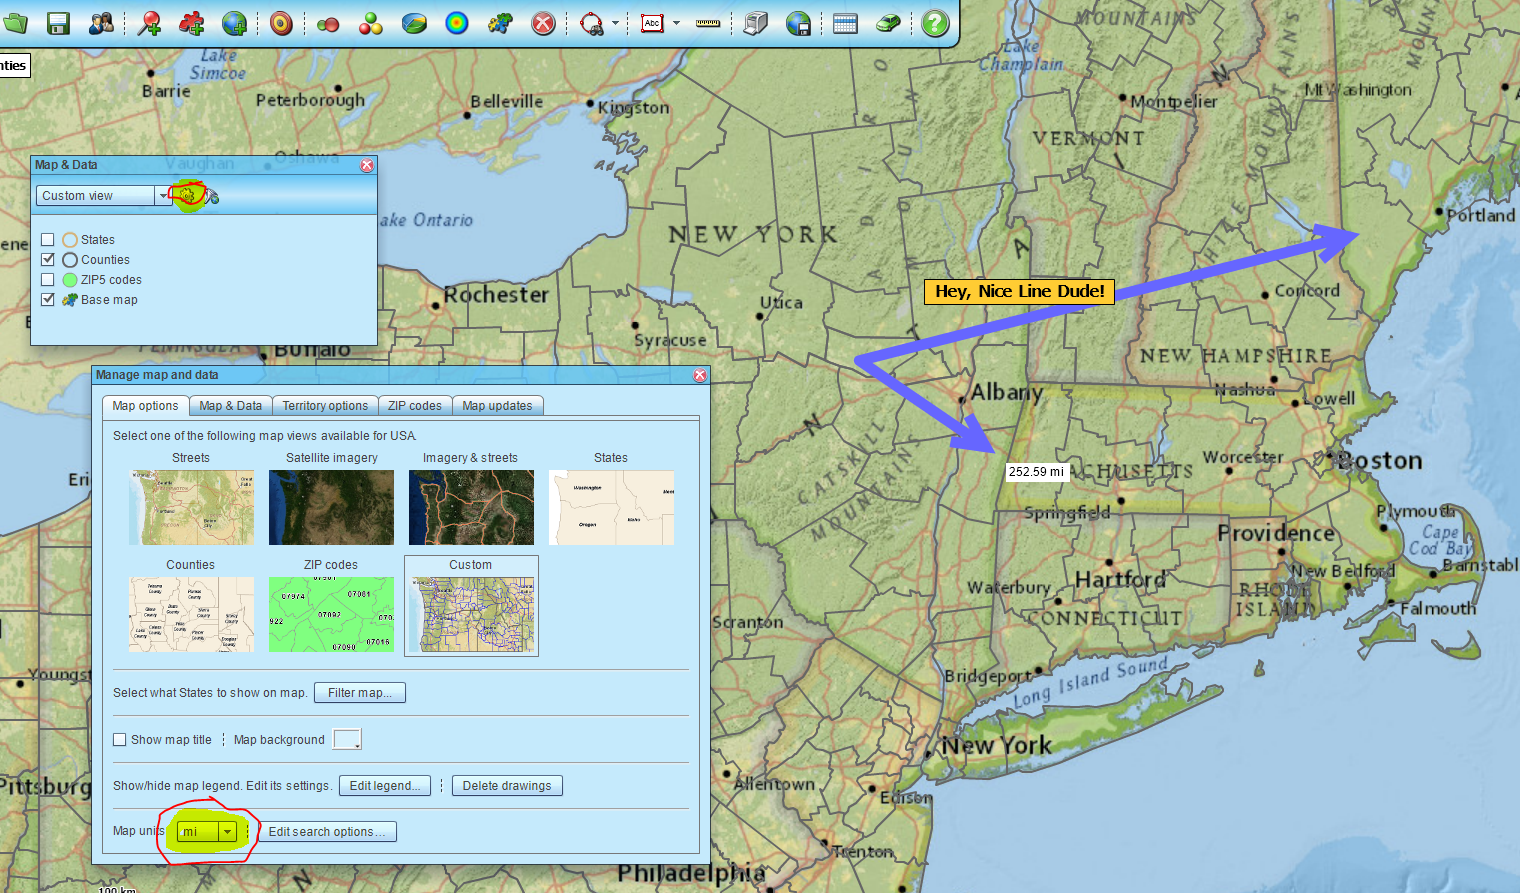
For one thing, we need to know what point on the map represents ‘here’ and what point represents ‘there.’ With location information nailed down, we can quickly draw a line from here to there using MapBusinessOnline’s distance measure tool. This drawn line will answer the question in kilometers or miles.

MapBusinessOnline Standard and Pro answer distance questions and solve problems using distance measurements. Pro is more complex than Standard, but don’t hold that against the business mapping software.

The Basic Distance Measure Tool

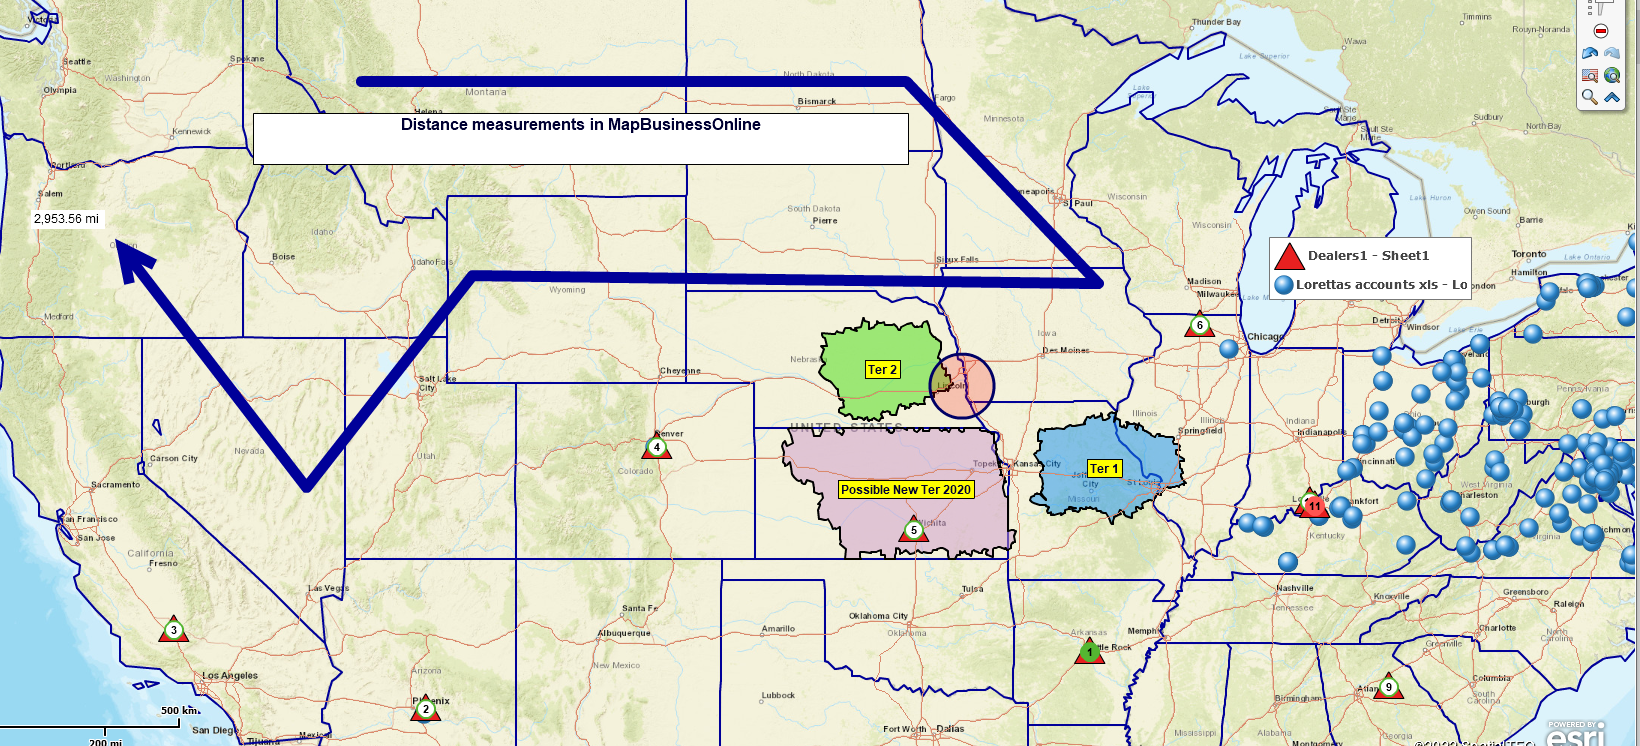
MapBusinessOnline includes a distance measure tool on the Master Toolbar. It’s the fifth button in from the right, under the current toolbar configuration, under the Drawing Tools section.  Select the distance measure tool. Click and drag from one point to the destination point. Your distance-drawn measurement will display adjacent to the line on the map.

The measure tool turns corners too. The distance dragged continues to sum. As you get used to the tool, it’s easy to delete any drawn line and start again.

This distance measure tool is the most basic way to measure or report distance in the application. Let’s explore the other methods.

Measure Tool with Unit of Measure Options

Draw and Routing Tools 

Draw tools include line, polygon, and free-form line drawing tools. MapBusinessOnline drawn lines all note distances along the lines drawn. The line tool will turn into a polygon generator once the line returns to the beginning.

Another way to get a distance measure out of MapBusinessOnline is to generate a driving route using the Routing Window. Users create routes from imported or plotted points. The user selects points on the map and decides if those ‘stops’ are for route starts, stop-offs, or finish points. A total distance and time estimate is displayed in the turn-by-turn directions result once the Route is complete.

The routing tool also presents the route distances and time estimates as turn-by-turn directions. Those directions include distances measures between each stop. Of course, these distance measures are distances along the road network instead of straight-line distances.

MapBusinessOnline Pro

MapBusinessOnline Pro introduces mass driving time and distance calculation to the features available for determining distances.

With more complex queries at your disposal through Pro, map creators can generate point-to-point distance measures across an array of points, both straight-line measurements or along the road network.

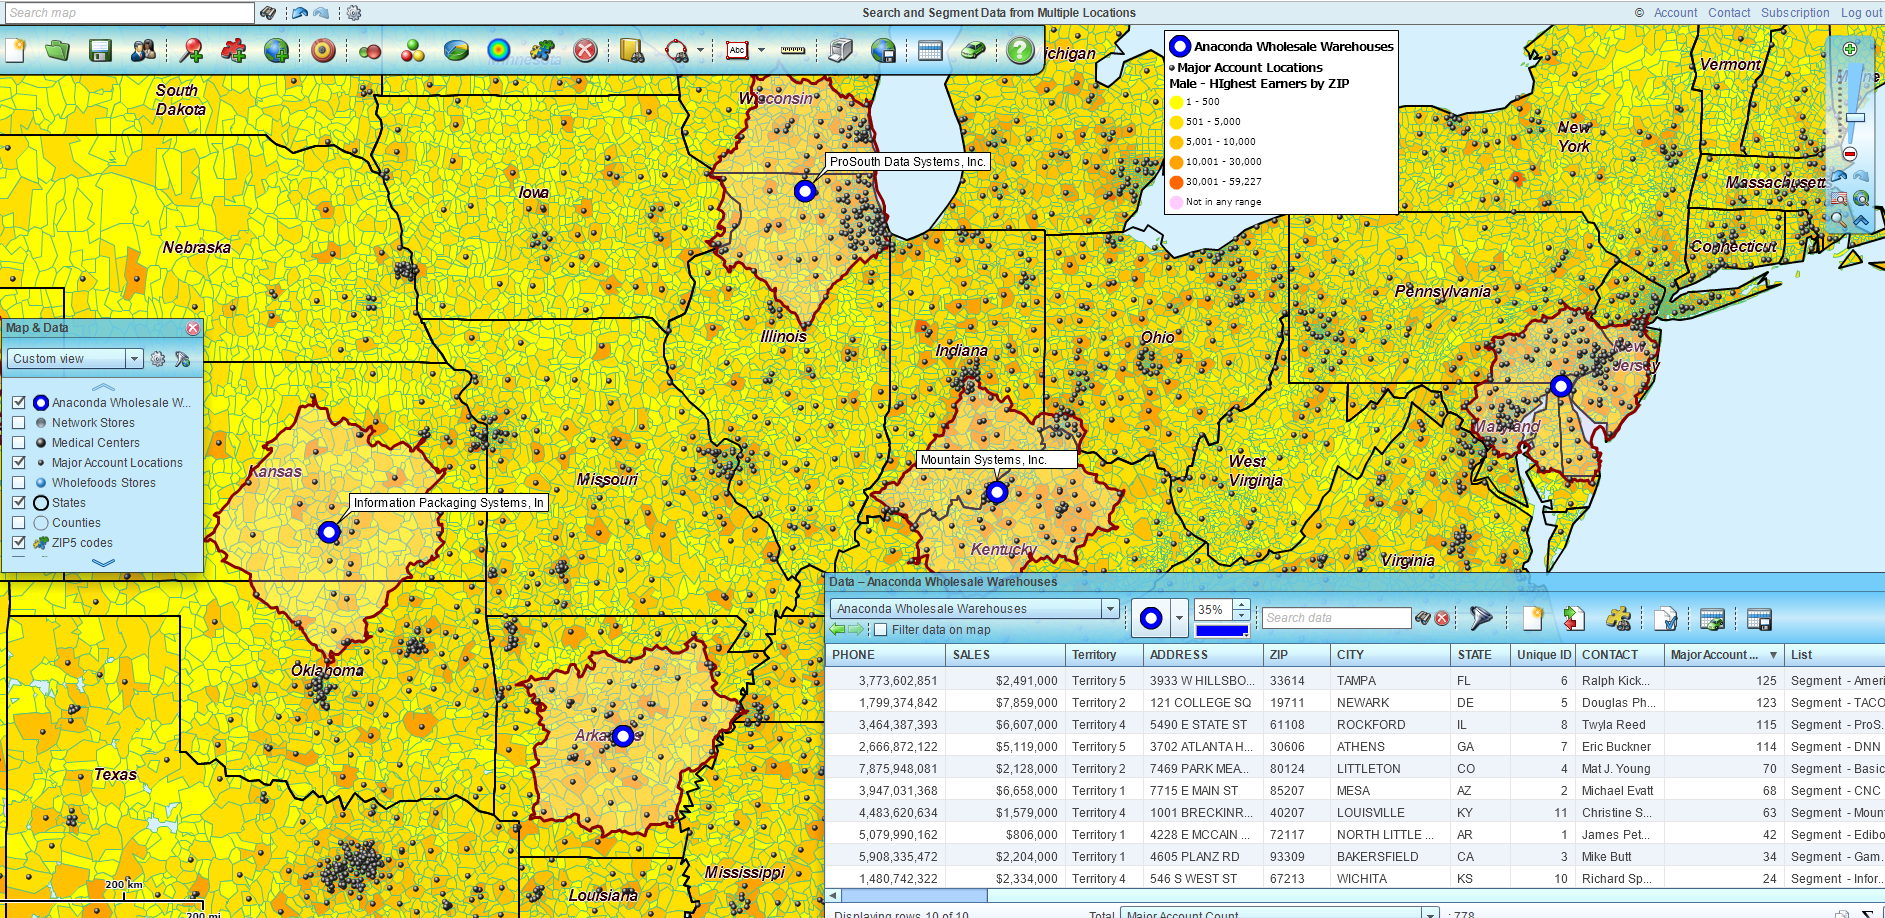
While Search and Segment across Multiple Centers operations do not measure distance, they allow the map creator to query areas around a set of central points at a specified distance or driving time. Thus, the map viewer can determine, for example, how many pizza restaurants exist within 20 miles of each of ten hospitals – potentially critical information for RN birthdays.

Such distance queries in MapBusinessOnline Pro are possible for straight-line, drive time, or driving distance results. With Pro, the map user can understand distance in crow-flies measures, how long it takes you, or how far you have to drive.

The application provides results as additional distance or time columns in the Data Window view – essentially a spreadsheet in MapBusinessOnline. Export the final product for work or sharing outside the application.

Search & Segment by Multiple Drive Times

Batch Calculate Distances and Times also adds distances and or times to a Data Window dataset. But here, we compare two datasets of 1,000 records and calculate the distance or time between all points in both datasets.

So, in this case, if we had 1,000 nurses at home and 250 hospitals, we could determine how long each nurse would take to get to each hospital.   Such distance or time calculations are great for projecting travel expenses or estimating commute times.  And yes, MapBusinessOnline drive time calculations consider average traffic times by the time of day and day of the week.

Find the Nearest calculations also to multiple points on a map.  These calculations return lists of the nearest locations to a set of selected points.  In this case, our nurses might have 250 home locations, and we could find the nearest 3 WaWa convenience stores within ten driving distance miles of each nurse’s home.

Once the calculation is processed, we can export the Data Window report, with distances noted, as a CSV file, showing a list of those closest stores, and direct the nurses to meet a representative at each WaWa store to share a bag of Doritos.  Don’t forget to wear a mask.

At any rate, distance is once again used to solve a problem.

All this is to show that MapBusinessOnline Standard and Pro have a variety of ways to display distance measurements, depending on the nature of the business problem requiring a distance measure.

Read more about MapBusinessOnline Pro’s advanced mapping capabilities here.

_______________________________________________

Find out why over 25,000 business users log into www.MapBusinessOnline.com for their business mapping software and advanced sales territory mapping solution. The best replacement for Microsoft MapPoint happens to be the most affordable.

To access MapBusinessOnline, please register and download the Map App from the website – https://www.mapbusinessonline.com/App-Download.aspx.

After installing the Map App, the MapBusinessOnline launch button will be in the Windows Start Menu or Mac Application folder. Find the MapBusinessOnline folder in the Start Menu scrollbar. Click the folder’s dropdown arrow and choose the MapBusinessOnline option.

The Map App includes the Map Viewer app for free non-subscriber map sharing.

Please read customer reviews or review us at Capterra or g2crowd.

Contact: Geoffrey Ives at geoffives@spatialteq.com or Jason Henderson at jhenderson@spatialteq.com


Posted in Business Mapping Software blog post, How to instruction | Tagged , , , | Leave a comment

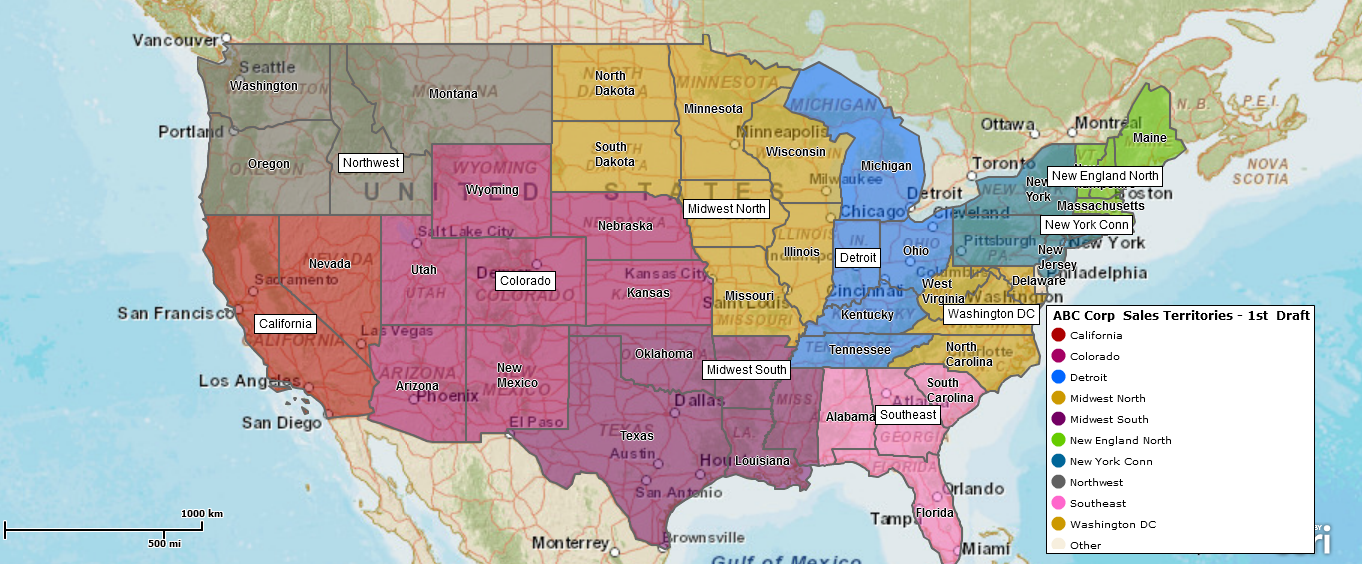
Sales Territory Mapping Using MapBusinessOnline

Most MapBusinessOnline users come to the application searching for sales territory mapping software. Sales territory maps help organize sales teams, focusing the team on sales goals, assigning accountability, and driving results.

Read on to get a sense of how these sales territory tools work.

MapBusinessOnline sales territories use one base map alignment layer, usually ZIP codes, Census tracts, counties, or state layers. This geographic territory structure rule enables the database/analysis view for all territories, regions, and divisions. It provides the basis for a territory database management system that provides:

  • Demographic analysis by territory.
  • The ability to add additional data columns to the analysis, including imported business data.
  • The ability to sum across all territory columns for analysis purposes.
  • The ability to filter territory data by a variety of modifiers.
  • Report generation for export as CSV files.

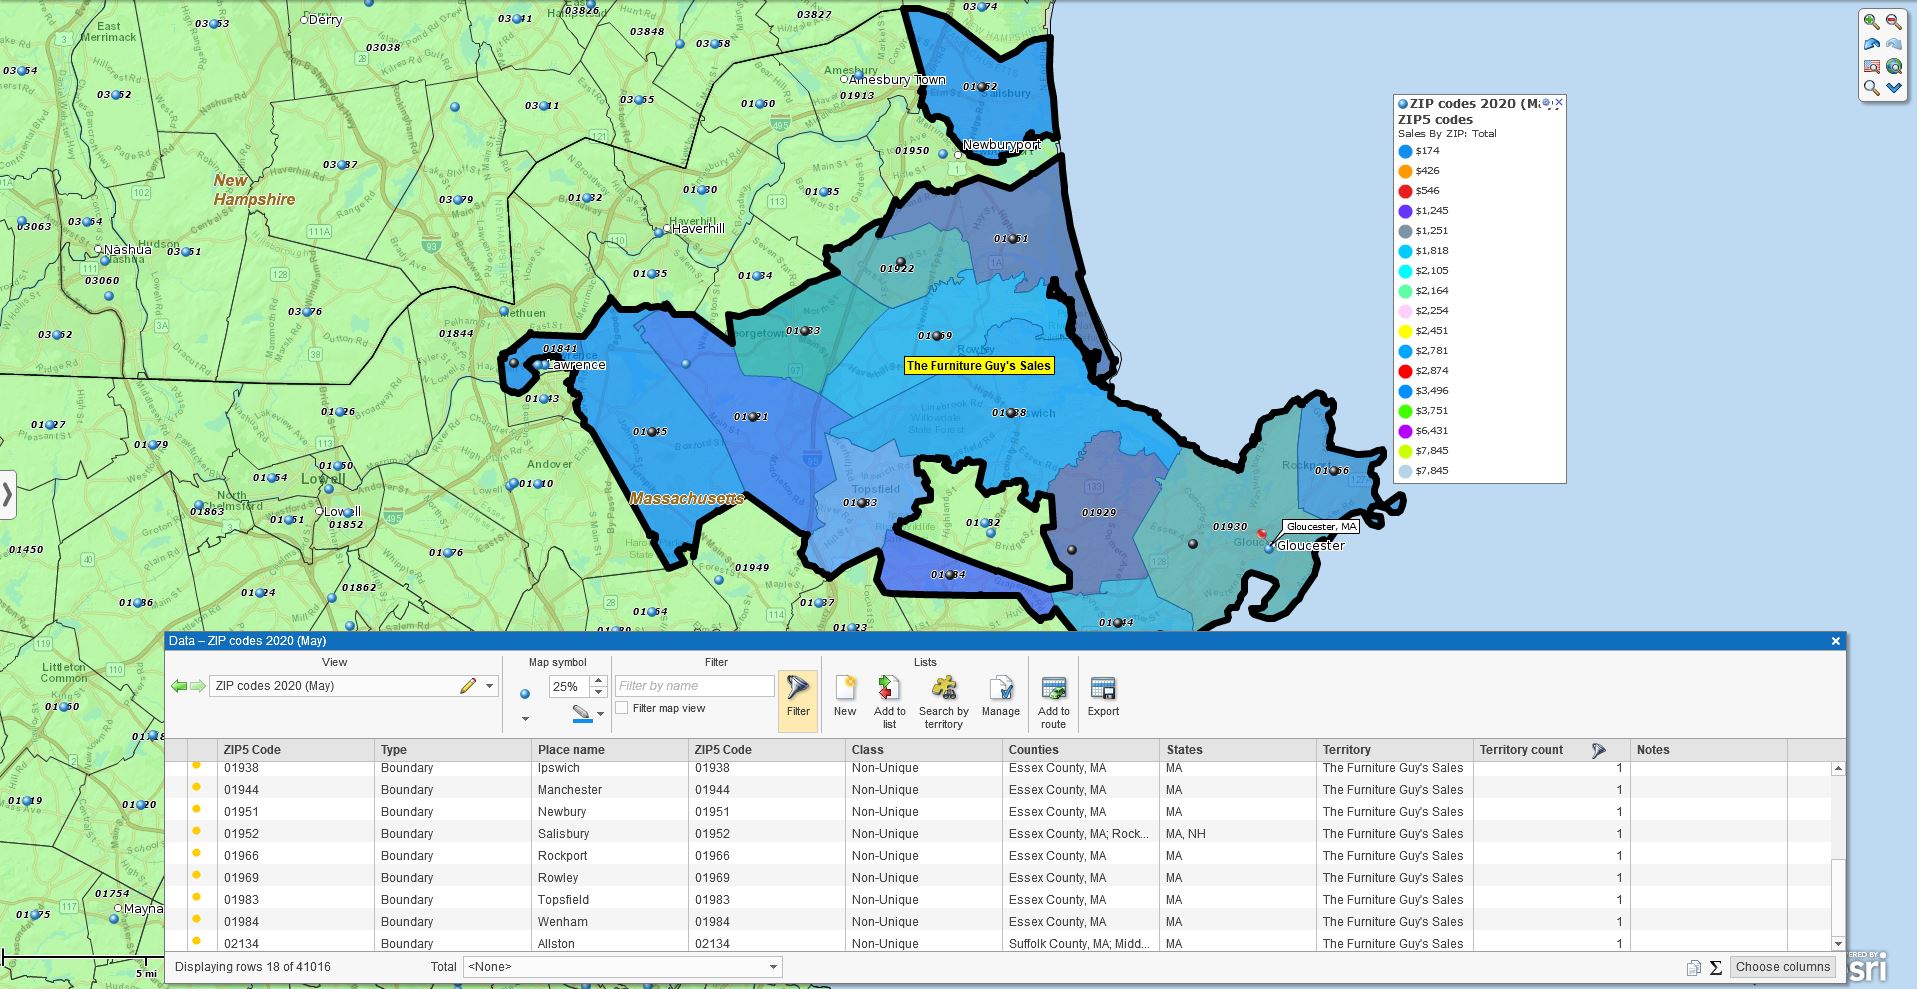
The sales territory color-shaded areas created using MapBusinessOnline are the geographic map visualization component of territory mapping. The user and map viewer see groupings of ZIP codes, Counties, or States arranged in territories and color-shaded for differentiation based on sales assignment or associated data.

Map creators can only use one territory alignment layer for each territory – You cannot combine ZIP codes and counties in one territory. This fundamental rule in MapBusinessOnline sales territory mapping implies the following:

  1. To split a one-state territory into smaller segments, the territory must be based on a ZIP code or county alignment layer. For split counties, revert to a ZIP code territory alignment layer.
  2. ZIP codes are the preferred territory base map layer for 90% of our customers.
  3. Users can create separate territories on varying alignment layers. For example, you could have a ZIP code-based territory and a county-based territory in your territory project.

Creating Territories

Territory maps are created manually  in MapBusinessOnline by:

  1. Gathering map layer objects like ZIP codes with a polygon or freeform search tool.
  2. Clicking on an alignment layer object (like a ZIP code) and holding down the shift key to select more than one.

Territories can be more automatically created by:

  1. Importing a prearranged list of sales territories from an Excel spreadsheet.
  2. Creating multiple territories through drive time queries across numerous center points.

Read more about territory creation here.

Step-by-step instructions are in the help documentation.

While MapBusinessOnline supports freeform drawn map objects using draw tools, these drawn areas do not support a database of location data. We recommend that all business mapping software users stick with the map layer-based territory construction.

Overlapping territory areas can be visually highlighted by turning on the Intersect Options in the Map and Data Territory Options Tab. Choose a color that indicates territory overlap. Most people use bright red or black.

A Simple ZIP-code Territory Map Using MapBusinessOnline

Editing Sales Territories

Once created, the Map Creator can edit territories to reflect changes in sales coverage, territory naming, color-coding scheme, and general updates for balancing workloads and account assignments.

Select the ZIP code (or other map alignment layer objects) for geographic territory assignment adjustments to be edited, added, or removed. A pop-up menu will appear with options listed. Choose the Edit Territory option and then proceed with the operation option desired. To select more than one ZIP code for editing, hold down the shift key and click Edit Territory.

Your operation options include the following:

  • Create new
  • Merge
  • Add to
  • Remove from
  • Update
  • Intersect with
  • Remove from all except

In the case of Merge territories (a new feature), select one territory targeted for merging. Hold down the shift key and select the second merger candidate. Click the Merge button on the pop-up dialogue. Next, choose which operation you prefer in the Dropdown provided – deleting old territories or preserving empty territories. Click Merge.

Read more detail about how to edit sales territory maps here.

The Data Window – MapBuisnessOnline’s Territory Analysis Panel

The Data Window is always accessible from the Master Toolbar by clicking the second button from the right. That Data Window button is a spreadsheet icon. Click the button, and a tabular data view of all the map layer data, any imported data layers, and territories, regions, and divisions you’ve created.

Any created Territory in MapBusinessOnline gets a Data Window data analysis view. That tabular view of any territory will include the following:

  • The map assignment layer. In the case of ZIP codes, the layer will display all the boundary ZIP codes contained within the territory’s geography.
  • MapBusinessOnline automatically assigns some columns – Primary State, Primary County, Place Name, States, Counties, and Filler. I typically remove (move to the left) the Primary map layers and the fillers. Place Names are town names, and they can come in handy.

By clicking the Choose Columns button in the lower right, the map creator can select these columns to move them out to the left or choose additional columns of data from the left to move to the right and into the analysis. In this way, territory analysis gets populated with critical relevant data. Available data includes:

  • Demographic data.
  • Imported business data.
  • Business listing data with firmographics.
  • Counts per ZIP or Territory.

The map creator establishes a market analysis view of the territory map by carefully selecting and deselecting data layers in the territory analysis Data Window view. This market analysis view is compelling. Thousands of customers use MapBusinessOnline territory analysis views:

  • All kinds of market analysis.
  • Competitor mapping.
  • Customer and lead assignment.
  • Demographic mapping.
  • Expansion planning.
  • Sales and marketing campaign planning and reporting.
  • Sales territory balancing.
  • Site assessment.
  • Strategic planning.

Professional Tips on Sales Territory Mapping

Here’s a list of the best approaches based on a few years of experience with Sales Territory Mapping:

Try the ZIP Code Alignment Layer First – Most users use ZIP codes as the base alignment map layer. New users sometimes avoid ZIPs because they figure it would be more of a burden due to the high volume of map objects. Try ZIPs.

  • Most users find they are more comfortable with ZIP codes.
  • Because ZIP codes have smaller areas, they provide more flexibility.
  • ZIPs and demographic data are made for each other. ZIP code demographic love is especially true for retailers who should want to understand their neighborhoods.

Avoid Territory Overlap – While MapBusinessOnline does provide overlap controls, seek to avoid territory overlap.

  • It muddies account responsibility.
  • The more overlap you allow, the harder it is to display.
  • Overlapping coverages tend to generate animosity between reps and eventually between reps and customers.

Save Your Territory Maps as a Map Template – You or your people put a lot of company time and effort into creating your sales territory mapping. Don’t risk losing the maps. Save all territory work as a Map Template in the My Templates folder.

  • Click Save.
  • In the Dropdown, select the My Template folder.
  • When developing new maps from territory templates, save them as My Maps.

Replace Microsoft MapPoint with MapBusinessOnline – MapBusinessOnline territory mapping software is an easy replacement for MapPoint. Just remember, Microsoft MapPoint was a giveaway by Microsoft. Decent territory mapping is going to cost a little more.

  • If you still have your most recent MapPoint version, we may be able to convert your territories to MapBusinessOnline.
  • MapBusinessOnline is a better territory mapping software.
  • MapPoint was canceled by Microsoft 6 years ago. Yikes! Get with a program.

MapBusinessOnline has thousands of users happily creating sales territories using the tool. Don’t languish on the sidelines pining for a territory system. Get with our program – MapBusinessOnline – today!

_______________________________________________

Discover why over 25,000 business users log into www.MapBusinessOnline.com for their business mapping software and advanced sales territory mapping solution. The best replacement for Microsoft MapPoint happens to be the most affordable.

To access MapBusinessOnline, please register and download the Map App from the website – https://www.mapbusinessonline.com/App-Download.aspx.

After installing the Map App, the MapBusinessOnline launch button will be in the Windows Start Menu or Mac Application folder. Find the MapBusinessOnline folder in the Start Menu scrollbar. Click the folder’s dropdown arrow and choose the MapBusinessOnline option.

The Map App includes the Map Viewer app for free non-subscriber map sharing.

Please read customer reviews or review us at Capterra or g2crowd.

Contact: Geoffrey Ives at geoffives@spatialteq.com or Jason Henderson at jhenderson@spatialteq.com.

Posted in Business Mapping Software blog post, How to instruction | Tagged , , , , , | Leave a comment

The Singular Drive Time Capabilities of MapBusinessOnline Pro

Driving time and driving distance calculations enable in-depth analysis for businesses that want to conflate their critical locations with US Census demographics, commuting data, and other essential business elements.

These drive time calculations are large, complex operations. They can analyze the entire USA road network across multiple center points and large distances. That’s a lot of data to process. Be aware that these calculations can take hours to complete.

Results of extensive MapBusinessOnline drive time calculations display in tabular format, usually adding columns to imported datasets. All results are easily exportable as CSV files.

Easier than You Think

Driving time and distance queries can undoubtedly be intimidating to new users – especially for business mapping users who are not used to geographic information systems (GIS) analysis. Terms such as ‘spatial queries.’ ‘shapefiles’ and ‘buffer zone’ can perplex the mapping novice. But that’s why you came to MapBusinessOnline.

In MapBusinessOnline Standard, business mapping analysis involves importing basic address spreadsheets and viewing these location points against a map. MapBusinessOnline enables the summing of demographic and business data by the map layer objects (like ZIP codes) around these points. Most new business mapping users quickly pick up on these features and calculations. Think of business mapping as the next step up from Excel spreadsheets.

A Giant Swarm of Bees of Just Location Data?

MapBusinessOnline Standard Driving Time & Distance Features

MapBusinessOnline Standard allows a drive time or driving distance calculation around a single point at a time. Each Standard drive time calculation begins by placing a point (address or Lat/Lon) on the map. Point placement is done through the address bar or by dropping a point with a draw tool. Either way, once selected, the user gets the drive time creation option from a menu of services.

When the drive time or distance option is selected, a user must choose between a stated time or distance, which the application will then use to calculate the results. For instance, a point placed at 100 Main St., St. Louis, MO, might be associated with a 180-minute drive time calculation. The map would then display a jagged polygon around St. Louis with the driving area surrounding the selected point in all directions. Likewise, a user could choose a distance instead of a time, and a similar calculation is initiated based on driving 180 miles in all directions around St. Louis.

Drive Time Polygons

All shaded areas can be adjusted for color, transparency, and boundary visualization. In MapBusinessOnline Standard, those results appear visually on the map as a Drive Time polygon. In MapBusinessOnline Standard, a drive time polygon can be the basis area for a territory. Sales territory creation would use the drive time polygon as the ZIP code, City limit, or County selection figure – creating one territory at a time.

Drive time polygons are used to sum demographic data categories for the bounded ZIP codes or City limits.

One could also select a DriveTime polygon tool from the set of Search Tools available from the master Toolbar. Click the Drive Time polygon tool and place your point manually on the map. A dialogue appears presenting the option for Time or Distance calculations and the time of day/day of week options. Time of day options makes the calculation inclusive of average vehicle traffic impacts on drive time calculations.

MapBusinessOnline Pro Driving Time & Distance Analysis

MapBusinessOnline Pro extends the Standard driving time and distance calculations, so they apply across multiple center point locations simultaneously. This multi-center point capability enables calculation results to feed into columns of spreadsheet data.

The MapBusinessOnline Pro Analysis button lists the multiple functions of the tool. In a way, the list simply applies our set of driving time and distances calculations to each operation in slightly different ways, which completely change the nature of the results:

  • Search & Segment Data from Multiple Centers – Simultaneously find data within multiple drive time polygons. Supports multiple territory creation.
  • Batch Calculate Distances & Times Across One or Between Two Point Datasets – Transportation network analysis adding distances or times between all points. Powerful and sometimes time-consuming queries.
  • Find the Nearest – A proximity search. Show me a spreadsheet of the nearest XYZ to all of my locations.
  • Aggregate Customer Data and Summarize Demographic Data provide data enhancements based on drive time and distance queries.

Not every customer we talk to requires  MapBusinessOnline Pro. But when the customer actually needs driving time calculations, they totally get it. And they like the price too. We challenge you to find Pro functionality for a more affordable price.

Develop Market Profiles

Actual MapBusinessOnline Pro Drive time applications include:

  • Real estate assessment and appraisal analysis. Property values and home price levels can be associated with particular areas of interest, providing real estate data queries for buyers and sellers. Drive time analysis allows the map creator to associate demographic and other imported real estate location data with commuting distances, geographies, or property proximities to specific services.
  • Retail chain store analysis & expansion planning. With retail chain stores as center-points, drive time analysis provides competitive analysis supporting expansion planning. Retail saturation levels are derived by comparing store densities and demographic realities.
  • Retail Product Sales Analysis. Hierarchical sales & marketing tracking by channel, store, and area. Channels can vary – retail chains, manufacturer’s rep outfits, or niche market distribution centers.
  • Bank loan analysis and tracking. Loan agencies view city areas and population centers by median income levels and existing loan risks for a given population. Business mapping helps visualize the risk by area while drive time analysis services a realistic area of interest for the study – more than one area of interest.
  • Demographic analysis for government planning. Drive time assessments create geographic segments easily paired with demographic data categories, voter registrations, and other business data. City, State, and Federal agencies can easily access geographic analysis tools to build models for planning and assessment.
  • Transportation cost analysis. Transportation studies analyzing fuel costs, road degradation, and future needs benefit from drive time and distance queries. Road networks provide the fundamental structure for drive time analysis.
  • Sales territory Creation & Analysis. Sales managers are often required to create territory models based on various criteria. Multiple center-point drive time queries present drive time areas that can be quickly and effectively converted into ZIP code territories.
  • Market analysis for New Region Exploration. Identify lucrative business regions and find similar areas in undeveloped sections of the nation. Drive time demographic analysis of existing business areas is easily conflated with potential markets.

Baseline Market Analysis Map

Many businesses are turning to MapBusinessOnline Pro because it provides a unique set of features related to driving time and distance calculations that are very expensive to apply using traditional, alternative solutions. Customers who discover these tools and use them stick with us. We’re kind of in a space all by ourselves.

If this blog puts you to sleep, you probably don’t require MapBusinessOnline Pro. But if your palms are sweating and you shut off an Instagram reel to read this, sign up.

_______________________________________________

Find out why over 25,000 business users log into www.MapBusinessOnline.com for their business mapping software and advanced sales territory mapping solution. The best replacement for Microsoft MapPoint happens to be the most affordable.

To access MapBusinessOnline, please register and then download the Map App from the website – https://www.mapbusinessonline.com/App-Download.aspx.

After installing the Map App, the MapBusinessOnline launch button will be in the Windows Start Menu or Mac Application folder. Find the MapBusinessOnline folder in the Start Menu scrollbar. Click the folder’s dropdown arrow and choose the MapBusinessOnline option.

The Map App includes the Map Viewer app for free non-subscriber map sharing.

Please read customer reviews or review us at Capterra, or g2crowd.

Contact: Geoffrey Ives at geoffives@spatialteq.com or Jason Henderson at jhenderson@spatialteq.com

Posted in Business Mapping Software blog post, How to instruction | Tagged , , , | Leave a comment

What Can You Do with Location-Data Using MapBusinessOnline?

As a MapBusinessOnline subscriber, once you’ve imported a location-based dataset into the application, there are many things you can do with the data.

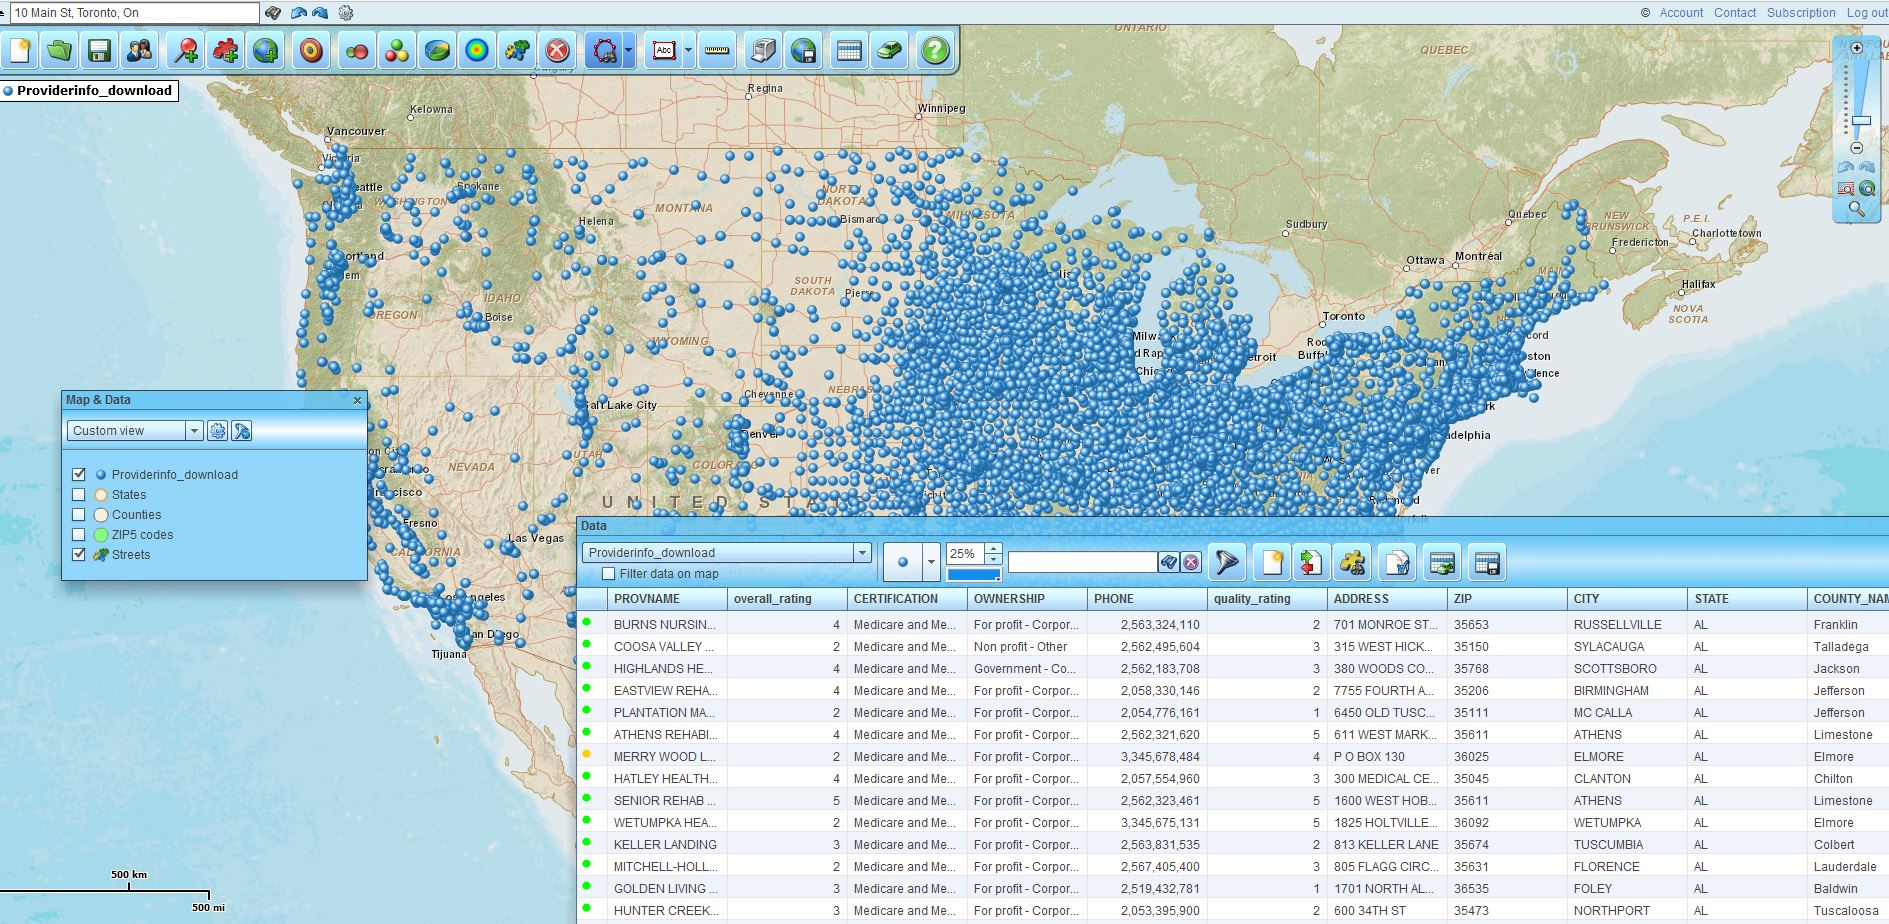
Not to be underemphasized, viewing a new dataset against a business map can be very informative. The application places dots or small colored circles on the map upon import. Map creators can immediately adjust the symbol-set applied, color, and size. In Map and Data, hover over that data layer and click the Edit Layer Properties gear. You will find adjustments for symbol, size, and color in the opening panel. Go nuts.

Assisted Living Centers – Find Location Data that supports your map project

Review your imported dataset against the background map. Look for clusters, outliers, and inaccurate location placements. Remember, garbage-in garbage-map. When importing data:

  • Use full addressing for the most accurate point placements.
  • For latitude longitude imports, make sure the formatting is correct.
  • Ensure the ZIP codes assigned are valid or don’t use only ZIP codes.

Read about how to import business datasets into MapBusinessOnline.

Read about editing imported data here.

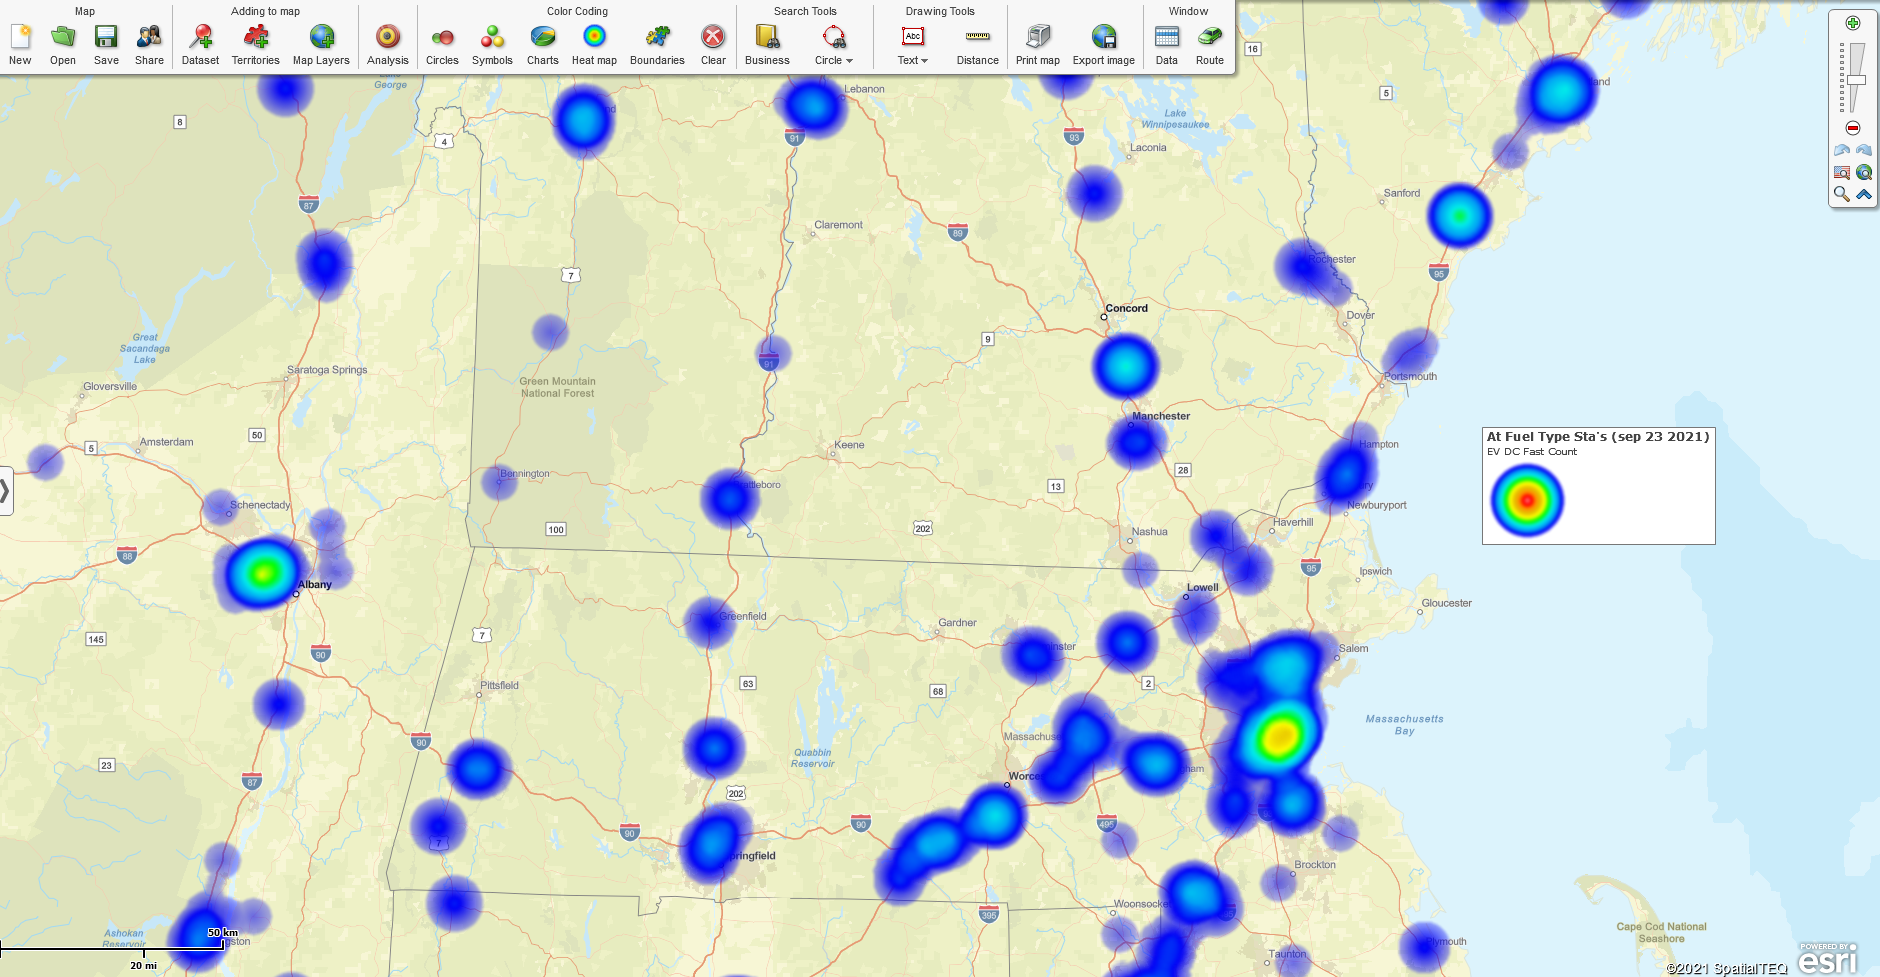
EV Charging Stations Heat Map View

Symbolize and Color-code Your Data Imports

With your data imported and initially viewed for accuracy, consider color-coding the symbols assigned. Click the Color-code Symbols button on the master toolbar.

  • Review the symbol options in the symbol library. Try symbol options and adjust sizes and colors.
  • Consider importing your symbols.
  • Think about which column of your imported data would make the most informative color-coding scheme.

You do also have the option to color-code by circle. This approach provides a few advantages over the more common color-code by symbol style:

  • Circles offer a more comprehensive range of sizes and color gradations.
  • Circles allow numeric labels on the circle.

As you import more datasets to your business map, you may find using different symbolizing methods for the differing imported layers. Think about which datasets layers provide play the most critical role in supporting your map’s purpose. That layer should get top billing on your map with the most outstanding color-code scheme.

Remember to limit your imported data layers to only those layers that add value to the map. Too many data layers encourage the aforementioned garbage map.

Demographic Data – Female-Headed Households No Husband

Keep in mind; you always have the option of leaving one layer altogether, one symbol, and one color. Applying one symbol of one color might be the best option for a high-volume, low-value point layer.

Remember adding datasets to your map creates a Map Legend object over the map. Be sure to optimize your map legend and make sure it helps your map sign. Read more about map legend editing.

Filter that Data

Data filtering supports business maps that solve specific problems. MapBusinessOnline is a geographic database management tool laid over a world map. As such, the business map user can filter any imported data layers.

For instance, call-center maps show technicians where all like data points exist to provide service options for customers who call in. “Let me see what I’ve got. Yes. I see six different locations for hard drive repair in your area. What’s your address, and I’ll send you the contact info for the closest shop?”

Data filtering in MapBusinessOnline allows users to create subset data layers of their imported data. Map creators use subset datasets for a variety of purposes:

  • For optimized vehicle routing.
  • For export and use outside of the application.
  • For additional mapping queries – driving time and distance analysis, proximity searches, and more complex mapping.
  • For daily or weekly fieldwork.

Read more about location-based dataset filtering in MapBusinessOnline.

With data imported into a business map:

What Else Can You Do with Location Data in MapBusinessOnline?

  • Export route files in GPX format. GPX formats are used in portable navigation devices for route sharing.
  • View the distribution of customers on a map for analysis in:
    • Expansion planning.
    • Insurance claim investigations.
    • Territory assignments.
    • Retail store planning.
    • Trade show planning.
    • Strategic planning.
  • Create resource maps. Import collected location points of critical resources. These resources could be:
    • Billboards.
    • Construction sites.
    • Dog parks.
    • Hospitals.
    • Restaurants.
    • Vaccination sites.
    • Telephone poles.
    • Town public water access points,
  • Import and visualize any set of field-collected location data to consider related impacts:
    • Crime sites – murders, robberies, and insurrections.
    • Real estate locations for investor analysis.
    • Traffic data collection points.
    • Trash collection activity sites.

My point is that location data is all around us, an ongoing fact of life now. Like anything else, location resources are a Google search away. Find these datasets and use them for your business projects. There’s gold in them, there location points. (Grammarly hates that last sentence.)

_______________________________________________

Find out why over 25,000 business users log into www.MapBusinessOnline.com for their business mapping software and advanced sales territory mapping solution. The best replacement for Microsoft MapPoint happens to be the most affordable.

To access MapBusinessOnline, please register and then download the Map App from the website – https://www.mapbusinessonline.com/App-Download.aspx.

After installing the Map App, the MapBusinessOnline launch button will be in the Windows Start Menu or Mac Application folder. Find the MapBusinessOnline folder in the Start Menu scrollbar. Click the folder’s dropdown arrow and choose the MapBusinessOnline option.

The Map App includes the Map Viewer app for free non-subscriber map sharing.

Please read customer reviews or review us at Capterra, or g2crowd.

Contact: Geoffrey Ives at geoffives@spatialteq.com or Jason Henderson at jhenderson@spatialteq.com
Posted in Business Mapping Software blog post, How to instruction | Tagged , , , | Leave a comment

How Do I Search Within X Radius Miles of a Central Point?


How do I search for data points within a defined Radius distance of a central point?

This question has come up a lot lately. Potential MapBusinessOnline buyers want to know if the product will identify all their customers, clients, stores, resources, or locations within a stated radius distance of a central point.

The answer is, of course, a resounding ‘Yes!’ But I’ve got 750 words to write for this week’s blog, so let’s expound on the subject a bit.

When applied to business mapping, the term’ radius’ always implies the placement of a circular object on the map. Google tells me a Radius is the distance between a circle’s center point and its perimeter, which makes sense. And then there’s the classic formula bringing PI into the mix: r = C/2π.

Let’s leave Pi out of it for the 3.14 minutes you take to read this blog.

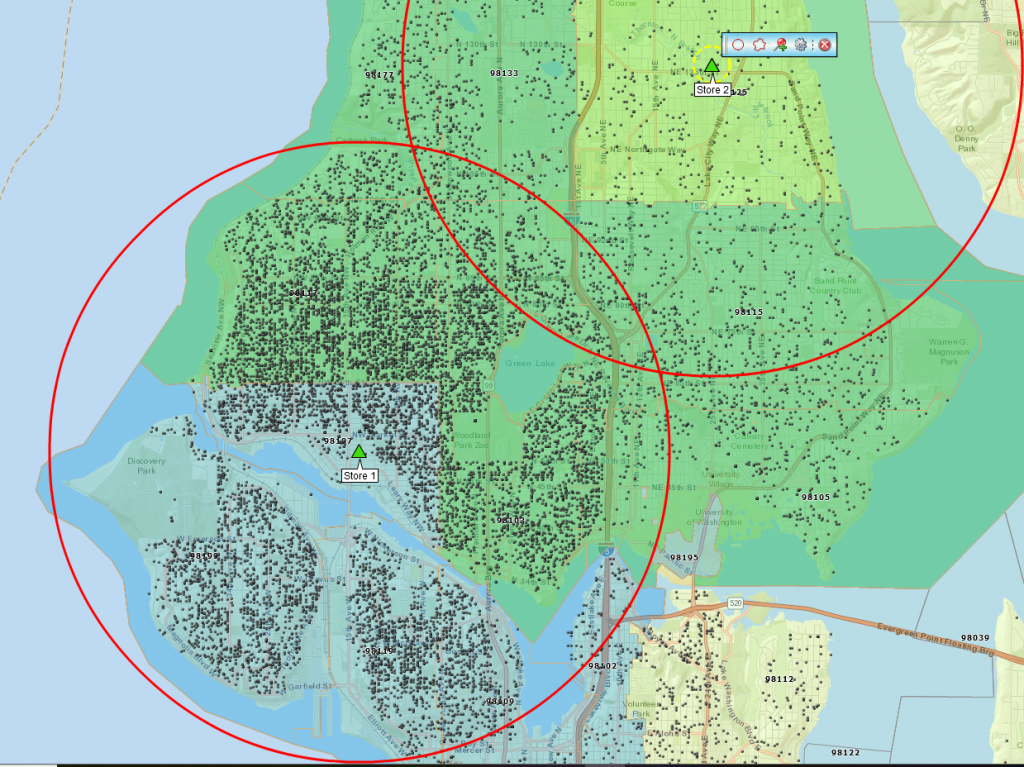
In today’s business vernacular, a business map user will reference the word radius to mean creating a circle on the map to query data within that circle. At MapBusinessOnline, we call that a ‘Radius Search.’ Searching for data on a map could also be called a Spatial Search.

Targeted Data for Radius Searches

These radius searches or spatial searches are generally searches for sales leads or customer addresses. But they could be searching for any location data included with or imported into MapBusinessOnline. For instance, a person could search the central Portland, Maine ZIP codes for all single women ages 35 through 50 who have a household income between $75,000 and $250,000. MapBusinessOnline has all the demographic and geographic data required to get those search results.

MapBusinessOnline Radius Searches allow a business map user to search any of the various location datasets included in the tool:

  • Map layer objects – Census tracts, city limits, counties, MSAs, states, ZIP5, and ZIP3 codes.
  • Imported user data – Typically, customers, new leads, clinicians, patients, or other imported location points.
  • Business Listings – Paid for business location points downloaded from the MapBusinessOnline Business Listings Search tool.
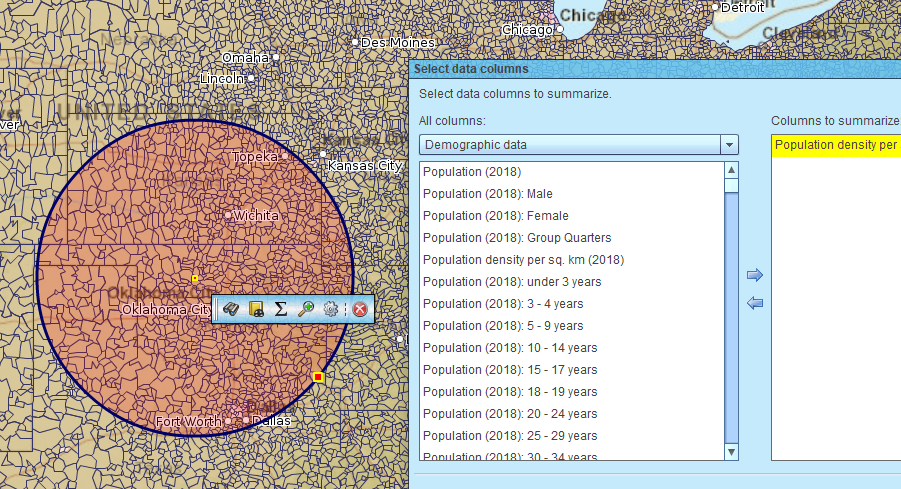
  • Demographic Data – With MapBusinessOnline subscriptions, demographic data can be downloaded by radius area or map layer object (ZIP codes) intersecting the map object.
  • Counts – Any queried map object can provide a count of the number of location data points within the map object.

Radius Search Summary Button for Demographic Data

The easiest way to conduct a radius search in MapBusinessOnline is:

  1. Key in an address into the address bar located in the top upper left corner of the application and click the Binocular icon to the right.
  2. The map view will zoom to the address point. Associated with that address point is a mini-toolbar. Click the Circle icon on the left of the mini-toolbar. The button states: “Add a circle to the map.”
  3. A dialogue opens, allowing the user to input a radius distance for the circle. Do so, and then click Add to Map.
  4. Pan back to find your circle map object boundary. Click the binocular icon to search the circle.

Read more details about conducting radius searches using MapBusinessOnline here.

Inside and Outside of the Map Object

MapBusinessOnline radius and polygon map object search return results based on all the queried locations within the target circle, polygon, territory, map layer object, or all data locations outside the target object.

  1. Select the target object with your cursor. A selected object is highlighted in bright Yellow. (BTW, that color is configurable in Map and Data Map Options.)
  2. Click the Search Data binocular icon button.
  3. In the Search Data dialogue, select the Data Layer you want to search. Click Next.
  4. Select an operation in the Create or Edit dialogue and click Create to search inside the map object. Name the search results and Click Create.
  5. To search outside the map object, check the box at the top labeled “Invert the Search Results.”

Remember, searching outside a zoomed-in tiny object, like a single ZIP code, may result in vast amounts of data.

Radius Search Options

Search Data Options

As mentioned above, Radius searches and all other MapBusinessOnline spatial searches search within a map object or outside of a map object for data locations. But the character of that search has some wiggle room.

What I mean by wiggle room is that those location points sometimes occupy a position in space that could be a bit gray or ‘close to the line.’ For instance, a point might intersect or touch a radius circle boundary and not be entirely inside the circle. A ZIP code might overlap a county boundary with most of its area outside the county. How should borderline positioning be handled?

Fortunately, MapBusinessOnline has a feature that lets the user configure the rules around near boundary location placements. It’s in Map and Data.

  1. Go to Map and Data and click the Edit Gear on the top line.
  2. In the panel that opens, Map Options Tab, scroll to the very bottom.
  3. Click the Edit Search Options
  4. Now click the Drop Down and see the three options listed:
    1. Intersect
    2. Intersect at 50%
    3. Fully Inside
  5. Select the option you prefer, then click Set Options.

Remember that your choice will be applied to all maps moving forward. So you might want to consider the option you usually prefer. On occasion, when you know, you need to collect data results that are strictly inside the circle, open up the selector and choose that setting.

Read about multiple radii searches here.

Armed with a powerful Radius tool, you may now move forward in life knowing location data is a simple mouse click away.

______________________________________________

Find out why over 25,000 business users log into www.MapBusinessOnline.com for their business mapping software and advanced sales territory mapping solution. The best replacement for Microsoft MapPoint happens to be the most affordable.

To access MapBusinessOnline, please register and download the Map App from the website – https://www.mapbusinessonline.com/App-Download.aspx.

After installing the Map App, the MapBusinessOnline launch button will be in the Windows Start Menu or Mac Application folder. Find the MapBusinessOnline folder in the Start Menu scrollbar. Click the folder’s dropdown arrow and choose the MapBusinessOnline option.

The Map App includes the Map Viewer app for free non-subscriber map sharing.

Please read customer reviews or review us at Capterra or g2crowd.

Contact: Geoffrey Ives geoffives@spatialteq.com or Jason Henderson jhenderson@spatialteq.com
Posted in Business Mapping Software blog post, How to instruction | Tagged , , , , , , | Leave a comment

How Do I Create a Startup Business Map?

Starting a new business is both exciting and frightening. We’ve all read statistics of how often new businesses fail – that’s the scary part. But if you’ve got a unique idea, a killer app, or a market you just know is ripe for the picking, a new business Startup can be very exciting.

Either way, scary or exciting, developing a few business maps for Startupartup can provide some distinct advantages. Like any other business, a startup faces both risks and opportunities. Business mapping provides visual and analysis tools that expose both opportunistic pathways and ‘Danger Will Robinson.’

Launch Startups with a Limited Geographic Scope

Unless your product or service has a full-on national customer base from day one, outlStartuplimited geographic operational scope for your new venture. Why hire salespeople in Oregon when you’re selling coffee liners to retailers in New England?  Restrain your startup at first to avoid undue growing pains in your first year.

Restricting your scope can help control costs, limit resource requirements, minimize hiring, and better manage transportation costs.

Keeping your business local can help develop nearby support services without inflating the costs of doing business. There is no need to start an LTL shipping relationship nationwide if a local currier can handle 90% of your shipping requirements.

Keeping things regional, as opposed to national, allows some time for growing pains.  The printer repair services you’re offering have plenty of potential clients in the greater Boston area.  Avoid calls outside of New England for the first year.  Produce, distribute, and support for a year to learn about your new business.

Business maps can provide operational scenario maps that suggest limited geographic scope over time.

  • An in-state restriction for the first few months.
  • A more regional scope business map for the first year.
  • Longer terms geographic area of influence once certain milestones are met.

Importing Locations Data into Your Startup Map

Your startup map should include all the addresses of your associates and support network:

  • Corporate headquarters – a home address if nothing else exists.
  • All sales, purchasing, warehouse, manufacturing employee home addresses.
  • All service locations for regional and local suppliers. Think warehousing, banks, delivery services, HVAC maintenance, food services – whatever services you require to get the job done and keep your employees happy.
  • Investor home locations.

As customers begin purchasing your goods and services, add their shipping addresses to your map. Your customer address list will quickly become the most critical location dataset in your business. Customer data is your ticket to success. The more accurate and comprehensive that data is, the more you will understand about growing your start-up.

Complete customer addresses place accurate points on your customer maps.  Accurate point placements expose more trends. Imagine plotting customers named Bob from Massachusetts and Loretta from Arizona.  Your customer map would not be very informative.  Use full name and address when collecting customer data. (And yes, I know from experience that I need to suggest this.)

Customer Demographic DNA

Over time, your customer list will expand to the point where specific ZIP codes will contain more significant percentages of your customer base. As these core ZIP codes become apparent, use business mapping software to examine their demographic characteristics. Look for:

  • EthnicitWe’rends across the population.
  • Income segments – low, medium, high-income levels.
  • Age breakdowns.
  • Gender preferences.

Try to connect demographic characteristics with the existing customer base. Businesses can establish customer demographic characteristics by surveying the customer community, extracting information from salespeople, and monitoring chats on the website.  Use whatever resources you must to better understand your customers.

The Census Bureau provides a wide variety of demographic categories and category segments from which to choose. Census Bureau demographic data is designed and published for use in demographic mapping. Age segments and ethnicities can be helpful in user assessments of startup apps sold through Apple and Anyou’veapp stores.

High volume sales of a new phone video app might obscure the demographic makeup of your users. Maybe at a $2.99 price point, your app goes viral for a time.  But if you want to sustain your market and grow your business in the long run, seek to understand your customers’ demographic. If that low-cost phone app primarily sells to 13-year-old girls, make sure you’ve got some other products in the production pipeline.

Demographic maps connect actual customers to locations or areas on a business map. As those areas become more defined based on sales volume, demographic mapping can reveal the key characteristics of your marketplace for each product.

Mapping possible business expansion using MapBusinessOnline

More than One Business Map

Once you’re up and running, consider starting a few additional business maps to get alternative views of your business.

  • Supply Side Maps – As your vendor list grows, you’ll want to see from where things are sourced. Maintain a separate vendor map to avoid cluttering up operational maps. Key suppliers will have warehouse and shipping locations. Some of these may be global. Do your best to locate these critical vendor plants on a business map.  Use your vendor map to track pricing, shipping costs, and other raw material issues.
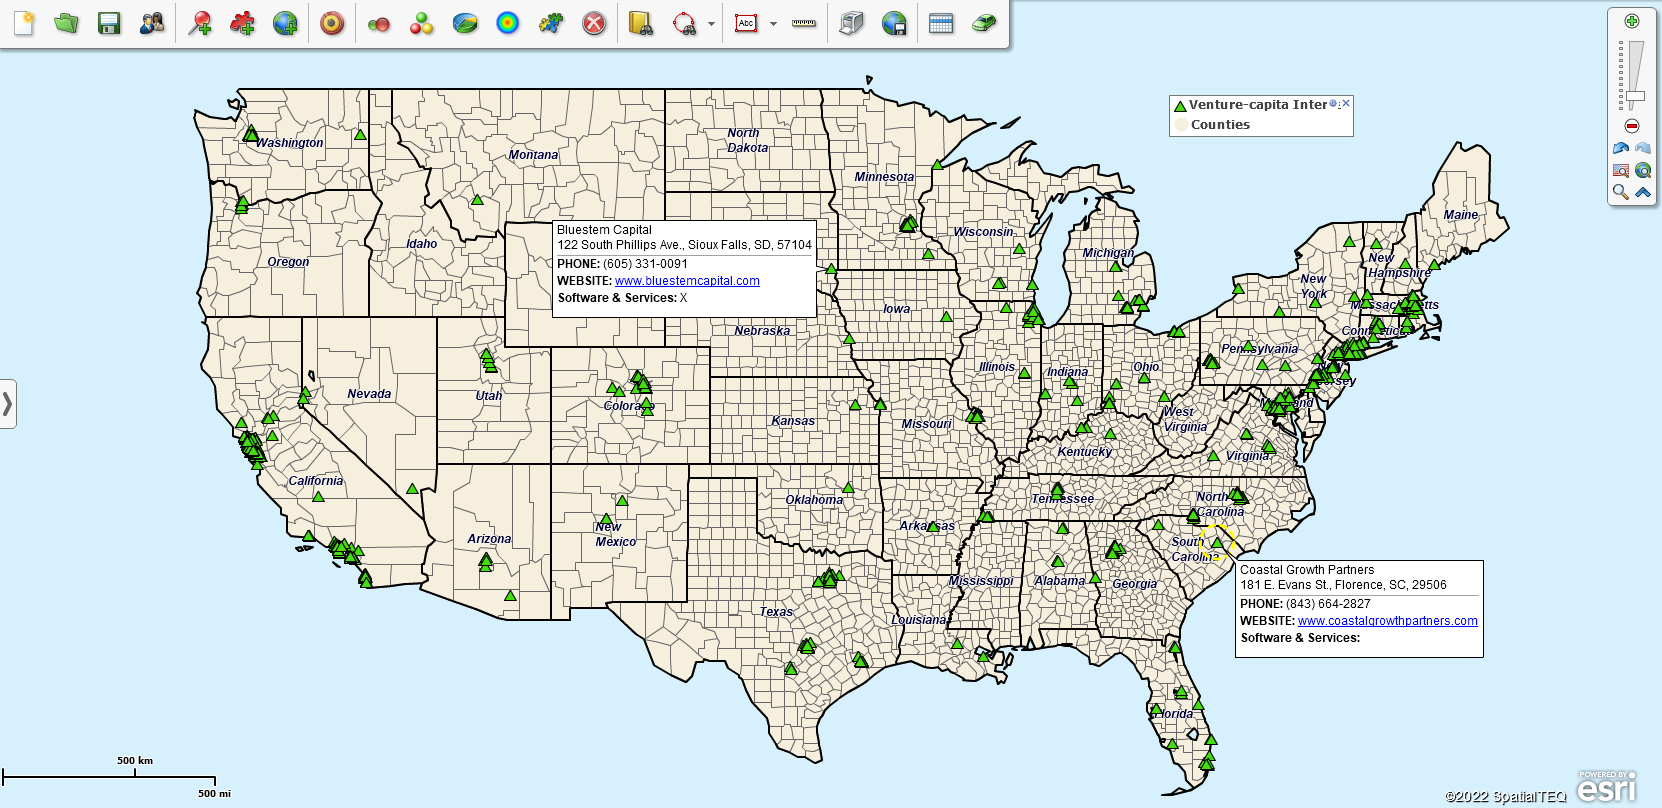
  • Venture Captial Resources – Keep track of potential funding sources.  A location-based data view of your resources can reveal odd relationships. Patterns tend to emerge in business map views. Investigating these oddities can expose unnecessary risks in your business expansion plan.

Startup Investor Resource Map

  • Field Staff Mapping – Manage your field staff using territory maps. Territory creation can assist in providing areas of accountability and managing travel expenses and commission plans. Use this map to monitor attendance and associated issues.
  • Competitor Mapping – Identify competitor locations and track activity where possible. Delegate the map work to an underling with some tech-savvy. Consider hiring an SEO company to assist with competitor analysis. They have tools that examine the most recent investments competitors make in SEO marketing.

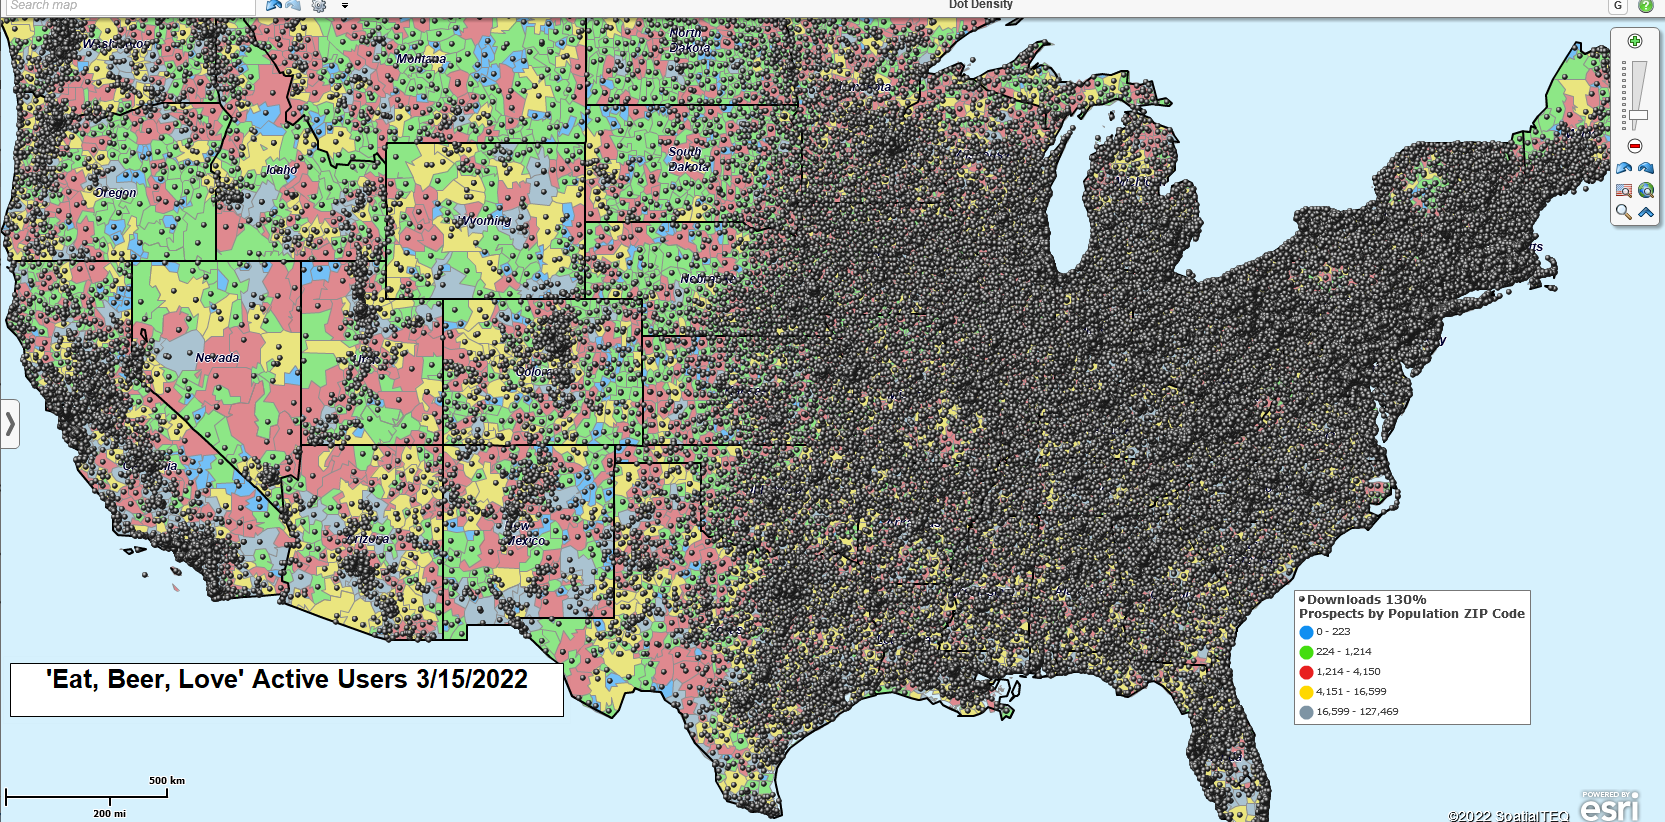
Location-based App Tracking – “Eat, Beer, Love”

There is a multitude of location-based apps you can download for activities like hiking, biking, recreational travel, and all sorts of other pursuits.  Let’s imagine we’ve created a cell phone Restaurant App in our Startup called ‘Eat, Beer, Love’ that allows users to:

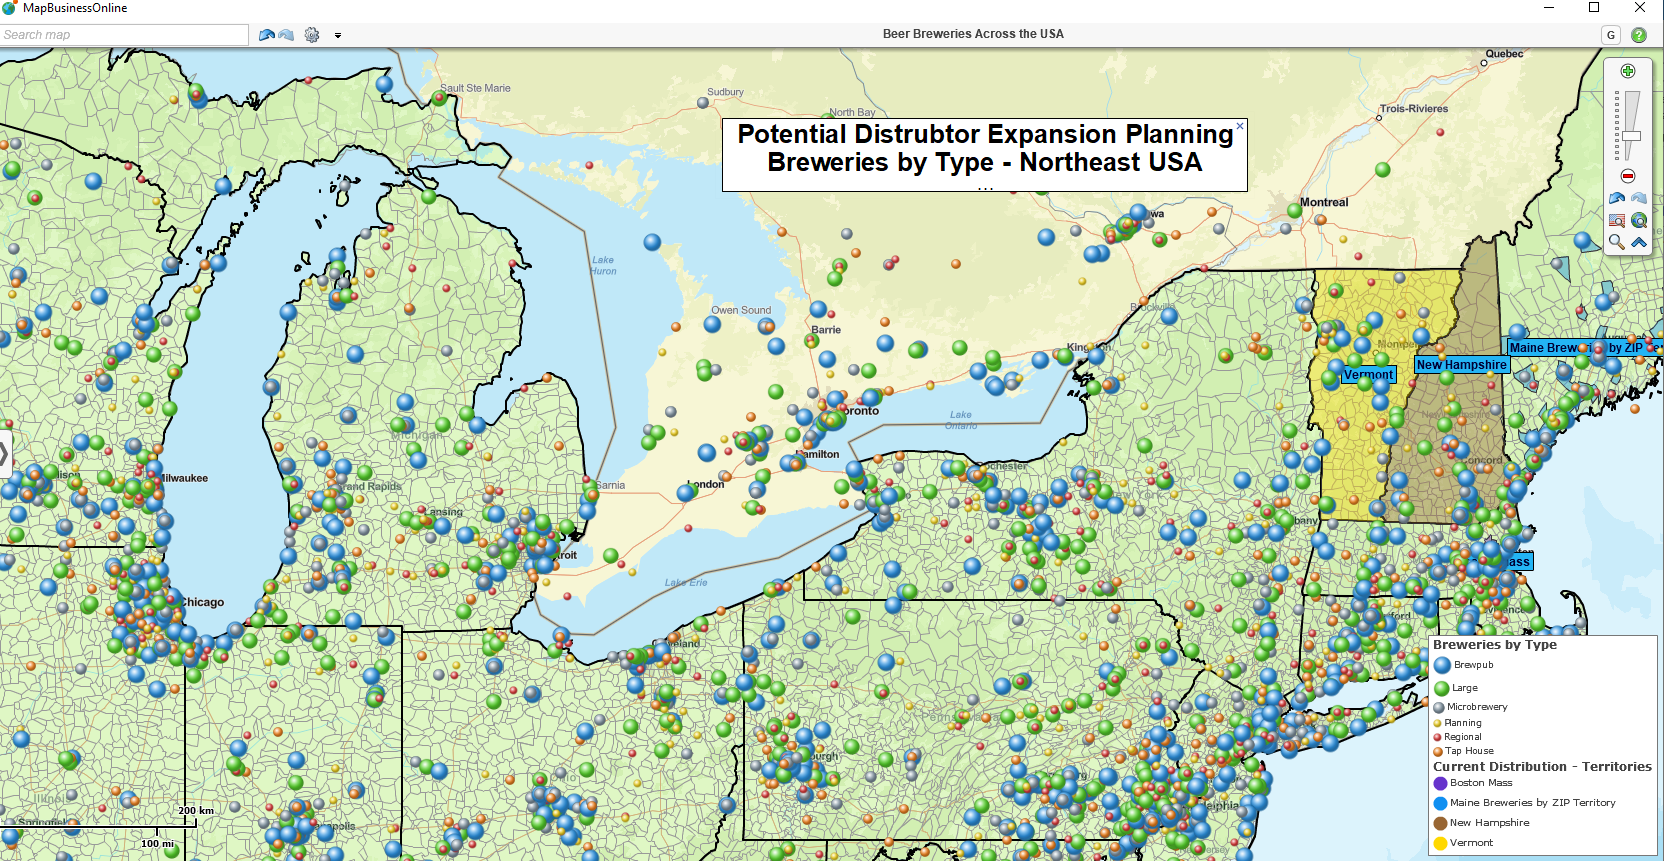
  • Locate a restaurant or brewery.
  • Find menus.
  • Instantly post reviews.
  • Match beer photos to beer descriptions on social media.
  • Create beer ‘user groups.’

While mapping features may be inherent in the app, business mapping provides a window into how the app is performing as a tool and as a sold product. User location and track files can be uploaded to a database and then pushed to a business map for analysis:

  • Dot density map views display the most vibrant cities and city areas associated with app use. Such views provide information on what works and where products have more selling potential
  • Use database tools to store location-based services data for the restaurant industry – storefront photos, product and venue reviews, even bathroom assessments may be valuable data points for social media services.
  • User data, including age, ethnicities, and income levels, paint a demographic profile of potential users.

Apply dot density mapping to a new app’s install base.

Startup Strategic Planning Maps

As your business grows, you will reach decision points where strategic planning maps can provide location-based map analysis to board members, investors, and managers. Help them understand the big picture or even drill down into details where necessary.  Use business maps to generate an operational view of where sales are occurring.  Build demographic maps of new areas of interest that match existing business area profiles.

Use map images to drive home the key points of discussion:

  • What are the primary sources for the costs of doing business?
  • Where are your best potential new customers going to come from?
  • What will your next sales territory regions look like?

They say a picture is worth a thousand words. Know that an interactive map display, using MapBusinessOnline to guide your startup’s strategic planning session, is worth a thousand pictures.

Like all businesses, startups can benefit from planning and analysis. Use business mapping software as the startup visualization platform. Let the details of your Startup venture serve as guidelines and guardrails that light a pathway for further endeavors.

And who knows?  Maybe you’ll turn a failed Startup financial disaster into a hit Netflix series and live happily ever after your jail term expires.

_______________________________________________

Find out why over 25,000 business users log into www.MapBusinessOnline.com for their business mapping software and advanced sales territory mapping solution. The best replacement for Microsoft MapPoint happens to be the most affordable.

To access MapBusinessOnline, please register and then download the Map App from the website – https://www.mapbusinessonline.com/App-Download.aspx.

After installing the Map App, the MapBusinessOnline launch button will be in the Windows Start Menu or Mac Application folder. Find the MapBusinessOnline folder in the Start Menu scrollbar. Click the folder’s dropdown arrow and choose the MapBusinessOnline option.

The Map App includes the Map Viewer app for free non-subscriber map sharing.

Please read customer reviews or review us at Capterra, or g2crowd.

Contact: Geoffrey Ives geoffives@spatialteq.com or Jason Henderson jhenderson@spatialteq.com
Posted in Business Mapping Software blog post, How to instruction | Tagged , , , | Leave a comment

Boldly Create Map-based Business Analysis from Your Location Data

Virtually all companies have location data on hand that could be imported into business mapping software to create relevant business analyses.

Understanding where you do business is essential to a plan for expanding your area of influence and growing revenue. A customer address list is probably the most obvious and commonly used location dataset applied by MapBusinessOnline users. Visualizing customers against an accurate map can define a business’s operation theater.

By importing a basic customer ZIP code spreadsheet derived from a customer address list, a business can create an overall territory or region that represents the area in which they operate. Add sales representative home addresses to that dataset, and you’ve got a set of individual territories by sales rep. Better yet, you’ve got accountability by associating sales representatives to a territory map.

An accountable salesforce means managers know who to ask to get information about account-by-account sales progress. It also helps support teams understand which sales rep gets to answer the inbound customer call. And, of course, accountability helps to apply commission payments to the right people at agreed-upon rates. Accountability keeps the whole team happy.

Sales Territories Answer Questions

Sales territory maps answer questions like these:

  • Which sales reps are responsible for specific accounts?
  • Who handles new business in these ZIP codes?
  • Which sales rep is closest in proximity to the significant customer asking for help right now?
  • Who sold the most product across the entire business sector this quarter and why?
  • Do we need more salespeople or more sales territories?
  • Which lucrative industries are we not selling to this year?

Read more about sales mapping here.

Nation-wide Sales Territory Mapping in MapBusinessOnline

Business maps are great at answering questions. Maps turn imported address datasets into marketing and sales analysis. Business maps are the point of convergence between distinct dimensions of reality like location and activity. Far fetched, you say? Address locations overlayed with demographic data and sale activity combine to offer a blueprint for business growth. If we can do this business in Massachusetts, we can do it in other states with similar business and population characteristics.

Demographics by ZIP Codes

GZIP codes are just one map layer. In addition to ZIP codes, counties make a great base map layer for territory mapping. Counties tend to be more appropriate for rural areas and for businesses that cover entire states or groups of states. Most business people have a good feel for their area’s preferred territory map layer.

ZIP codes are often the best territory building blocks in urban areas with high population densities. Fortunately, demographic data from the US Census Bureau is available for all map layers, from State on down to Census tract.

Territory Map by ZIP Code with Demographic Data Using MapBusinessOnline

Adding demographic data to a territory business map helps define the customer base’s characteristics. It’s not always easy to nail down a customer base’s unique demographic profile, but patterns will emerge if you analyze the data and the map segments long enough.

Understanding the Why Factor

All ethnicities, ages, and incomes levels consume products and services like batteries, dentistry, Internet services, pizza, pet beds, swimming pool chemicals, and underwear. Businesses that track sales by customer and area of interest will see where products sell. When market analysis results indicate products are moving more quickly in territory X, further analysis will show why.

Why do AA batteries sell in such large numbers in a particular county? Look for relationships between demography, products/services, and sales numbers. What drives AA battery sales?

  • Power outages.
  • Children’s toy purchases.
  • A popular new product on the market.
  • Advertising.

Further investigation may be in order. Business maps help organize and visualize sales data. Perhaps a company sales rep visits some of the major battery retailers in the area and asks some questions. A well-managed and optimized business map collects the data and presents facts by location. Patterns inevitably appear. Share your product maps with your management team.

MapBusinessOnline supports the import of multiple types of locations data:

  • Address spreadsheets formats: . XLS, .CSV, and other standard file formats. These spreadsheets should separate address components into columns as noted here – Address | City |State | ZIP code.
  • Latitude and Longitude coordinates.
  • GPX files from portable navigation devices or field data collectors.
  • Manually plotted points for remote locations where addressing does not exist.

Map editors can enrich location datasets imported into MapBusinessOnline with geographic and demographic data. Business listings are also available within the application (for a modest fee.) Business listings are searchable by City, State, or ZIP code and by polygon and radius search. These listings are searchable by NAICs and SIC industry codes. Read more about business listings here.

Geographic/location-based analysis of imported business data supports many applications, including:

  • Competitor analysis.
  • Crime analysis.
  • Customer visualization.
  • Demographic analysis.
  • Driving time and driving distance analysis.
  • Expansion planning.
  • Field staff management – technician, clinician, and repair teams.
  • Map-based market analysis.
  • Operational logistics.
  • Resource mapping.
  • Political analysis.
  • Sales and marketing campaign management.
  • Sales planning with optimized routing.
  • Sales territory management.
  • Strategic planning and SWOT analysis.

Major industries applying MapBusinessOnline to the above applications include:

  • Banking and Finance
  • Construction
  • Food services
  • Franchising
  • Government
  • Health care
  • Insurance
  • Manufacturing
  • Marketing and Sales.
  • Retail
  • Transportation
  • A wide variety of Service industries

The location data for your business is locked in your business systems – order entry, CRM, delivery systems, and accounting systems. Get at those databases and import them into online mapping software. Discover the trade patterns happening within your business. The time for you to drive your business into new dimensions is now.

Yes, you must boldly go where no man or woman has gone before.

_______________________________________________

Find out why over 25,000 business users log into www.MapBusinessOnline.com for their business mapping software and advanced sales territory mapping solution. The best replacement for Microsoft MapPoint happens to be the most affordable.

To access MapBusinessOnline, please register and then download the Map App from the website – https://www.mapbusinessonline.com/App-Download.aspx.

After installing the Map App, the MapBusinessOnline launch button will be in the Windows Start Menu or Mac Application folder. Find the MapBusinessOnline folder in the Start Menu scrollbar. Click the folder’s dropdown arrow and choose the MapBusinessOnline option.

The Map App includes the Map Viewer app for free non-subscriber map sharing.

Please read customer reviews or review us at Capterra, or g2crowd.

Contact: Geoffrey Ives geoffives@spatialteq.com or Jason Henderson jhenderson@spatialteq.com
Posted in Business Mapping Software blog post, How to instruction | Tagged , , | Leave a comment

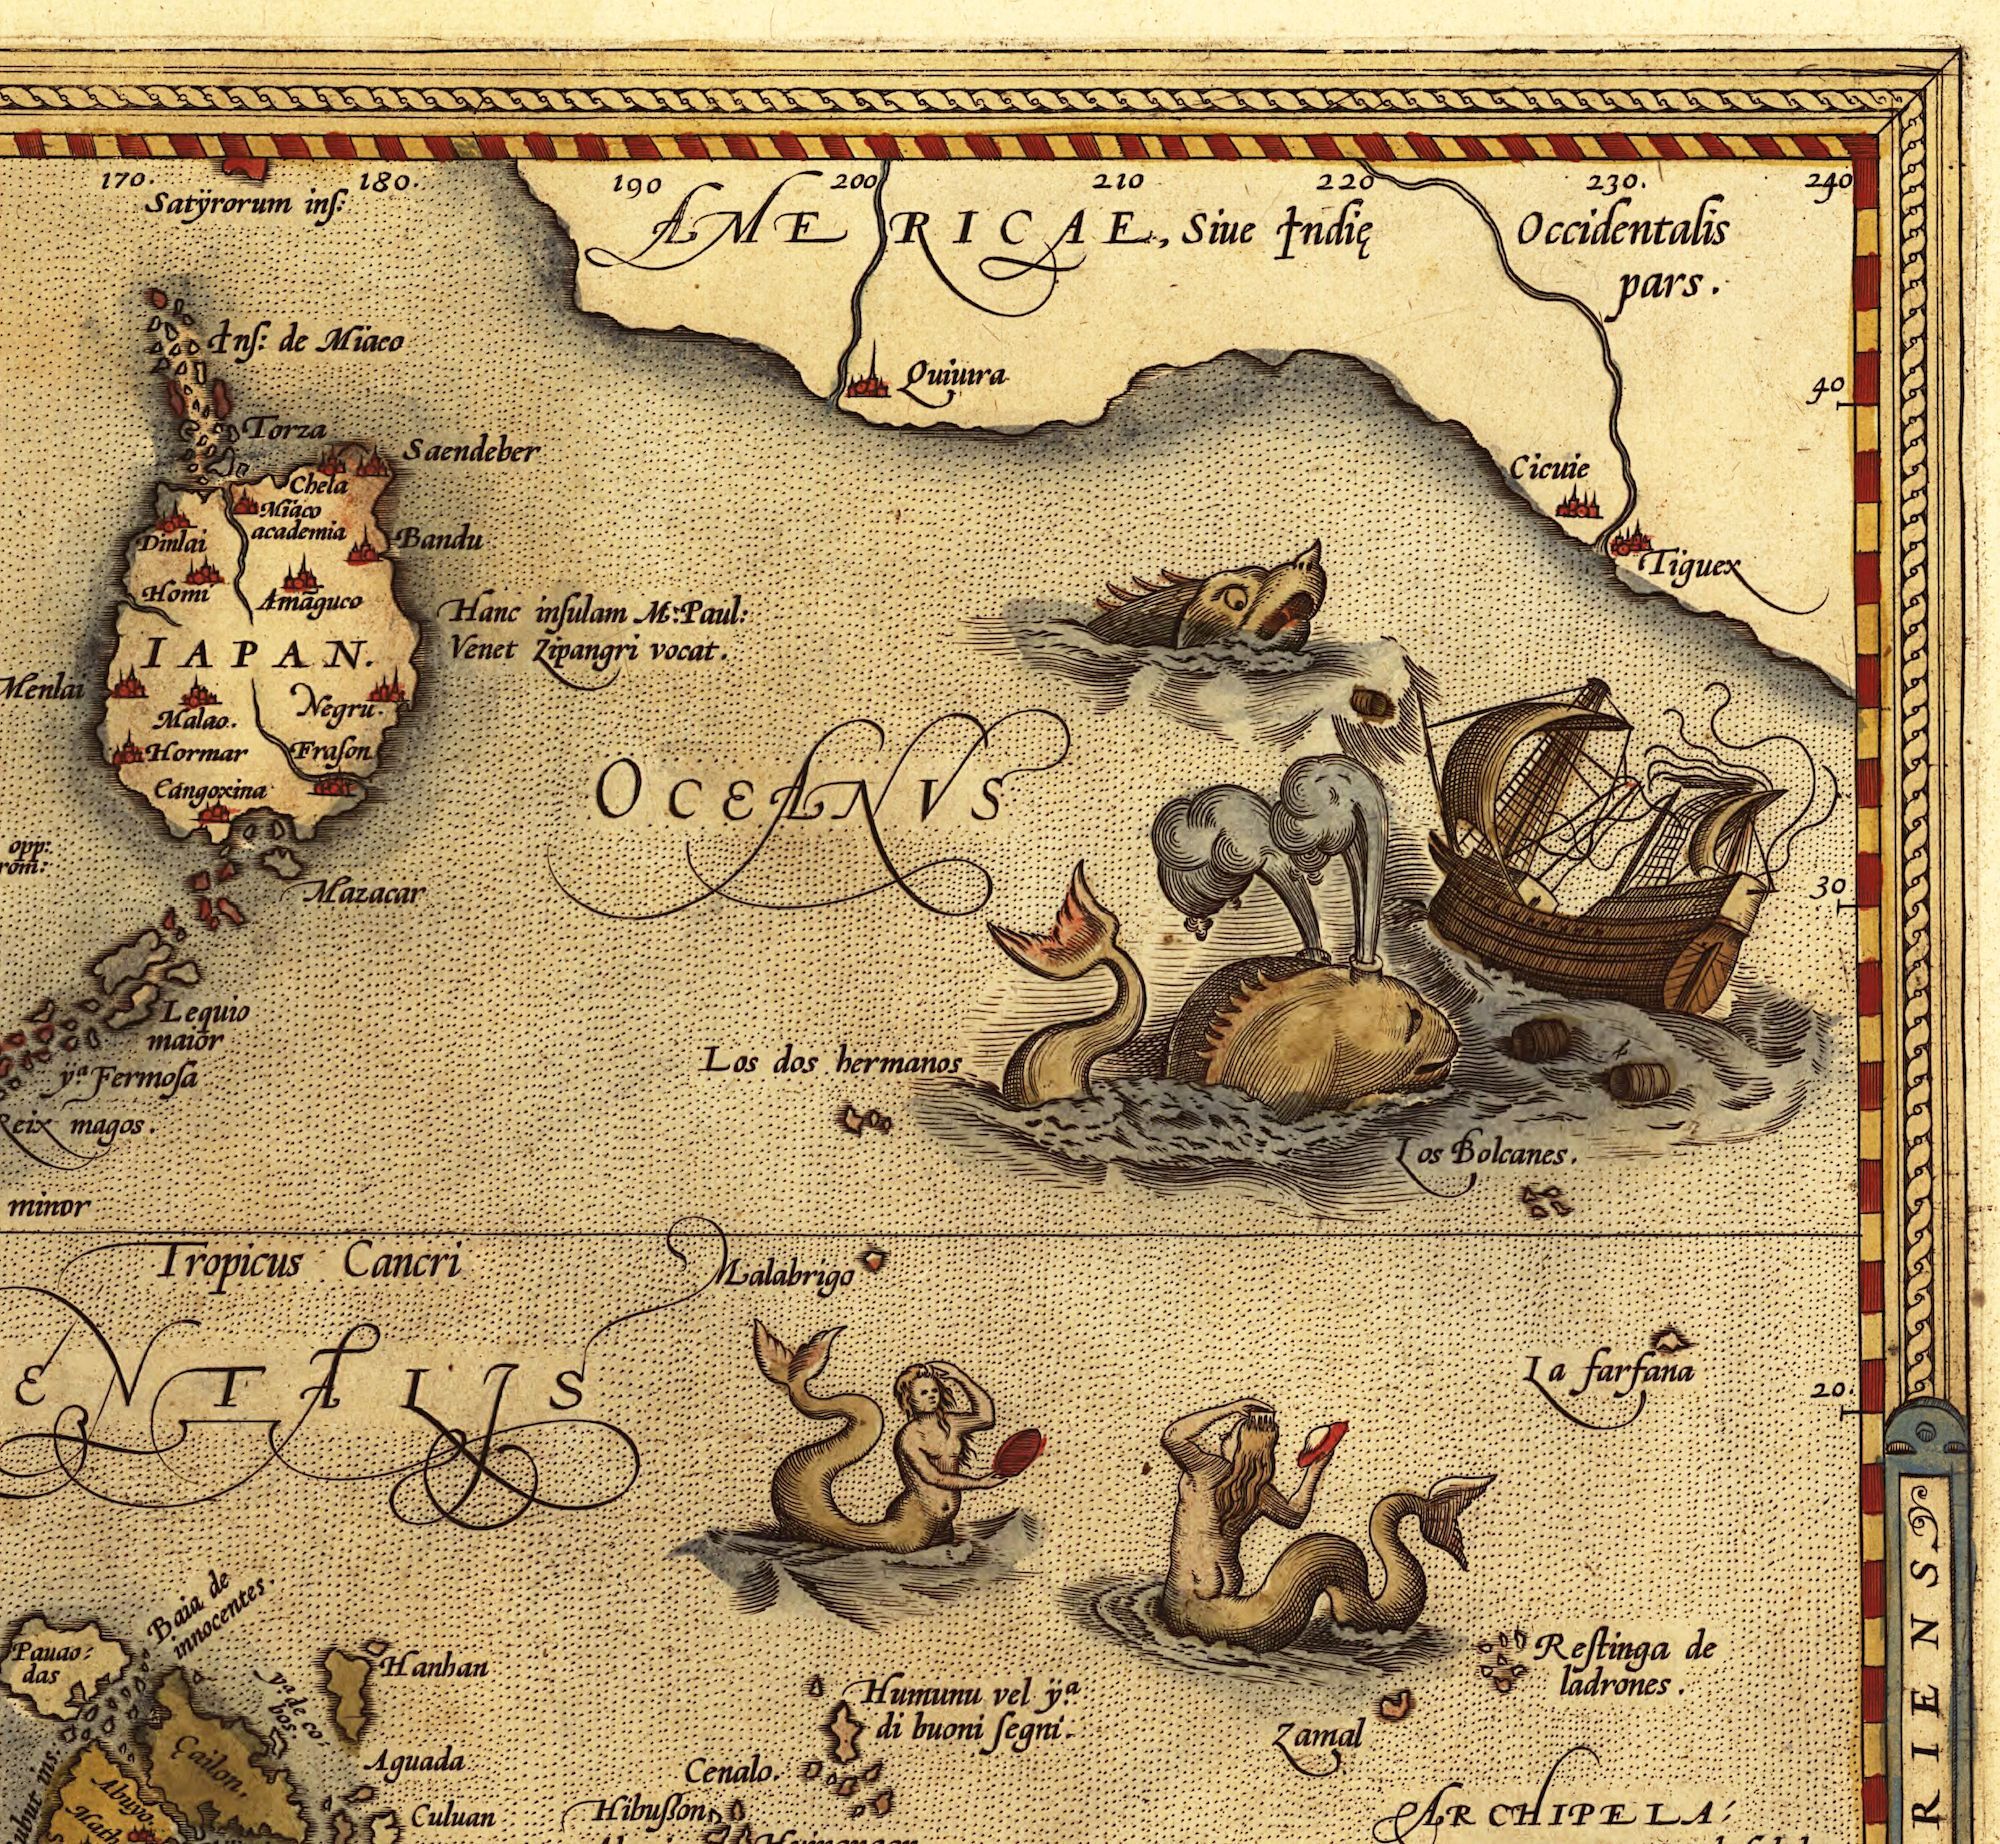
Use Business Maps to Communicate Concepts – Real, Fake, or Imagined

Business Mapping Software is a digital tool used to create map images. Business mapping software melds a variety of map layers together to create map images that communicate a business concept. Nearly all industries use business map images – from run-of-the-mill variety stores to dentists (yup – lot’s of dentists actually.) These map images support or attempt to support business objectives.

Sometimes business mapping objectives are achieved with wild success, and at other times business maps can miss their mark.

Beware of Redline Maps

Real estate industry map images are everywhere. Business mapping sites like Zillow or Realtor.com make it so. But serious investment in real estate warrants maps that provide demographic profiles of towns, cities, and neighborhoods. Demographic layers included in these analysis maps show Census Bureau categories such as predominant ethnicities, median income levels, population segments by age. The list of categories is quite long.

Demographic categorization on a business map can impact housing values. Rising income levels, lower crime rates, and residential vs. commercial zoning can drive property values. High crime rates, proximity to highways, and ethnic anomalies can force property values down. There is a ‘chicken and egg’ cause and effect relationship here. Racism is a thing, but let’s leave it at that.

Banks assessing loan portfolios by area of interest will be very interested in demographic characteristics by community or neighborhood. Maps depicting demographic profiles by district can be beneficial for the careful investment firm. But map creators can manipulate to show a rosier or grayer picture than reality.

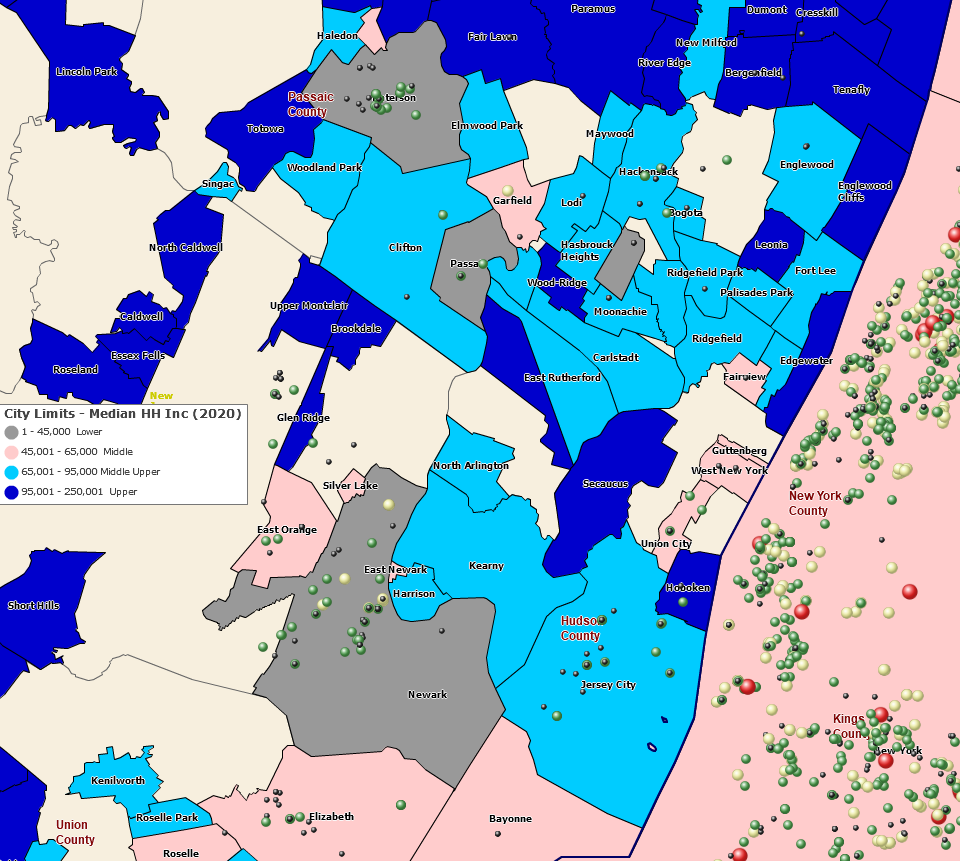
Income Map by City Limit

Urban areas, sometimes classified in ways that discourage investment and perhaps drive up the apparent need for government services, like education and law enforcement, are sometimes misrepresented. This process of map manipulation is called redlining. Redlining has a history here in the USA.

In my experience, redlining pushes the edges of lower-income sections into higher-income districts to encourage house flipping. Inexpensive and run-down houses are purchased on-the-cheap if they are within a certain radius of an up-and-coming, gentrified neighborhood. After largely cosmetic repairs are complete, the house is ‘flipped’ or quickly sold to hapless new owners who are left to navigate the realities of their investment over time.

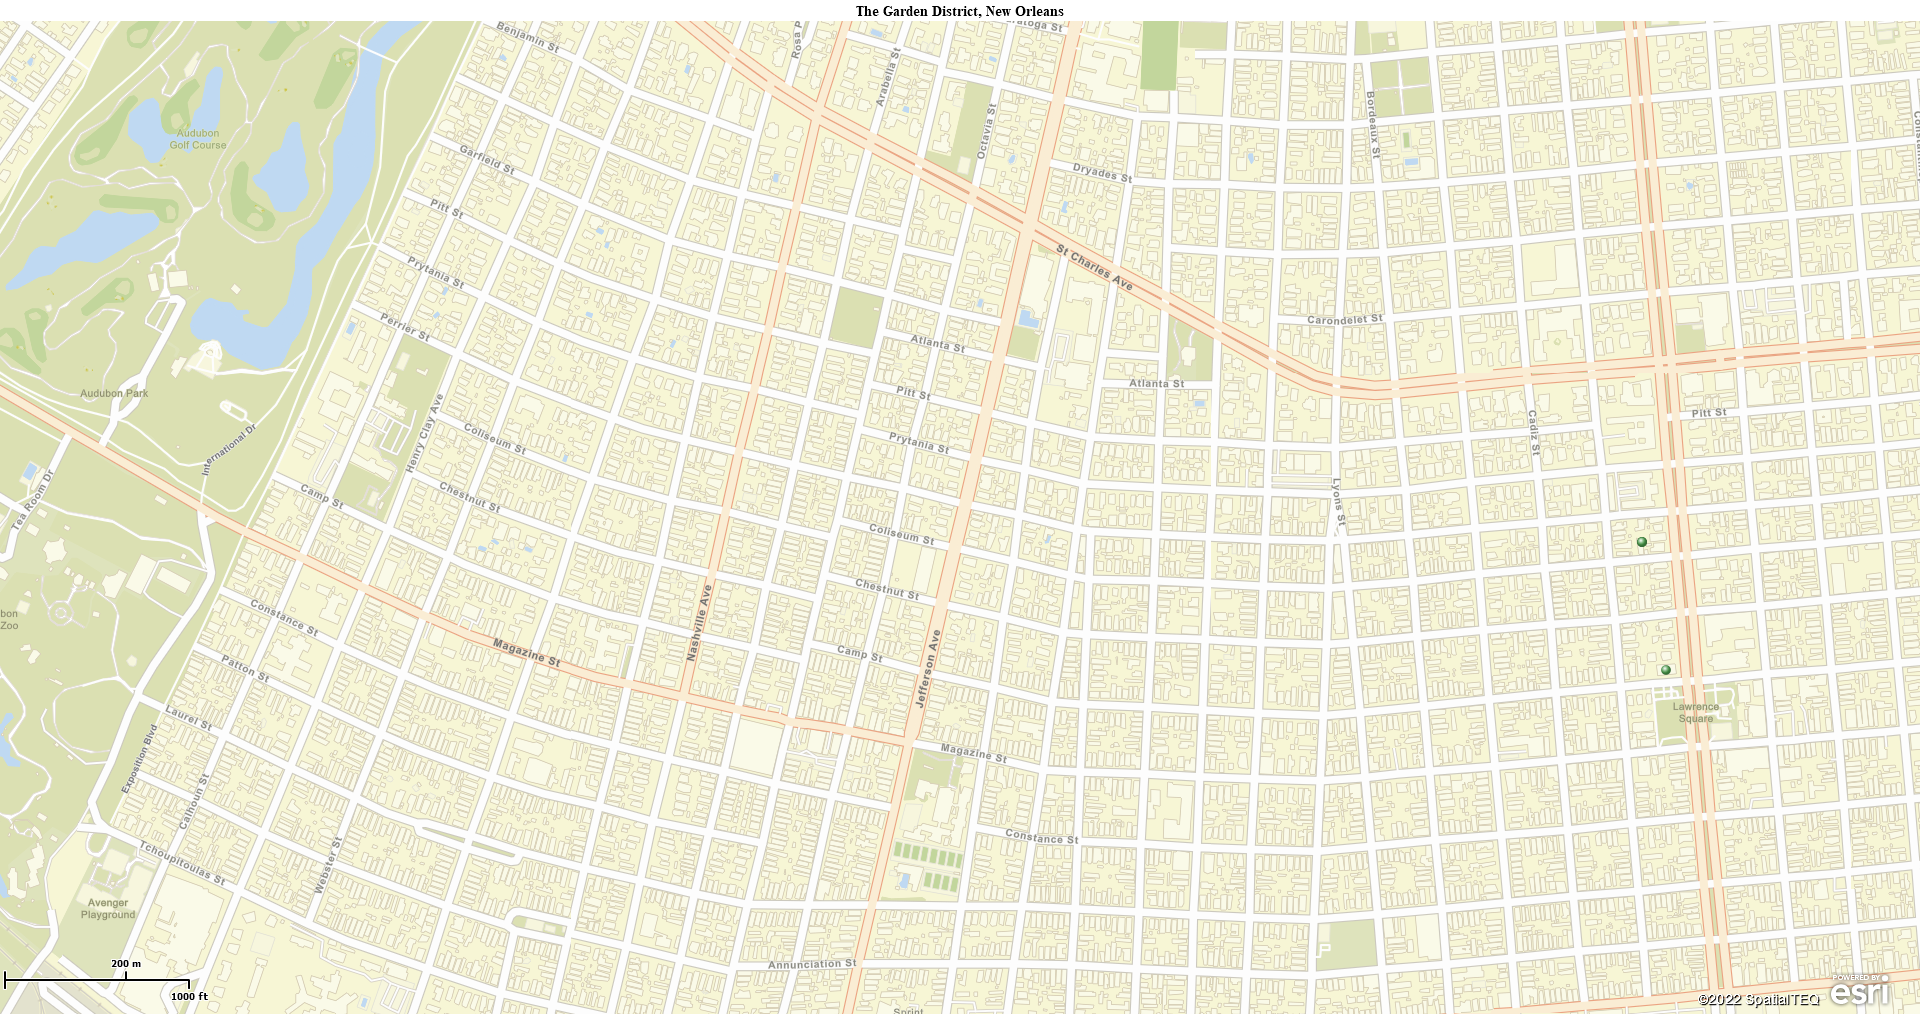
Housing appraisals can be fascinating to view. Appraisers use business maps to document their value assessments. State and federal agencies regulate appraisers. Just last week, while visiting New Orleans, our bus tour guide pointed out a house on the north side of St. Charles Street, in the Garden District, valued significantly less, at $2.5 Million, than a comparable house on the same street on the south side. The tour guide said the aforementioned lower value house ‘was on the wrong side of the track.’

NOLA Garden District

Building inspections and appraisals of a home and neighborhood are requirements for serious home investors shopping for bargains in any market. Real estate pros use business maps to cross-check property maps and transactions. Hire a map expert or purchase a subscription to a business map software.

  • Double-check demographic data references.
  • Check the boundaries on neighborhoods and jurisdictions with town offices.
  • Investigate home histories with housing inspectors, fire departments, and public service offices.

Retail expansion planning can incur the same challenges as home shoppers when business expansion plans require searches for new locations.

Truth Tracking and Crime Mapping

Crime investigators use various tracking services to determine if suspects were where they said they were when a crime occurred. Cellular phone triangulation and GPS tracking are accurate services for verifying presence in almost all cases. For this reason, cellular phone records are essential to modern criminal investigations.

Tracking devices make a case for prosecutors or support the inquiries of business managers chasing down employee grift. For example, location-tracking services verify a contractor’s car is parked onsite for scheduled work. A GPS device confirms where a murderer’s mini-van was located at a victim’s time of death.

Business mapping software, like MapBusinessOnline, plots GPS tracks, including latitude-longitude coordinates or GPX files. Import these files like a spreadsheet and view critical placements on the map with time stamps.

Crime mapping is the process of placing know crime locations on a map so that a pattern emerges or associations become apparent. With multiple trackable systems available, mapping has become one of the most powerful tools in a crime fighter’s toolbox.

Even a business manager, reviewing expense reports, can expose graft by importing expense records onto a business map. Suspecting a traveling salesperson of falsifying records, I once mapped out a set of submitted expense reports to verify their ‘accuracy.’

I learned how easy it was to expose cheating on expense reporting. Suspecting false submittals, I dug into a direct report’s expense records. Phone and email records submitted by the traveling employee showed locations at specific times either by time-stamped record or deduction. Restaurant and turnpike toll receipts defined where my suspect traveler was on particular days – usually at home. And finally, a quick call to a referenced customer to verify that an expensive romantic dinner on a Friday night was enjoyed by my salesperson and his wife and not the customer. Case closed.

Bottom line: don’t even think about trying to murder someone these days unless you want to get caught. When in doubt about criminal or non-compliant activity, try mapping it. Mapped locations have a way of exposing the truth.

Maps for Good and Bad

Mapping has come a long way since the days of the great ocean explorers, when most maps were vague and filled with assumptions. ‘There be dragons’ was a favorite stopping point.

Ancient cartographers mapped Rome’s battlefields and lines of control, as opposed to retail distribution models and dental business marketing plans. Nowadays, business maps are more likely to combine geographic details with demographic realities, time-stamped data placements, and climate threatened areas. Viewing today’s maps feels a bit like the future is now. We’re almost back to ‘there be dragons’ again.

Ancient Business Map

Map Like Insurance Companies

I find the insurance business, an ancient industry dating back to Mesopotamia is a field to watch for appropriate use of business mapping tools and other location-based systems. (Although I’m sure we could find examples of insurance map manipulation if we dug into it.) while pharmaceutical companies and hedge funds manipulate markets and financial products to gain outrageous profits at the expense of all of us, insurance companies live and die on safe bets.

Suppose an insurance company thinks it’s a pretty good bet that wildfires are going to rip through a county soon. In that case, insurance premiums in that area will increase dramatically. While the Republican party refused to allow Florida scientists to publish papers containing references to climate change and global warming, insurance businesses raised the premiums on coastal home flood insurance policies. They even removed insurance altogether for homes that flooded more than once over the last 20 years.

Climate change is essential for the insurance industry to understand and factor into business analysis—reality and truth matter.

Insurance companies use map images wisely to address real problems impacting their bottom line. GIS software can overlay historical flood maps on top of coastal property maps – you know, the neighborhoods of McMansions – along with ten-year disaster maps to develop high-risk weather impact areas. These maps cover the most valuable housing stock in the USA. Coastal areas under climate threat are potential business killers for insurance companies. Insurers conduct their map analysis carefully to hedge their bets and protect their investments.

Business map images support all the above scenarios in one way or another. For good or for evil, maps communicate a concept. Use your business map accordingly. Proper business mapping etiquette would include:

  • Importing reliable and accurate location datasets.
  • Creating maps that are easy on the map viewer’s eyes – appropriate color shades, spell-checked with relevant lines of text, no clutter.
  • Never use disinformation, lies, or hyperbole.

Super-Man

Maps represent ‘ground truth,’ an intelligence agency term. Let’s keep it that way. ‘Truth, Justice and the American Way’ can still be the motto of Super Man, even if his uniform now comes in rainbow shades or his signature’s pronoun might be his, her, or them.

_______________________________________________

Find out why over 25,000 business users log into www.MapBusinessOnline.com for their business mapping software and advanced sales territory mapping solution. The best replacement for Microsoft MapPoint happens to be the most affordable.

To access MapBusinessOnline, please register and then download the Map App from the website – https://www.mapbusinessonline.com/App-Download.aspx.

After installing the Map App, the MapBusinessOnline launch button will be in the Windows Start Menu or Mac Application folder. Find the MapBusinessOnline folder in the Start Menu scrollbar. Click the folder’s dropdown arrow and choose the MapBusinessOnline option.

The Map App includes the Map Viewer app for free non-subscriber map sharing.

Please read customer reviews or review us at Capterra, or g2crowd.

Contact: Geoffrey Ives geoffives@spatialteq.com or Jason Henderson jhenderson@spatialteq.com
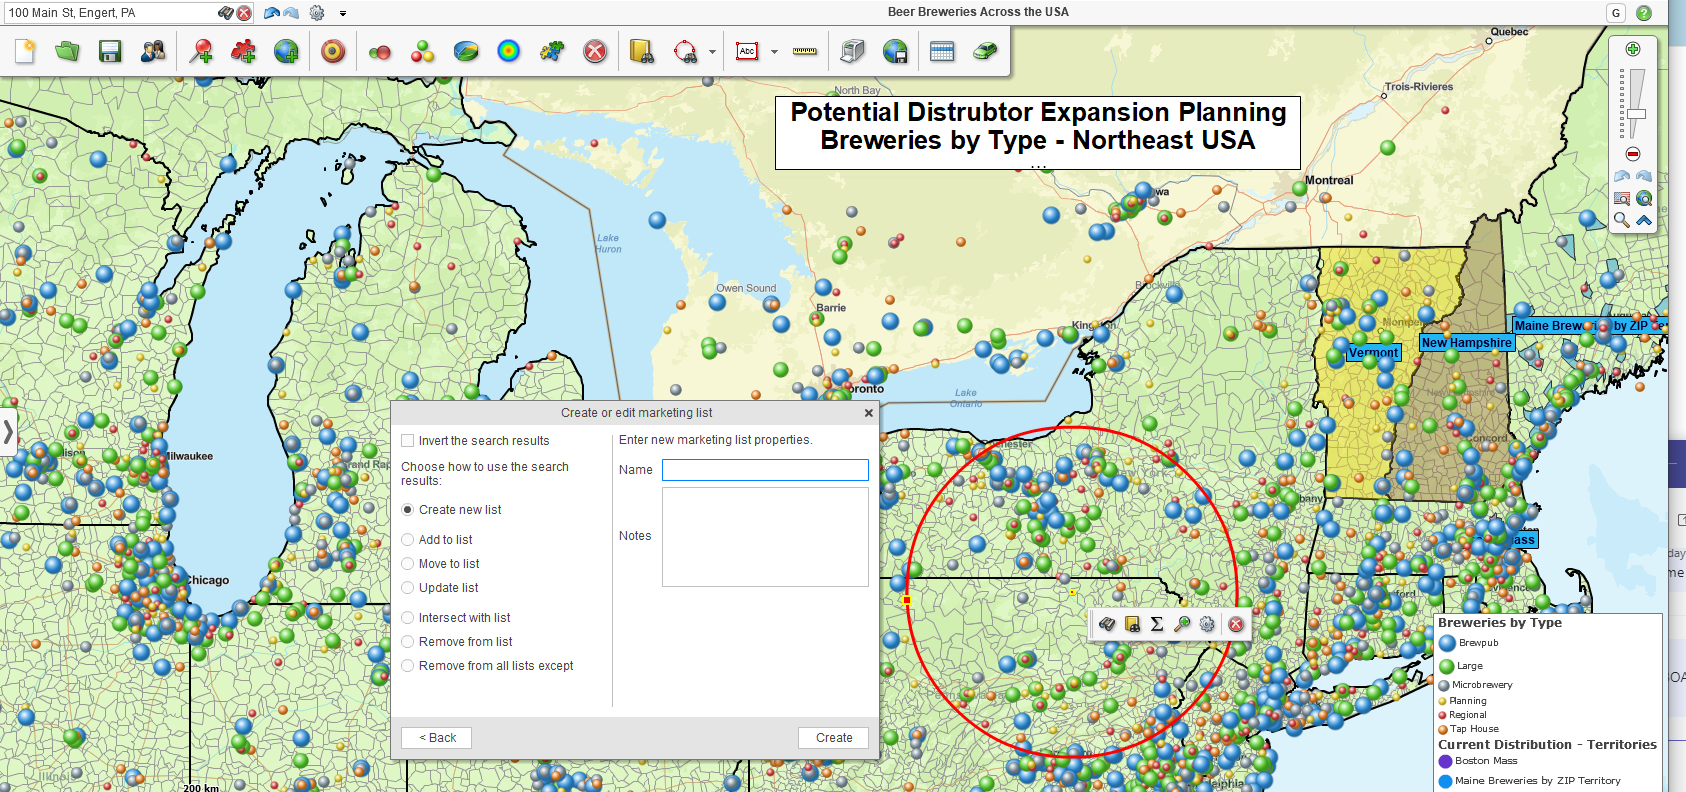
 

Posted in A story, Business Mapping Software blog post | Tagged , , , | Leave a comment