View data in table
This article describes how to work with Data window.
You can use Data window to view data in tabular format. Table viewing supports both datasets plotted on map and map layers that come with MapBusinessOnline such as states, counties, or ZIP codes.
- Normally after you plot data on map Data window will open automatically. If you closed Data window you can always open it back by clicking following icon on toolbar.

- You can change what dataset or marketing list is currently visible in Data window by changing selection in corresponding box on Data window toolbar (see the picture below). There are also symbol and size controls to choose dataset symbol to be used on map.

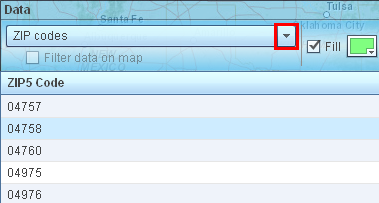
- You can also select to view map layer data, for example ZIP codes.
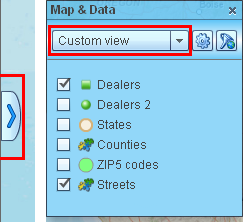
- If ZIP codes are not listed in the box then you will need to select appropriate map view first:
- Open Map & Data window if it is not already open. Click the tab with blue arrow centered on the map’s left side.
- Select Custom view in Map & Data window.
- When you select dataset in Data window, it normally shows all data variables available. That is different for map layers such as ZIP codes. Initially only name (or ZIP code) is visible. You can choose to view additional data as following:
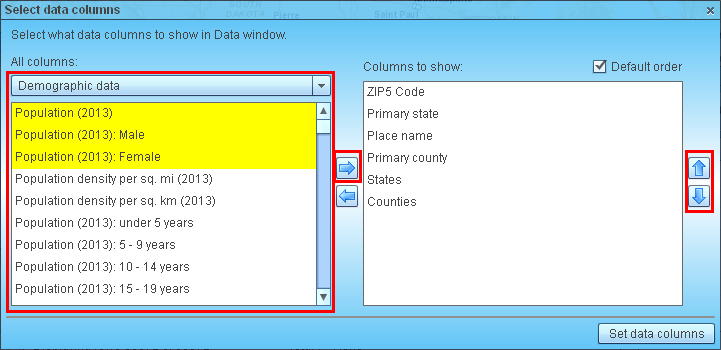
- Click ‘Add data’ button at the status bar of Data window. That will open ‘Select data columns’ dialog.
- Inside ‘Select data columns’ dialog select desired data on the left and click right-arrow icon to copy that data to view in Data window. You can choose demographic or summarized business data groups in the box above the data column list.
- Use up and down arrows to change columns order in Data window.
Click ‘Set data columns’.

- You can search data by name in Data window. In the following example dataset is searched for companies that have California as part of name. To return to all rows in Data window click Clear icon.
When searching ZIP codes you may use ZIP code range as following:- 75080-75100 defines a range of ZIP codes from 75080 to 75100 inclusive.

- Sometimes you need to search data by more complex criteria than company or customer name. That is when data filter comes into play. Click filter icon to open ‘Filter data’ dialog.

- Inside ‘Filter data’ dialog you can add multiple filter criteria. Use ‘Add criteria’ for that. Click ‘Filter’ to apply data filter. In example below we search all dealers that are in state of California and have sales between 1,000,000 and 5,000,000.
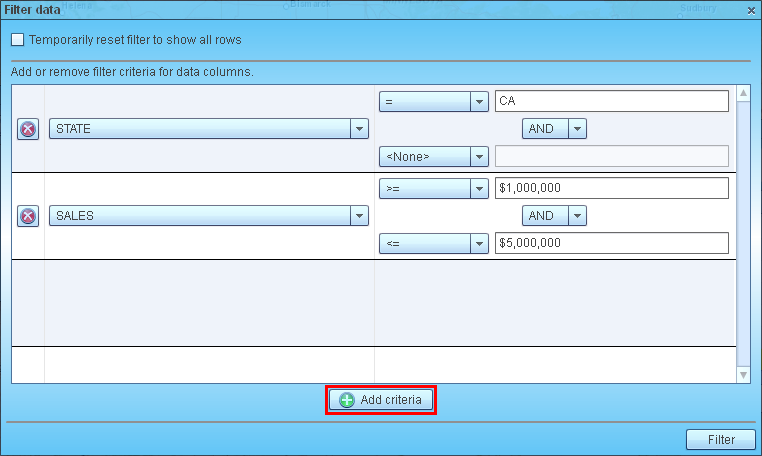
- When data filter is on, you will see that filter icon changed to green. Data window also adds small filter icons to all data columns that participate in data filter criteria. On Data window status line you can see number of rows that match current filter.

- To clear data filter just go back to ‘Filter data’ dialog and remove all criteria or check box at the top to temporary disable filter.

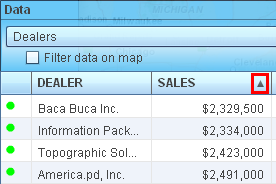
- You can sort data in Data window. Just click caption of a data column that you want to sort. Indicator of sort order will appear inside the column caption. Clicking column caption several times switches sort order between ascending, descending, and none.
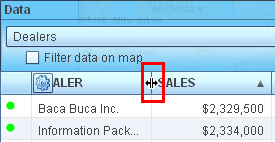
- To resize a data column just move mouse cursor over column’s caption right edge (cursor will change to resize), press left mouse button, and drag mouse to resize the column.
